Friday, October 30, 2020

Bloomberg: Here’s What Economists Are Saying About China’s New 5-Year Plan - Bloomberg

Here's What Economists Are Saying About China's New 5-Year Plan

by Enda Curran

Economists zeroed in on China's focus on quality economic growth and its technology ambitions in the 14th five-year plan released Thursday.

https://www.bloomberg.com/news/articles/2020-10-30/here-s-what-economists-are-saying-about-china-s-new-5-year-plan?sref=woWS9Szx

Economists zeroed in on China's focus on quality economic growth and its technology ambitions in the 14th five-year plan released Thursday.

A communique released after a four-day meeting of the Communist Party's Central Committee gave a broad outline of the plan as well as sketching out a vision for the economy as far as 2035.

Five Year Plans

China's economy has experienced much upheaval since the first plan started in 1953

Source: Data compiled by Bloomberg

Here's a look at what economists are saying about the plan:

Quality Growth

The communique implied an aggressive path of economic expansion without mentioning the pace of gross domestic product growth explicitly. The previous five-year plan in 2015 had outlined a goal for medium-to-high growth.

Thursday's statement "said that China's GDP per capita should match the level in moderately developed countries by 2035," economists at Australia and New Zealand Banking Group, led by Raymond Yeung, wrote in a note. "Although no specific figures or names were mentioned, a reasonable expectation is that China will aim to reach GDP per capita levels similar to that of South Korea, Israel, or Spain over the next 15 years. The GDP per capita of these countries are $35,000-40,000 in today's prices, compared with China's $10,261 in 2019."

What Bloomberg Economics Says...

Though the plan doesn't mention a numerical growth target, "it requires significant enhancement in the quality of the economy, reflected in innovation, more advanced industrial fundamentals and a more modern economic system. To achieve these, it emphasized tech innovation, supply-side structural reform, dual cycle."

-- David Qu, China economist

Innovation Push

UBS Group AG said the focus on technology and innovation will accelerate an industrial upgrading.

"We think China may target a higher spending in R&D (possibly 3% of GDP by 2025) and education in the new five year plan," UBS economists Wang Tao and Ning Zhang, wrote in a note. "In light of tech restrictions, China may allocate more resources to fundamental and frontier research, and technology bottleneck areas."

On its digitalization plans, "we think China will invest more in its "new infrastructure" including 5G networks, AI and data centers in the new five year plan," the economists said.

Opening Up

China pledged to continue opening up its economy and to take it to a "higher level."

"The fifth Plenum called for international collaboration through high-level opening up," Barclays Plc economists led by Chang Jian in Hong Kong wrote in a note. "The communique called for promoting trade and investment liberalization, advancing the "Belt and Road" high-quality development, and actively participating in the reform of the global economic governance system."

The commitments are in line with recent comments from President Xi Jinping, who says China must actively cooperate with all countries, regions and enterprises, including with those in the U.S., the economists wrote.

Domestic Demand

China's focus of raising domestic demand to achieve more sustainable growth means "boosting total factor productivity and rebalancing economic development across sectors/regions," economists at Goldman Sachs Group Inc. wrote in a note.

"Although the Chinese government has been calling for a transition in the development model for a number of years, given that the broad external and domestic environment has changed, we think the government is likely to accelerate the pace of relevant reforms in the next five years, to achieve sustainable, balanced and high quality growth and enter the high income group from the upper middle income group."

Donald Trump and Jair Bolsonaro Plot to Get Brazilians Killed [feedly]

Donald Trump and Jair Bolsonaro Plot to Get Brazilians Killed
http://feedproxy.google.com/~r/beat_the_press/~3/MuLxrP8ws1M/

It's not normal for a president of the United States to make plans with the president of an allied country, that is likely to get tens of thousands of people in that country killed. But we're not talking about ordinary presidents; we're talking about Donald Trump and Jair Bolsonaro.

The goal of the Trump-Bolsonaro plot was to keep Brazil from getting access to a vaccine developed in China. China is apparently somewhat ahead of the United States in developing an effective vaccine. While the pharmaceutical companies in the United States have approached a vaccine by developing a new RNA method, the leading Chinese companies have pursued an old-fashioned dead virus approach.

This allowed these companies to move more quickly with their testing and get to the final Phase 3 stage of clinical trials before the U.S. companies. They also went the route of picking countries with high infection rates, like Brazil, to conduct their trials. A high infection rate makes it easier to determine how effective a vaccine is in preventing infections.

Now that Sinovac, one of the leading Chinese companies, is concluding its trials, it is negotiating large sales of the vaccine to Brazil. Joao Doria, the governor of Sao Paulo, had negotiated a major purchase for the people in his state. Bolsonaro, has sought to nix the deal.

According to a press account, Bolsonaro made this decision after meeting with Trump's national security adviser, Robert O'Brien. Trump apparently would consider it a setback in his contest with China for global stature, if Brazil were to adopt a vaccine developed by a Chinese company.

Brazil ranks second to the United States in total deaths from the pandemic and is seeing close to 400 deaths a day. This means a delay in getting a vaccine of even a month can mean over 10,000 additional deaths. If the delay is longer, as seems likely, the number of needless deaths would increase accordingly.

Bolsonaro's claim is that he doesn't want his country to be "anyone's guinea pig." But this is hardly the issue. Large-scale purchases of the Sinovac vaccine would come only after Brazil's regulatory authority had determined that the vaccine was safe and effective. Bolsonaro's move was purely an effort to satisfy his friend Donald Trump. He apparently has no more respect for the lives of the people in Brazil than Trump does for people in the United States.  

The post Donald Trump and Jair Bolsonaro Plot to Get Brazilians Killedappeared first on Center for Economic and Policy Research.


 -- via my feedly newsfeed

Thursday, October 29, 2020

Michael Roberts: China’s growth challenge [feedly]

It appears Xi Jinping has won comrade Michael over.  A devoted defender of Marx's theory of value, I admit shunning him, perhaps more often than I  should, for what sometimes appears as an intellectual fetish combined with screwball politics. But -- he is a good economist and a good researcher, too.  He does a great job below distinguishing between two methods of defining and calculating GDP -- which boils down to whether China's GDP is 10 or 8% per annum -- in either case orders of magnitude better than any other large or medium economy. The distinctions include what basket of goods to include in what is measured, and what weights to assign to different goods in the basket to be measured: Productive vs not productive, service vs mfg, public vs private, intangible vs tangible, etc.

China's growth challenge

https://thenextrecession.wordpress.com/2020/10/28/chinas-growth-challenge/
 Michael Roberts

This week the 5th plenum of the Chinese Communist Party central committee is taking place.  The plenum is to discuss the progress of the Chinese economy and to decide on real GDP growth and other targets for the new 2021-25 five-year economic plan for China.  The plenum will also discuss a broad plan for the next 15 years, with goals that are likely to endure for at least the rest of 67-year-old President Xi Jinping's rule. This year's meeting comes as the deadline for meeting the previous overarching goal of achieving a "moderately prosperous society", is due to expire in 2021, the centenary of the founding of the Chinese Communist party.

Beijing has hinted it would broaden out its focus on economic growth to include targets for environmental protection, innovation and self-sufficient development — such as in food, energy, and in chips.  This is all part of the strategy of developing a "dual circulation" economy in which China will develop domestic demand and self-sufficiency while the rest of the world remains stalled by coronavirus.

Beijing has set an average annual GDP growth-rate target in every Five-Year Plan since 1986. But this year, as the economy was pummelled by the Covid-19 pandemic, China for the first time did not define a target. The new GDP target is likely to be lowered from the 6.5% a year set in the current plan to 5% or so in the next.

There is much to discuss about China: how it dealt with the COVID-19 pandemic and how quickly it is recovering economically.  Then there is how the 'cold war' between China and the US will pan out and what it means for the world economy.  And perhaps most important of all: will China be able to continue to grow at a fast-enough pace to reduce poverty and raise living standards as it has done so successfully over the last 40 years.  I shall come back to these questions in future posts, but in this post, I want to discuss China's growth, as measured by the mainstream economics measure, gross domestic product (GDP).

The reason for doing that is because the official statistics for China's GDP and its annual growth since the 1949 revolution have been disputed by 'Western' economists and even Chinese ones.  The dispute ranges from just arguing that the Chinese authorities just blatantly lie and make their figures up to a more reasoned view that official calculations are faulty. That China just makes up its figures has been pretty conclusively rejected by those who have studied them closely. "The findings are that the supposed evidence for GDP data falsification is not compelling, that the National Bureau of Statistics has much institutional scope for falsifying GDP data, and that certain manipulations of nominal and real data would be virtually undetectable. Official GDP data, however, exhibit few statistical anomalies and the National Bureau of Statistics thus either makes no significant use of its scope to falsify data, or is aware of statistical data regularities when it falsifies data."

However, there is a large body of analysis that argues that conceptual and statistical frailties in China's statistical work has led to an exaggeration of China's real GDP growth since the 1949 revolution and especially since the 'market reform' period initiated by Deng started after 1978.  The main source of this view comes the US Conference Board, a mine of statistical information on the GDP, GDP per head, productivity and employment for most countries of the world.  The Conference Board has adjusted China's real GDP growth rate going back to the 1950s to produce a much lower rate of growth than the official data.

The CB finds that, while the official data reckon that real GDP growth in China from 1949 to 2019 was 8.5% a year, it was really only 5.9% a year, some 30% slower.  The gap is even greater in the post-Mao period up to 2000, with China's official real GDP growing at 9.7% a year while the CB finds it grew at 6.3% a year or 35% slower.  After that, the gap between the two measures narrows somewhat.  With real GDP per capita growth (taking into account population growth), the gap between the official data and the CB data is even greater.

GDP growth1953-191953-781979-200000-1908-19
Official8.56.79.79.58.5
CB5.94.46.37.36.0
GDP per capita growth
1953-191953-781979-200000-1908-19
Official7.14.58.48.98.0
CB4.52.35.06.85.5

How does the CB reach different results from the official data?  The CB bases its results on the work of Harry Wu from the Institute of Economic Research, Hitotsubashi University, Tokyo.  Wu has worked with the great world growth economist, Angus Maddison and is the adviser to the CB on China's stats.  Wu finds conceptual and technical flaws in the official data which when adjusted produce much lower growth rates in productivity and thus in GDP and GDP per capita.

There are many faults that Wu claims to find in the official data, but there are two that deliver the largest reduction to the official growth rate.  One is conceptual and one is technical.  The first conceptual one is that the Chinese stats exclude any 'non-material services'.  These are financial services, business consultancy, real estate agencies etc – in other words, non-productive services. This was done in China from the beginning so that GDP reflected more the productive sectors of the economy.  Of course, this is anathema to mainstream economics based on GDP conceived by Simon Kuznets to measure the progress of a capitalist economy.  When Wu adds in his own estimates of these sectors to China's GDP, this raises the total value of GDP and leads to a different scale of growth.  It knocks off from China's official growth rate 0.4% pts a year for the Mao period and 0.7% pts a year for the post-Mao period.

The second main adjustment is to the prices of produced goods. Many goods disappear over time and are replaced by new goods with different prices.  So the value of the basket of goods in GDP will change accordingly.  Wu adjusts GDP according to his own calculations for this, which knocks off another 1.7% pts a year in the post-Mao period.  These two adjustments account for most of the difference between the official growth figures and the CB ones.

I think there is much to dispute with Wu's adjustments.  First, the official stats provide a better guide to the strength of the key productive sectors of the economy than the mainstream GDP data.  Second, the Wu commodity price adjustments seem arbitrary and open to dispute.  Wu's adjustments lead not only to significantly different results for GDP growth but also to productivity growth, and to that neoclassical measure of 'innovation', total factor productivity (TFP).

As Wu concludes: "We have confined the present study to the well-known neoclassical growth accounting framework adopted in most of the existing studies, explicitly or implicitly. As stated at the beginning of the paper, the purpose of this study is to discover how and to what extent data problems may affect the estimated TFP growth, rather than building up a new theoretical framework to explain China's TFP performance. For this purpose, I have maintained the same approach and the same theoretical framework. Nevertheless, it is perfectly reasonable to argue that the neoclassical framework used in this study is questionable."

Nevertheless, Wu's adjustments to the official GDP growth rates for China have become widely accepted.  The Penn World Tables, a major database for much world economy analysis, now uses the CB estimates for China's real GDP.  So let us accept for now, the CB adjusted data for Chinese economic growth.  What does it mean in gauging the past success of the Chinese economy and the likely projection for GDP, productivity and investment growth ahead?

The New York Federal Reserve has published just this week a brand, new in-depth analysis of Chinese economics growth using the Penn World Tables (and thus the CB estimates). According to the NY Fed, Chinese real GDP growth has averaged 6.9% since 1978, more than 2 percentage points below the official figure.  The estimated overstatement of growth varies considerably over time, from more than 3 percentage points for much of the 1990s to less than 1 percentage point until recently.  So the Wu adjustment effect is disappearing.

But even if you accept the lower rate of growth, as the NY Fed says "China's growth performance remains remarkable. For our sample of 124 economies, China has come in above the 90th percentile of the global growth distribution more than half the time since 1982, and above the 75th percentile until just last year. China's growth over the past 20 years (7.5 percent) somewhat lags that of the high-income Pacific Rim during the periods in which they rose to China's current per capita income level, but stands in the middle of the pack in per capita terms (6.9 percent)." And what the Fed does not mention is that China is a giant compared to the city states of Singapore and Hong Kong and is also immensely larger in GDP and population than Taiwan, Korea and even Japan. To achieve high annual growth in such a large economy in the last two decades to 2018 is truly historic.

One of the results of this huge growth in per capital income has been a staggering rise in life expectancy.  From life expectancy at birth in 1960 of just 44 years, China's average life expectancy is now 77 years. It is catching up with the US, where there has been a fall since the end of the Great Recession.  And China has outstripped all the other so-called large emerging economies.
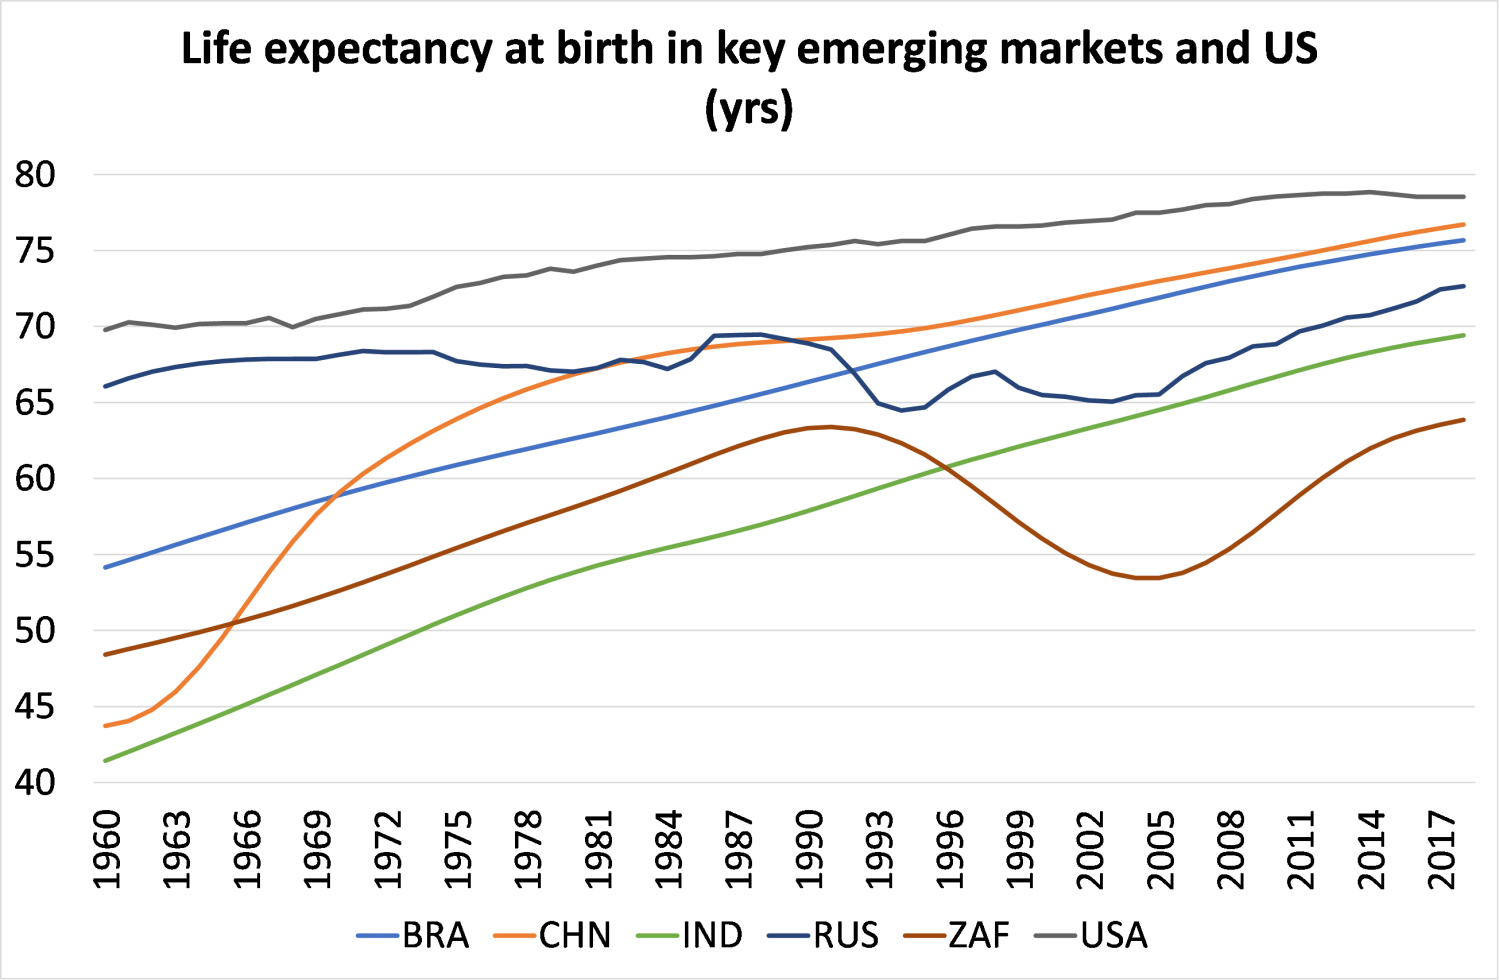
High life expectancy and falling birth rates have meant that China has an ageing population.  Indeed, the working-age (20-64) population began shrinking in 2017.

Up to now, the key to China's economic growth has been the huge expansion of investment in machinery and technique as China moved from the labour-intensive economy of the Mao period to a hi-tech manufacturing export economy now. Of the 8.7% annual real GDP growth in the two decades before 2007, 4.7% pts came from investment (55%) – and over one-third from 'innovation' (TFP).  Labour inputs contributed less than 15%.

The NY Fed admits that if China keeps up this pace of expansion, it "is well on track to high-income status… After all, per capita income growth has averaged 6.2 percent over the last five years, implying a doubling roughly every eleven years, and per capita income is already close to 30 percent of the U.S. level."

But NY Fed economists along with most Western economists reckon that this will not happen. China's growth rate will slow down because it cannot expand capital investment any more than it has and its technical prowess will not rise sufficiently to compensate. Moreover, unless it drops state-led and directed investment and allows 'the market' and 'the consumer' to become king, it cannot achieve high income status and will be locked into the 'middle -income trap' as so many other 'emerging' capitalist economies have.

The NY Fed offers three growth scenarios for the next two decades. The 'humdrum' scenario projects that China will fail badly in reaching the living standards of the mature capitalist economies. Even under its 'pretty good' scenario it will fall short of the success of Japan and other East Asian states. Only the 'golden' scenario will do the trick.

But in the golden scenario, real per capita income growth must average a very rapid 4.9 percent from 2018 to 2028, slowing to a still strong 2.6 percent over 2028-38 (based on CB growth figures). This leaves real incomes up by 111 percent from their level in 2018, a performance comparable to what the Asian Tigers achieved over a similar period. China then achieves high-income status, with real incomes at slightly above 60 percent of the current US level, or exactly 50 percent of the assumed future US level.

The NY Fed reckons China's growth rate will slow because investment growth will slow and productivity enhancement from innovation will not be enough to compensate for falling employment as China ages."There is good reason to doubt that China could sustain rapid TFP growth with such a production mix, especially given already pressing concerns about the efficiency of new investment spending."

The NY Fed reckons that it would be "pretty extraordinary – and historically unprecedented" for Chinese growth rates to be sustained at 5% a year for the next 20 years.  Beijing-based Keynesian economist Michael Pettis echoes the Fed's view: "China's working population is expected to be 7% lower in 15 years than it is today. In that case 4.7% GDP growth requires as great an increase in worker productivity as 5.2% GDP growth for an economy with a steady working population."

But is that growth target really so impossible?  Given that China has achieved 7% annual growth (CB figures) over the last 20 years with labour inputs contributing only 15%, it does not seem impossible that even with a zero contribution from labour (and that won't be the case) and no change in the investment rate, that China could not manage around 5% a year economic growth by achieving a moderate 1-2% a year TFP increase . Much will depend on whether the technology upgrade that China is engaged in can deliver.  And even the NY Fed admits that "China can grow rapidly for a long time before it approaches the technological frontier. There is plenty of upside, just no guarantee that it will be exploited."  Moreover, even if China does not sustain 5% annual growth over the next two decades, it will close the gap with the mature economies because growth rates there will be lucky to get above 1-2% a year (and that's assuming no crises of capitalist production up to 2040!).

The reason that the NY Fed as well as many Keynesian and other critics of the Chinese 'miracle' are so sceptical is that they are seeped in a different economic model for growth.  They are convinced that China can only be 'successful' (like the economies of the G7!) if its economy depends on profitable investment by privately-owned companies in a 'free market' where consumption rules over investment.  And yet the evidence of the last 40 and even 70 years is that a state-led, planning economic model that is China's has been way more successful than its 'market economy' peers such as India, Brazil or Russia.

The NY Fed admits that "China (could) prove a unique case, attaining high-income status while retaining governance features unlike those of all current high-income economies."  However, the "Chinese authorities have been clear about their plans to proceed with market-oriented reforms. But authorities have been equally clear that the Communist Party will retain control over the commanding heights of the economy and over political life. And in this connection, policy is currently moving in the wrong direction, toward greater state and party control of the economy."  According to the critics, this is the 'wrong direction'; but what will the CP plenum conclude?

In future posts, I shall look at the challenges facing the Chinese economy, apart from growth, including: rising debt; climate change and the environment; inequality; the Belt and Road project; and the intensifying 'cold war' with the US.


 -- via my feedly newsfeed

Wednesday, October 28, 2020

an AOC ad -- she gets it.

Facebook’s Tech Chief: How We Built It and Where We’re Going [feedly]

Facebook's Tech Chief: How We Built It and Where We're Going
http://feeds.harvardbusiness.org/~r/harvardbusiness/~3/FB7F681WFv8/facebooks-tech-chief-how-we-built-it-and-where-were-going

I would recommend this as a must listen for socialists. A clearly brilliant engineer, CTO of Facebook, is in charge of teaching (or being taught by) Facebook-scaled AI software how to recognize "hate speech" in 100 languages and among 2.1 billion users. That's just one item in a rich discussion. Another is the potential shift in human experience from enhanced virtual reality platforms that are in advanced research stages. At the end, however, a very big question is left unanswered. Facebook may be considered to be under public pressure due to its dominance for this time -- but it's still an ad-driven private biz for profit, assuming the role of global censor. If there must be global censors, I prefer elected governments to giant corporations.  

 -- via my feedly newsfeed

Black, Hispanic, and young workers have been left behind by policymakers, but will they vote? [feedly]

Black, Hispanic, and young workers have been left behind by policymakers, but will they vote?
https://www.epi.org/blog/black-hispanic-and-young-workers-have-been-left-behind-by-policymakers-but-will-they-vote/

EPI research finds that BlackHispanic, and young workers are among those hit hardest by the COVID-19 recession—facing unemployment rates far beyond what white workers and older workers are facing. The resulting economic challenges—including food insecurity and the threat of eviction, among others—will compound if additional relief doesn't come soon. In addition to economic threats, the health threats of the coronavirus pandemic have affected communities of color far worse than white communities.

Young adults and Black and Hispanic citizens have also been historically underrepresented at the polls, for a variety of reasons that we explore below. But could that change in 2020?

Historical voting trends among the Black, Hispanic, and young adult populations

Black voters have faced a 150-year struggle against voter intimidation and suppression tactics and the multilayered legacies of slavery. Black Americans are also disproportionately disenfranchised by state laws that ban convicted felons from voting—even, in some states, after they have served their full sentence. Given the U.S.'s high incarceration rate and systemic racism in the criminal justice system, this is just one more way the Black vote is suppressed.

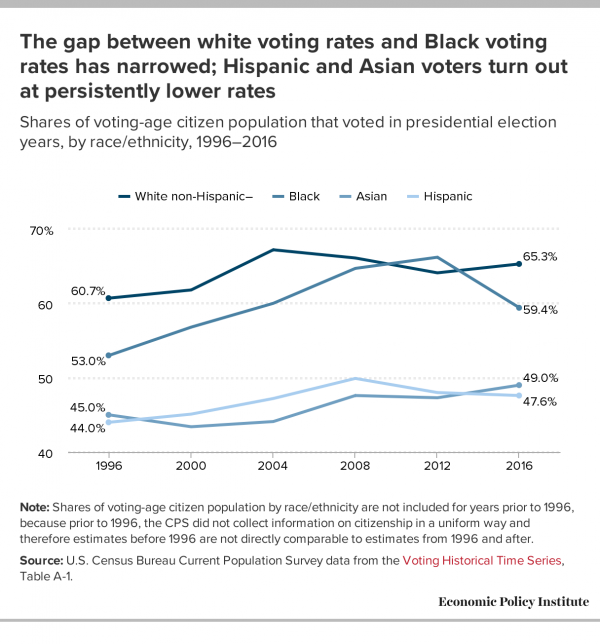
Black voter registration and participation rose after the passage of the Voting Rights Act of 1965; while Black voting rates would continue to lag behind white voting rates, the gap had narrowed significantly—particularly in the South. In 2008, the gap essentially closed, and in 2012, Black voting rates exceeded white voting rates (Figure A). However, Black voting rates dipped below white voting rates in the 2016 presidential election, as reports of voter suppression and intimidationincreased relative to previous elections.

Hispanic voter turnout has been persistently lower than both Black and white voter turnout: In the 2016 presidential election, Hispanic turnout was reported by the Census Bureau at 47.6%, compared with 65.3% for non-Hispanic white voters and 59.4% for Black voters (Figure A). The reasons for low Hispanic turnout are not necessarily easy to determine and often get told one story at a time. Like Black voters, Hispanic voters have been hampered by voter suppression efforts and face disproportionate disenfranchisement due to felony convictions. Many face language barriers. The Hispanic population is also much younger (with a median age of 30 in 2018) than the white population (with a median age of 44)—and, as discussed below, younger adults are less likely to vote.1

Figure A

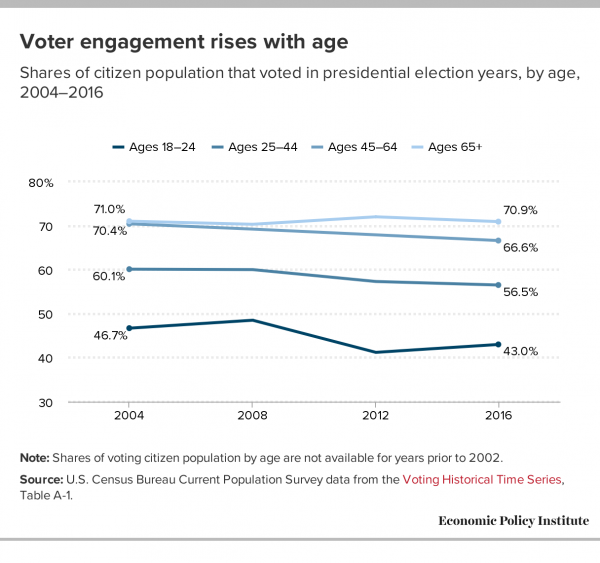
It is well known that voter engagement rises with age (Figure B). Census data show that in the 2016 presidential election, voter turnout among the youngest voters (ages 18–24) was 43.0%, compared with 70.9% for the oldest voters (ages 65 and older). Voting rates for the two cohorts were similar in 2012, at 41.2% and 72.0%, respectively. Young adults face the hurdle of voting for the first time and learning to navigate the voting system in their state. They may also lack confidence that they will be able to make good voting decisions.

Figure B

How might these trends shift in 2020?

A recent Pew Research Center survey found that 63% of Black registered voters are extremely motivated to vote in the 2020 presidential election. Nationwide, Black eligible voters now make up 12.5% of the U.S. electorate, up from 11.5% in 2000. For many years, Black voters were the largest nonwhite racial or ethnic segment of the country's electorate, but for the first time in a presidential election they will be outnumbered by Hispanic eligible voters, at 32 million.

According to FiveThirtyEight, Hispanic voters are the most likely group to vote by mail in 2020. This may be partially due to the fact that almost half the country's Hispanic population live in states that entirely vote by mail or have high rates of mail balloting. Additionally, states with large Hispanic populations like Arizona, California, and Florida have greatly expanded access to voting by mail in recent years.

The 2018 midterms saw a spike in voter turnout among all age cohorts and racial/ethnic groups, but especially among the youngest voters (ages 18–29 in the reported data), whose voting rates rose from 19.9% in 2014 to 35.6% in 2018, and among Hispanic voters, whose rates jumped from 27.0% to 40.4%. Will this trend continue in 2020? We hope so.

The policymakers we elect in 2020 will heavily influence how we as a nation navigate the coronavirus crisis going forward. Those who have been most harmed by current policies have a chance to have their voices heard by the very policymakers who have left them behind during the COVID-19 pandemic.

View EPI's voter resource guide.

EPI research on how workers are faring in the COVID-19 economy

Black workers face two of the most lethal preexisting conditions for coronavirus—racism and economic inequality

Racial and economic inequality have left many black workers with few good options for protecting both their health and economic well-being during the coronavirus pandemic. Persistent racial disparities in health status, access to health care, wealth, employment, wages, housing, income, and poverty all contribute to greater susceptibility to the virus—both economically and physically. While policy responses to the crisis have been broad-reaching, they have nevertheless yielded uneven results because of differential access to resources.

Latinx workers—particularly women—face devastating job losses in the COVID-19 recession

Latinx workers have suffered greater economic distress than their white counterparts since COVID-19 began spreading in the United States. These outcomes have been driven by the fact that Latinx workers already had lower pre-pandemic wages, income, and wealth, as well as less access to health care and other important job-related benefits. As the pandemic has spread, another symptom of this labor market disempowerment—inadequate workplace safety—has loomed particularly large. In the midst of this crisis, some policies that appear to be neutral have disproportionately harmed certain populations.

Young workers face high unemployment and an uncertain future

Young workers have been hardest hit by the COVID-19 economic shock. These workers—defined as ages 16–24—are the most likely to be unemployed or underemployed, least likely to be able to work from home, and more likely to work in industries and occupations with the largest job losses in the coronavirus-driven recession. Absent a much more effective policy response than was undertaken following the Great Recession, today's young workers may experience serious and long-term labor market repercussions.

Note

1. The Black population, too, is relatively young, with a median age of 34; despite this, Black voting rates overall have been relatively high in recent years, as discussed above. Unusually high turnout among young Black voters (ages 16–24) in 2008 and 2012—exceeding young white voter turnout by at least 6 points in each of those elections—may have partially mitigated the usual effects of youth on voting rates. (Data on voter turnout are from U.S. Census Bureau Current Population Survey data from the Voting Historical Time Series, Table A-1.)


 -- via my feedly newsfeed

Saturday, October 24, 2020

Health Insurance Coverage Losses Since 2016 Widespread [feedly]

Health Insurance Coverage Losses Since 2016 Widespread
https://www.cbpp.org/blog/health-insurance-coverage-losses-since-2016-widespread

 -- via my feedly newsfeed

The number and share of Americans without health insurance coverage rose for the third straight year in 2019, recent American Community Survey (ACS) data show, despite three years of strong economic growth and falling unemployment. This follows six straight years of health coverage gains, with the uninsured rate falling from 15.5 percent in 2010 to a historic low of 8.6 percent in 2016 as the Affordable Care Act's (ACA) major coverage expansions took effect. Some 9.2 percent of Americans — 29.6 million people — were uninsured in 2019, compared to 8.9 percent (28.6 million) in 2018.

While uninsured rates remain far below pre-ACA levels, coverage gains have eroded for nearly every demographic group for which the Census Bureau collects health coverage data (see figure). The uninsured rate has risen since 2016 for Americans at all income, age, and education levels, and among all racial/ethnic groups except Asian Americans — with the biggest uninsured rate increases among children, people with income above 400 percent of the federal poverty line, and people with higher education. The number of uninsured has risen the most for people with income between 138 percent and 400 percent of the federal poverty line (by 1.8 million), those aged 45 to 64 (by 761,000), and those with no higher education (by 611,000). (See the tables linked to the figure for the data.)

Trump Administration policies that depressed enrollment in Medicaid and marketplace coverage were likely a major reason why coverage eroded during a period of strong economic growth. As we've explained, these policies included immigration policies that have deterred some immigrants and their family members from enrolling in coverage for which they're eligible, support for state policies that make it harder to enroll or stay enrolled in Medicaid, repeal of the ACA's mandate that individuals get insurance or pay a penalty, and cuts to outreach and enrollment assistance in the ACA marketplaces. As a result of the coverage erosion, the nation entered the COVID-19 pandemic with some 2.3 million more people uninsured than in 2016, including over 700,000 children.

These coverage losses are small, however, compared to those that would come if the Supreme Court strikes down the entire ACA, as the Administration and 18 state attorneys general are urging it to do. That would cause uninsured rates to spike across demographic groups, likely reaching or exceeding pre-ACA levels.

Uninsured Rates Fell Sharply Under ACA But Have Risen Across Groups Since 2016


Uninsured Rate by Income as a Share of the Federal Poverty Level (FPL)

Chart
Table
 
2010
 
2016
 
2019
Below 138%
FPL
138% to 399%
FPL
400% +
FPL
0%
5%
10%
15%
20%
25%
30%

Uninsured Rate by Age

Chart
Table
 
2010
 
2016
 
2019
Total
Under 19
19 to 25
26 to 44
45 to 64
65+
0%
5%
10%
15%
20%
25%
30%

Uninsured Rate by Race/Ethnicity

Chart
Table
 
2010
 
2016
 
2019
Total
White, non-Hispanic
Black
Asian
Hispanic
0%
5%
10%
15%
20%
25%
30%

Uninsured Rate by Education

Chart
Table
 
2010
 
2016
 
2019
Total (26 years old or older)
Less than High School diploma
High School diploma
Some college or Associate's degree
Bachelor's Degree
0%
5%
10%
15%
20%
25%
30%

Note: Figures shown are for the civilian noninstitutional population. The federal poverty line for a single person is $12,760. ACA=Affordable Care Act.

Source: CBPP calculations based on the Census Bureau's American Community Survey data

CENTER ON BUDGET AND POLICY PRIORITIES | CBPP.ORG