Thursday, May 28, 2020

Paul Krugman Is Pretty Upbeat About the Economy [feedly]

I tend to think the risk of depression is greater than PK. But this article is a good discussion challenge for those not convinced. PK has at times been off in his predictions, but not often. And most who argue with him on economic grounds, as with Summers, lose the analytical contest.


Paul Krugman Is Pretty Upbeat About the Economy
https://www.bloomberg.com/opinion/articles/2020-05-27/paul-krugman-is-pretty-upbeat-about-coronavirus-economic-recovery

Paul Krugman is one of the world's most influential and provocative economists. Although Krugman made his professional mark in academia, where his work on trade and economic geography earned him a Nobel prize in 2008, it is his commentary that has brought wider public recognition. Last week, Bloomberg Opinion writer Noah Smith interviewed Krugman online about the state of the U.S economy in the midst of the coronavirus crisis. This is a lightly edited transcript of their conversation.

Noah Smith: This pandemic, and the resulting economic slowdown, don't look much like the Great Recession -- or any recession since high-quality economic data has become available. How should we think about this unprecedented event? Can we model it as a demand shock, like the last downturn? Are there any simple models here to guide us?

Paul Krugman: Is this a demand shock or a supply shock? Yes. And no. The aggregate-demand-aggregate-supply framework doesn't work well for this crisis, because it assumes that the economy can reasonably be represented as producing a single good -- a fine approach most of the time, but not now.

What's happening now is that we've shut down both supply and demand for part of the economy because we think high-contact activities spread the coronavirus. This means we can't just use standard macro models off the shelf.

But it's not all that hard to produce two-sector models that use many of the same strategic simplifications we've used in the past. I've seen really nice work on the question of whether the lockdown in some sectors spills over into recession in other sectors (Veronica Guerrieri et al.), and whether and how it produces financial market spillovers (Ricardo Caballero and Alp Simsek). I'm finding these approaches really helpful as a lens for viewing the data and the policy response.

That is, I don't feel analytically at sea here. Even though this crisis is really different from anything we've seen before, my sense is that we've got a pretty good handle on the economics. In particular, we know enough to understand why conventional responses like stimulus or tax cuts are inappropriate, and why we should be focusing on safety-net issues.

NS: So typical stimulus isn't the goal here, and instead we're merely alleviating human suffering while we wait for the shock to end. But that raises an important question: What are the constraints on government action here? In a normal, demand-based recession, there's little risk of inflation from monetary or fiscal policy because the demand shortage is acting to push prices down. But in this situation, it's not clear which way the shock is going to push prices -- the model of Guerrieri et al., for example, is ambiguous on this point. So should we worry that enormous deficits and Federal Reserve asset purchases might stoke a runaway inflation spiral?

PK: In principle it could indeed go either way. People with intact incomes could be switching to unconstrained goods and services rather than postponing spending, so that aid to the unemployed could be inflationary. But that's not what we seem to be seeing. It looks as if the private sector surplus has risen by enough to accommodate public deficits, with room to spare -- that is, it's deflationary.

One big reason, I suspect, is that Guerrieri et al. -- whose model was almost exactly the way I would have done it, so this isn't a criticism -- don't include a role for investment. The fall in demand isn't just households postponing consumption until they can go to restaurants again; it's also a crash in construction of houses, commercial real estate and so on. Who wants to build an office park in a plague?

NS: That's a good point. But this does raise another question. During the Great Recession, you were -- rightfully, in my view -- a harsh critic of people who used bad macroeconomic models to try to explain that crisis as the result of natural shifts in technology or workers deciding not to work. This time around, how do we know which economists have good models? Leaving out investment can make a model give wrong results, but it's a fixable problem. What sort of theories and ideas should we absolutely shun?

PK: In both the Great Recession and now there are two classes of ideas we can immediately classify as worthless.

First, anyone who is peddling known zombie ideas like the magical efficacy of tax cuts should be dismissed out of hand.

Second, anyone who is just rolling out their usual ideas without making allowance for the special nature of the situation shouldn't be taken seriously. Back in 2008-10 you had people talking about monetary and fiscal policy as if there weren't an issue with the zero lower bound. Now you have people -- as always, a lot on the right but some on the left -- talking as if this were a garden-variety recession, not a shutdown enforced by social distancing.

In other words, it's only worth listening to people making a real effort to grapple with the novelty of this crisis.

Given that, I actually don't think it's too hard to think through a lot of what's happening. Most of the economy still works the same way as usual, which is to say more or less Keynesian in the short run. We can understand a lot of the unusual stuff just by applying usual behavior rules to an unusual situation: people may be unemployed with businesses losing sales to exotic causes, but their spending decisions will probably be like those of job losers in normal times. A lot of what's going on in financial markets reflects the same kinds of balance-sheet spillovers we saw in 2008-9.

The hard part is quantifying cross-cutting stuff. How important are supply-chain disruptions relative to excess capacity in driving inflation? What are we missing about things driving spending? (Investment-free consumer-only models can be a very useful strategic simplification — hey, I did that to think about the liquidity trap — but they may miss a key factor right now).

But the truth is that among economists who are making good-faith efforts to respond to unusual times, as opposed to saying what they always say, I'm actually seeing a lot of common ground. I don't see battling orthodoxies this time around.

NS: That's good to hear. One final question: How long can we expect the economic fallout from this shock to last? The Spanish Flu, which also led to a lot of social distancing, didn't seem to leave a lasting economic scar on the nation. But the modern economy is very different -- more dependent on delicate supply chains, more reliant on webs of debt and credit, more weighted toward services rather than manufacturing and agriculture. How likely is this to turn into a lost decade? And what policy mistakes might we make that prolong the pain?

PK: I've been trying to get a handle on this by looking at recessions over the past 40 years. Until now we've had two kinds: 1979-82-type slumps basically caused by tight money and the 2007-09 type caused by private-sector overreach. The first kind was followed by V-shaped "morning in America" recoveries; the second by sluggish recoveries that took a long time to restore full employment.

My take is that the Covid slump is more like 1979-82 than 2007-09: it wasn't caused by imbalances that will take years to correct. So that would suggest fast recovery once the virus is contained. But some big caveats.

One is that we don't know how long the pandemic will last. Right now, we're probably opening too soon, which will actually extend the period of economic weakness.

Another is that even if we didn't have big imbalances before, the slump may be creating them now. Think of business closures, which will require time to reverse.

And I also wonder how much long-term change we'll experience as a result of the virus. If we have a permanent shift to more telecommuting and less in-person retail, then we'll have to shift workers to new sectors, which will take time. That was an argument lots of people made, wrongly, in 2009, but it could be true now.

All that said, right now I don't see the case for a multiyear depression. People expecting this slump to look like the last one seem to me to be fighting the last war.


 -- via my feedly newsfeed

A Service Industry Where Every Worker Thrives [feedly]

A Service Industry Where Every Worker Thrives
https://www.yesmagazine.org/opinion/2020/05/27/coronavirus-service-industry

COVID-19 has revealed the deep structural inequities of the service sector, and has thus created a tremendous opportunity to organize both workers and employers for the change we've always needed. We can't go back—we can only go forward together and reimagine an industry in which all thrive.

Before the pandemic, there were more than 13 million restaurant workers and nearly 6 million tipped workers across the United States, including restaurant, car wash, nail salon, tech platform delivery, and other workers. The National Restaurant Association had argued since emancipation that, given customer tips, they should be able to pay their tipped employees a subminimum wage, today just $2.13 an hour federally. A legacy of slavery, the subminimum wage for tipped workers today is a gender equity issue; 70% of tipped workers are women, disproportionately women of color, who work in nail and hair salons and casual restaurants such as IHOP and Denny's, live in poverty at three times the rate of the rest of the U.S. workforce, and suffer from the worst sexual harassment of any industry because they are forced to tolerate inappropriate customer behavior to feed their families in tips.

Seven states—California, Oregon, Washington, Alaska, Minnesota, Nevada, and Montana—have rejected this legacy of slavery and pay One Fair Wage, a full minimum wage with tips on top. These states have comparable or higher restaurant sales per capita, job growth among tipped workers and the restaurant industry, and tipping averages than the 43 states with lower wages for tipped workers, and half the rate of sexual harassment in the restaurant industry. One Fair Wage, the organization I lead, has been fighting to ensure that the nation follows the leadership of these seven states.

Workers are being penalized because their employers paid them too little.

The subminimum wage for tipped workers resulted in a horrific experience for millions of tipped workers as a result of the COVID-19 economic shutdown. We estimate that between 4.5 million and 9 million restaurant and other tipped workers have already lost their jobs. Most are ineligible for unemployment insurance; hundreds of tipped workers have reported to us that they are being denied unemployment insurance because their subminimum wage plus tips is so low it does not meet the minimum threshold to obtain unemployment insurance. In other words, these workers are being penalized because their employers paid them too little. Even among those who are eligible, unemployment insurance is being calculated based on the subminimum wage plus, generally, an under-evaluation of their tips. Millions of workers find themselves now unable to pay for rent, food for their children, or other bills.

We launched the One Fair Wage Emergency Fund on Monday, March 16, to provide cash relief to thousands of low-wage service workers; the fund has exceeded 150,000 worker applicants in the past month. We have built an army of almost 1,000 volunteers who are calling each worker to screen them for need, organize them into One Fair Wage, and register them to vote. Our organizers then follow up with potential leaders to organize them into our relational voter program and ultimately, win One Fair Wage.

Our relief fund is drawing in low-wage workers, people of color, single mothers, immigrants, and young people. These workers are anxious to speak with us, not only because they are desperate for funds, but also because they are distraught and frustrated with the fact that they have worked for years in the service industry, only to find themselves completely destitute the day after their restaurants close. Almost all workers are signing up to join One Fair Wage, speak to press, and register to vote.

We aren't stopping with just organizing workers—the extraordinary moment calls for more.

We have raised nearly $23 million to date to hand out relief to thousands of workers; we are also providing individual counseling to workers with regard to their unemployment benefits and finances. More importantly, we are organizing these thousands of workers into large national and state tele-town halls and virtual rallies with Congress members, governors, and other state legislators to allow them to raise their voices and make demands. It is a new and unique moment in organizing. Thousands of workers are attending these virtual events and demanding change with a fervor we've rarely seen. In this new and challenging moment for organizers, the OFW Emergency Relief Fund provides a clear pathway for a different kind of organizing and voter mobilization that will allow us to not only engage hard-to-reach populations civically but also develop their leadership to change the issues that most affect them.

But we aren't stopping with just organizing workers—the extraordinary moment calls for more. The moment has shown that we can simultaneously support workers and ensure that responsible restaurant owners who care about their workers survive the crisis—and reshape the service sector going forward. In fact, several restaurant owners who previously opposed or were hesitant about One Fair Wage are now willing to work with us to commit to One Fair Wage and increased equity next year. For some, their eyes have been opened to the unsustainability of the system; for others, the moment has allowed them to break free from an old business model that they could not see how to change. Some are even working with us to design model restaurants of the future.

Based on these conversations, we have been working with various governors and mayors to launch High Road Kitchens—a program in which restaurants that commit to move to One Fair Wage and greater race and gender equity voluntarily next year receive public and private dollars to rehire their workers and repurpose themselves as community kitchens to provide free meals to those who need them. We are thus providing both relief to struggling independent restaurant owners, free meals to workers and others in need, and most importantly, reshaping the sector toward equity.

The pandemic is both the gravest crisis in the service sector's history in the United States and also the greatest moment for transformation—for building power among workers and change among employers toward a sustainable future of collective prosperity.

The post A Service Industry Where Every Worker Thrives appeared first on Yes! Magazine.


 -- via my feedly newsfeed

U.S. income inequality is worse and rising faster than policymakers probably realize [feedly]

U.S. income inequality is worse and rising faster than policymakers probably realize
https://equitablegrowth.org/u-s-income-inequality-is-worse-and-rising-faster-than-policymakers-probably-realize/

Overview

The use of U.S. administrative income tax data for research purposes over the past two decades has led to an ongoing debate about levels and trends in U.S. income inequality. The debate around income measurement is important because how economists and policymakers alike measure income shapes how income inequality is perceived by the broader American public and thus could drive public policy decisions in more equitable directions.90

Download File
U.S. income inequality is worse and rising faster than policymakers probably realize

This debate about U.S. income inequality has swung back and forth. Some early academic uses of administrative income tax data showed dramatically higher and rising income concentration than previously thought.91 Yet some more recent efforts show less income inequality with no upward trend.92 The debate today centers on what types of income are being counted in the inequality measures and what sorts of data are used to measure each type of income.

There is a well-established middle ground in the income inequality debate, based on a regular series of reports from the Congressional Budget Office.93 The nonpartisan CBO measures household incomes in what most observers believe to be a conceptually comprehensive way. It also combines the best available data for every type of household income, merging surveys and administrative tax records. The result is believed by many to be the most accurate picture of U.S. income inequality available.

Even the CBO measures, however, are missing two important drivers of income inequality. The first is the CBO estimates the measurement of noncorporate business income. The second is the CBO counts only the portion of capital gains that is realized and taxable in the current year by any tax filer, instead of a more comprehensive measure of all capital gains associated with income-producing assets earned in the current year.

These two missing drivers of income inequality—uncaptured noncorporate business income and the gap between realized and unrealized capital gains income—means that income inequality is worse and rising faster than policymakers probably realize.

In our research, we use another household dataset, the Survey of Consumer Finances, or SCF, that makes it possible to address those two shortcomings and create a more comprehensive view of income inequality.94 This survey is conducted by the Federal Reserve Board every 3 years and was most recently completed in 2016, measuring incomes of respondents in 2015. The SCF has better measures of noncorporate business income, and SCF wealth measures make it possible to allocate all capital gains across households using values for SCF income-producing assets such as stocks, bonds, mutual funds, and closely held businesses.

This issue brief examines these two missing drivers of U.S. income inequality and concludes by showing that proper accounting for noncorporate business income and unrealized capital gains helps us understand the connection between high and rising U.S. income inequality and the dynamics of income and wealth inequality in the United States.

Noncorporate business income reporting

The first issue we address is noncorporate business income reporting. Most analysis of income inequality—including by the Congressional Budget Office—starts from the measure of noncorporate business income reported on income tax returns. The measure of noncorporate business income on tax returns is only about half of the noncorporate business income estimated in the National Income and Product Accounts, or NIPA, which is the benchmark for all components of U.S. national income.95

The gap between taxable business income and NIPA business income is, to some extent, a mystery. One source of difference is simple noncompliance by noncorporate business taxpayers, meaning deliberate misreporting to the IRS. But there are other possible sources of divergence between taxable and NIPA business incomes as well. NIPA statisticians estimate noncorporate business income as one component of overall national income, and any conceptual differences between NIPA economic concepts and the methods used to compute business sales and costs for tax purposes will lead to differences in estimated incomes. The decision about whether and how to account for the missing noncorporate business income is one of the key factorsunderlying differences in estimated U.S. income inequality.96

The Survey of Consumer Finances measures business income by simply asking respondents what their businesses earned. The total of SCF noncorporate business income is well above the tax-based income aggregate captured by the Congressional Budget Office and correspondingly, the SCF is much closer to NIPA for noncorporate business incomes. (See Figure 1.)

Figure 1

Although the data sources and methods differ, Figure 1 shows that all other SCF income components are relatively close to CBO values, after imputing unmeasured income components such as employee benefits and Medicare onto the SCF using CBO's methods. The net effect is that total household income in the Survey of Consumer Finances is slightly higher than total household income as reported by the Congressional Budget Office, and that gap is mostly attributable to noncorporate business income.

Why does the Survey of Consumer Finances find more business income than tax returns do? Some academic research views the higher levels of business income in the SCF as indicating there must be a problem with the survey.97 There is certainly scope for respondent confusion about different types of capital income, and indeed, SCF-reported nonbusiness capital income such as interest, dividends, and realized capital gains is slightly below the CBO values. On net, the extra noncorporate business income dominates, however, and overall income is noticeably higher in the SCF than reported by CBO in all years. (See Figure 2.)

Figure 2

The most likely explanation for higher business incomes in the Survey of Consumer Finances is that respondents are reporting something closer to what they truly earned in business income, and that survey-reported concept is above the values they (or their accountants) reported on their tax returns. In any case, it is difficult to imagine why SCF respondents would overreport their business incomes, especially given the accuracy of reporting for other income components. So, correcting income inequality estimates for underreported noncorporate business incomes is the first important adjustment made possible by switching from tax data to the SCF.

Capital gains income reporting

The second important adjustment made possible by using the Survey of Consumer Finances is switching from realized to total capital gains. Realized capital gains are the incomes reported for tax purposes when tax filers are required to report profitable asset sales on their tax returns. Total capital gains capture all increases in asset values, regardless of whether tax reporting is triggered. The concept of Haig-Simons income—which includes all capital gains, realized or not—is well established as the key benchmark in analysis of economic welfare. If the value of an income-producing asset goes up—meaning the owner could sell it at a higher price—then the owner has truly earned something by owning the asset, whether they sell the asset or not.

A few recent studies show the importance of capital gains in overall savings and wealth accumulation. One study shows that capital gains account for 8 percent of national income, on average, since 1980.98Another recent paper shows that capital gains account for about 75 percent of wealth accumulation since 1995.99 Since most gains are not realized for tax purposes when they occur, we are missing a substantial part of true economic income in the tax data.

Take a look again at Figure 2. The third (purple) line shows our estimate of Haig-Simons income, which is, on average, about 6 percent higher than the SCF income measure. How do we construct Haig-Simons income? Aggregate capital gains for each type of income-generating asset in each 3-year period between SCF surveys are computed using the Financial Accounts of the United States.100 We then compute a gains ratio—aggregate gains divided by the aggregate holdings of the respective assets in the SCF—and apply that gains ratio to household assets. Each SCF household then receives the average capital gains of the 3 years prior to the survey, and that replaces their reported realized capital gains.

The consequences of missing noncorporate business income and unrealized capital gains

So, how does accounting for missing noncorporate business income and unrealized capital gains affect estimated U.S. income inequality? The answer is unambiguous because both the missing business income and unrealized capital gains are concentrated at the top of the income distribution. Income inequality is worse than policymakers probably realize. Also, because business income and capital gains are both increasing relative to other income components, income inequality is rising at a faster pace than previously understood.

There are different ways to show how accounting for the missing noncorporate business income and unrealized capital gains affects income distribution in the United States, but the simplest way is to just compare income of households in the middle of the income distribution with incomes of households near the top. (See Figure 3.)

Figure 3

When we compare incomes for the median household, the CBO and SCF measurements look similar. The ratio of median SCF to median CBO income and the ratio of median Haig-Simons to median CBO income consistently hover around 1. Why? The median family is just as well-off using any of the three measures, because the additional business income in the SCF and unrealized capital gains do not accrue in any substantial way to the median household.

In contrast, the story is different at the top of the income distribution. Just switching from CBO to SCF source data, which takes account of the higher business incomes, raises the 99th percentile of the income distribution by about 10 percent in 1988, and the gap (although volatile) is more than 30 percent by 2015. Replacing realized capital gains with unrealized capital gains to move to Haig-Simons income pushes the 99th percentile to 40 percent above the CBO value in 1988, and (although even more volatile) that gap increases to 70 percent by 2015.

The upshot of the more comprehensive measures is that whatever your prior beliefs about the ratio of 99th percentile to median income—the P99-to-P50 ratio—you were probably too low. In the CBO reports, the P99-to-P50 ratio is 6.2 in 1988, rising to 8.3 by 2015. Figure 3 suggests the more appropriate P99-to-P50 ratio, using the Haig-Simons measure, is 9.3 in 1988, rising to 14.9 in 2015.

The capital gains adjustment we apply to the Survey of Consumer Finances comes with a caveat, but it is likely biasing our top income values down, not up. The estimates here assume that the ratio of capital gains to asset value are the same for every owner of a given asset, because we compute and apply one ratio per asset type and time period. In practice, if wealthier owners earn higher gains relative to asset values, then the ratios should increase with wealth, making income even more unequal.

Conclusion

We are not the first to focus on the role of missing noncorporate business incomes in overall U.S. income inequality.101 But we are the first to use the Survey of Consumer Finances in a head-to-head comparison against tax data to pinpoint where in the income distribution that missing income can be found—rather than assume, for example, that it is simply underreported income of otherwise low-income families or proportional to reported taxable income. Also, othershave estimated Haig-Simons income distributions, but come to very different conclusions about the impact of levels and trends on inequality.102

Our answer differs because we use the actual joint distribution of income and wealth, then recompute the income distribution with the more comprehensive income measure. Our results push the pendulum in the ongoing U.S. income inequality debate back toward the "high and rising" conclusion.

More importantly, proper accounting for noncorporate business income and unrealized capital gains helps us understand the connection between income and wealth dynamics. It is difficult to explain high and rising U.S. wealth concentration with available income measures because the very wealthy would have to be saving at an unbelievably high rate to accumulate that much wealth. Acknowledging that there is a lot more unmeasured income at the top of the distribution makes that puzzle less challenging.

—John Sabelhaus is a visiting scholar at the Washington Center for Equitable Growth, where he has been since 2019. Prior to that, he was assistant director in the Division of Research and Statistics at the Board of Governors of the Federal Reserve System. Somin Park is the research assistant to the president and CEO at the Washington Center Equitable Growth and will be a student at Harvard Law School starting in the fall of 2020.

The post U.S. income inequality is worse and rising faster than policymakers probably realize appeared first on Equitable Growth.


 -- via my feedly newsfeed

Unboxing scheduling practices for U.S. warehouse workers [feedly]

Unboxing scheduling practices for U.S. warehouse workers
https://equitablegrowth.org/research-paper/unboxing-scheduling-practices-for-u-s-warehouse-workers/

Workers in the United States struggle with low-quality work schedules.1 The Fair Labor Standards Act is the main piece of labor legislation regulating work hours. The law, passed in 1938, protects workers from overwork by establishing a system of overtime compensation. Over the past 80 years, however, the nature of work scheduling problems has changed. Large numbers of workers in the United States face work schedules that are unpredictable and unstable. Many have difficulty amassing a sufficient number of work hours to pay the bills.

A growing body of research on "just-in-time" scheduling in the retail and service sector illustrates the consequences that bad work schedules have for people's lives. But to advocate effectively for improvements in scheduling quality for all workers, more information is needed about contemporary scheduling problems across a wider range of industries.

This past February, the Washington Center for Equitable Growth hosted a convening of 26 researchers, advocates, and workers to discuss scheduling practices in the warehouse sector. By sharing research, ideas, and lived experiences, participants described an industry where workers often experience the volatilities and uncertainties inherent in the business, such as irregular spikes in supply or consumer demand, through problematic scheduling practices. As convening participant Beth Gutelius—an expert on the logistics industry, an associate director of the Center for Urban Economic Development at the University of Illinois at Chicago, and senior researcher at the Great Cities Institute—described, the nation's supply and demand are reconciled on the warehouse floor, and workers often bear the risk of that reconciliation.

The goal of the February convening was to identify new avenues for research on schedule quality in the warehouse sector. Discussions at the convening informed the findings presented in this report. The first section presents a brief overview of scheduling quality based on research primarily conducted in the retail and service sector. To begin applying this learning to the warehouse industry, the next section discusses the role of the sector in supply chains and resulting market pressures. The third section considers how the pressures and peculiarities of the warehouse sector's position in that supply chain may be affecting job quality and scheduling practices. We conclude by describing the path of research and interventions necessary to advance our understanding of scheduling in the warehouse sector.

Taken together, these sections point to and support several key principles for scheduling researchers examining the U.S. warehouse sector:

  • Research in the retail and service sector has been foundational to our understanding of scheduling practices and quality, but it may not be generalizable to warehouses.
  • Researchers and advocates interested in warehouse scheduling must be cognizant of the broader context of the warehouse industry, such as variations in supply chains, outsourcing, and the use of new technology.
  • Warehouse workers face serious challenges to their health and well-being due to unsafe working conditions and an overly taxing pace of work. These job-quality issues are intertwined with scheduling issues and should be studied in tandem.
  • Replicating the developmental pathway of scheduling research in the retail and service sector will inform the field's understanding of warehouse scheduling and aid policymakers interested designing appropriate interventions.

Our February convening points the way toward expanding the knowledge base around scheduling in warehouses to help inform policymakers and firms seeking to improve productivity, safety, and well-being at this critical link in the U.S. economy's supply chains.

PROBLEMATIC SCHEDULING PRACTICES ARE WIDESPREAD, AFFECTING JOB QUALITY AND PRODUCTIVITY

Problematic scheduling practices are widespread, affecting job quality and productivity

Research in the U.S. retail and service sector provides valuable insight into the causes, prevalence, and effects of problematic scheduling practices. To optimize labor costs, managers try to ensure that there are neither too many nor too few employees working to meet their customers' needs at any point in time. Many employees, therefore, find that their schedules are highly responsive to the perceived ebbs and flows of consumer demand, as well as decisions made further up the supply chain, such as the timing of product shipments. Their schedules are thus irregular and unpredictable.2

Employers have used new developments in technology to implement what are often called just-in-time schedules. Scheduling software now commonly used in the retail and service industry relies on algorithms that take into account product shipments, customer traffic, and even weather when setting and modifying schedules. Managers using these technologies are found to be overly sensitive to perceived changes in demand.3 This means that individual workers' schedules fluctuate even more than the consumer demand to which they aim to respond.

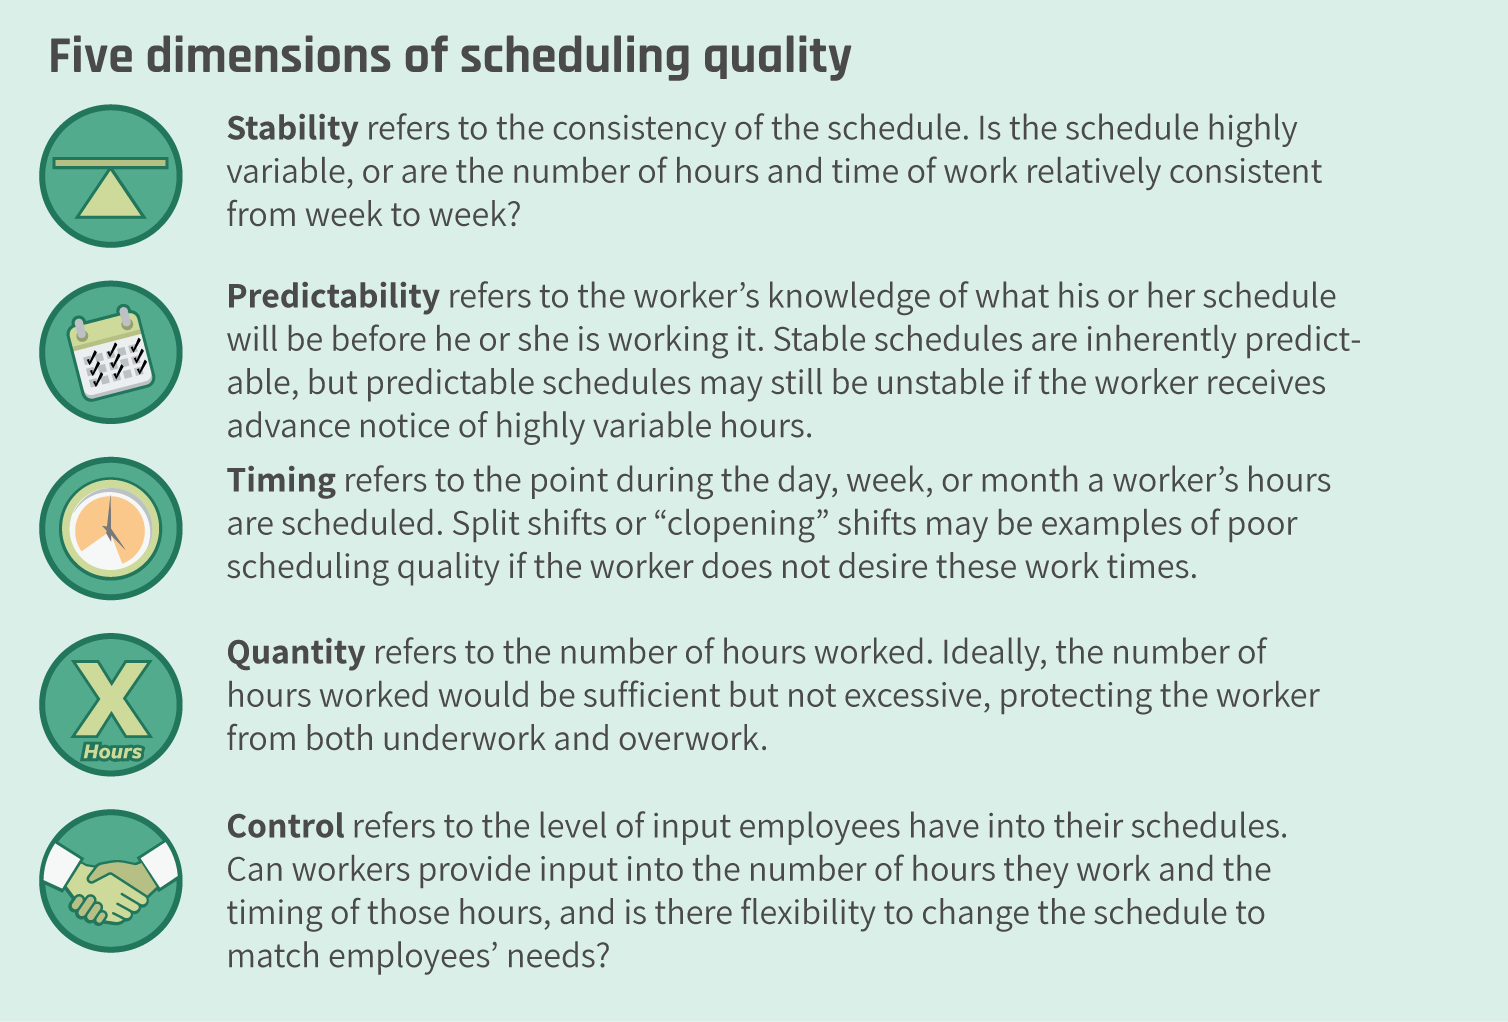
More researchers are turning their attention to scheduling as a component of work quality. As part of this emerging scholarship, scheduling expert and convening participant Susan Lambert, a professor in the School of Social Service Administration and director of the Employment Instability, Family Well-Being, and Social Policy Network at the University of Chicago, and her colleagues articulate five dimensions of scheduling quality that affect workers' well-being:

  • Stability
  • Predictability
  • Timing
  • Quantity
  • Control4

To assess the quality of a schedule, one must look across all five dimensions. (See text box).

A highly predictable schedule, for example, may be low quality if it includes many "clopening" shifts, where employees are assigned consecutive closing and opening shifts with minimal rest time in between. In contrast, a schedule that has nonstandard hours, such as overnight shifts, may be high quality if a worker exerts control and chooses that schedule because it fits his or her needs and preferences.

Unfortunately, many retail and service workers report schedules that cannot be considered high quality when looking across these dimensions. Approximately 70 percent of workers employed by large firms in this sector report last-minute shift changes; a majority have experience with clopening shifts; and a quarter report experience with "on-call" shifts, where an employee must be available for work but may not actually be called in to work.5 In addition to these undesirable hours and shift changes, employees often get very short notice of their work schedules, with two-thirds of workers in these firms reporting that they receive less than 2 weeks' notice of their upcoming schedules.

By justifying just-in-time scheduling as a cost-control mechanism, firms may be overlooking the unintended human capital and business costs of these practices. Research by convening participant Kristen Harknett at the University of California, San Francisco and her co-author, Daniel Schneider at UC Berkeley, find that poor scheduling quality is associated with income volatility, household economic instability, and other measures of well-being, including psychosocial distress, issues with sleep quality, and general unhappiness.6 Low wages also are associated with these outcomes, but unstable and unpredictable schedules are more strongly associated.

Tired and unhappy workers are unlikely to be performing at their full potential. When the clothing retailer Gap Inc. implemented an intervention designed to improve scheduling practices as part of a randomized control pilot study, workers slept better and were more productive at work.7 This productivity led to a 7 percent increase in profitability at the study's treatment stores, suggesting both employees and employers could benefit from higher-quality schedules.

Research documenting the impact of scheduling quality on retail and service workers has led some firms to rethink their irregular scheduling practices and informed statewide and citywide ordinances advancing "fair workweek" legislation.8 There is, conversely, a relative dearth of research documenting scheduling practices in the warehouse sector. So far, only Chicago's scheduling ordinance covers workers in warehouses, but the sector is included in the federal Schedules that Work Act and a comparable bill and campaign in New Jersey.9

As more fair-workweek advocates turn to the warehouse sector, there is greater need for research on scheduling practices in the industry and their effects on job quality.

WAREHOUSE WORKERS' POSITION IN THE SUPPLY CHAIN IS LIKELY TO AFFECT SCHEDULE QUALITY

Warehouse workers' position in the supply chain is likely to affect schedule quality

Recognizing the factors that contribute to scheduling practices in warehouses requires an understanding of the unique role the industry has in connecting products to consumers. In the most basic terms, a supply chain involves:

  • Suppliers producing or procuring raw materials
  • Manufacturers sourcing these materials from suppliers and then turning these materials into finished products for sale
  • Distributors or retailers connecting products to consumers

The link between each one of these points is the warehouse sector, which stores, sorts, and prepares materials and goods for transport as they move along a vast array of different supply chains.

All actors in supply chains have their own costs and risks associated with their role, but they also add to the value of the final products along the way. Producers of raw materials such as lumber, for example, may need to expend resources to mitigate the higher risk to worker safety, but the materials they provide are invaluable to manufacturers. Some of the costs and risks with which warehouse managers must contend include supply chain volatility, such as bouts of excess supply or excess demand, as well as other exogenous economic risks such as tariffs, trade wars, and public health crises.10

Warehouses are often thought of as a stopping point in supply chains that adds little economic value to goods. A product's value may increase during the manufacturing process or in a retail store when it is surrounded by attractive displays, a comfortable shopping environment, and knowledgeable sales staff. But a product rarely becomes more valuable sitting on a warehouse shelf awaiting shipment. This perception that warehouses add little value to a product influences how other suppliers, manufacturers, and distributors in supply chains interact with the warehouse sector and demand from it.

In an increasingly competitive market, warehouses face pressure to reduce costs, increase output, and shorten delivery time. A recent report by Beth Gutelius and her colleague at the University of Illinois at Chicago Nik Theodore, called "The Future of Warehouse Work: Technological Change in the U.S. Logistics Industry," provides a detailed review of how warehouses are adapting to evolving industry demands.11

Over the years, the warehouse industry has responded to these dynamic risks and pressures by adopting new technologies and staffing structures. Advancements in analytics and automation are now used to increase profits by shortening the time that goods sit on shelves and to create popular fast-shipping windows that are now a selling point and staple in e-commerce.12 While the use of automation has drawn significant public interest, it is only part of the story.13

Firms also deploy staffing practices designed to increase flexibility for management, such as the use of part-time workers, freelance workers, and irregular work hours.14 Some warehouses are following their retail counterparts in turning to algorithmic just-in-time scheduling software programs that promise to control labor expenses as a means of achieving greater profitability.15 Some researchers and advocates suspect that problematic scheduling practices could lead to similar insecurities for warehouse workers as those experienced by retail and service employees, but there needs to be more research on the effect of these practices on warehouse workers specifically.

In addition to just-in-time scheduling software, the warehouse sector has adopted other means of controlling labor costs that intersect with scheduling quality. Domestic outsourcing, where companies contract out specific roles in the production process so that workers are not directly employed by the firms for which they are working, is a growing trend across the U.S. workforce, and the warehouse sector is no different.16 Since the 1980s, more firms have opted to contract with third-party logistics companies to manage their warehouses.17 In 2019, more than half of spending on logistics overall was outsourced to these firms.18

One service that third-party logistics companies provide is the management of the warehouse workforce. Mirroring broader trends in the industry, many of these firms have turned to temp agencies to help provide their just-in-time labor needs.19 According to the U.S. Bureau of Labor Statistics, occupations within the warehouse sector have some of the highest composition of temporary workers of any industry.20 Research suggests this type of workplace fissuring is associated with lower wages and worsening job quality.21 More research is needed to understand how outsourcing and the use of temporary workers impacts scheduling practices specifically.22

The warehouse sector is not unique in the pressures it faces to minimize costs. Yet the industry's role as an intermediary between other actors in the supply chain may manifest in workers' schedules in ways that are unique to the sector, including increased demand for faster shipping times and the potential for the industry to place low value on human capital because individual workers are seen to add little to the product's overall value. Scheduling researchers can help shed light on these manifestations and point policymakers and advocates to appropriate interventions.

SCHEDULING PRACTICES IN THE WAREHOUSE SECTOR INTERSECT WITH OTHER JOB-QUALITY ISSUES

Scheduling practices in the warehouse sector intersect with other job-quality issues

Low-quality schedules do not exist in isolation—this job-quality issue intersects with other safety and quality-of-work concerns in the warehouse sector. One example of this intersection is the amount of hours demanded of warehouse workers, which is frequently higher than that of retail and service employees.23 Standard shift length can be long: Amazon.com Inc., an industry leader, assigns 10-hour shifts. While retail workers struggle to amass full-time hours, warehouse workers are often assigned mandatory overtime. Even 40 hours of this physically demanding work can tax workers' health. When hours push past the 40-hour mark, some describe their schedules as "brutal" even as they appreciate the extra bump in their paychecks.

What's more, mandatory overtime around periods of high consumer demand can keep workers on the job up to 60 hours a week.24 Because the overtime is mandated, workers cannot revert to full-time schedules without the risk of termination. In the parlance of scheduling-quality research, warehouse schedules are high in quantity of hours but low in levels of employee control.

Feelings of fatigue or even exhaustion stemming from overwork are not just quality-of-life issues. Tired workers also may be more prone to on-the-job accidents or other severe health incidences that stem from high-intensity, high-pressure jobs. Statistics from the U.S. Occupational Health and Safety Administration show that this sector has a nonfatal occupational injury rate nearly twice the private-industry average (4.5 percent, compared to 2.8 percent).25 Investigative reporting suggests that specific warehouses and facilities may have even higher rates of serious injury, approaching 10 percent.26

Of course, not all injuries can be attributed to overwork. It is probable, however, that the poor scheduling practices described by researchers and advocates are contributing to an environment where workers are forced to prioritize wages over well-being.

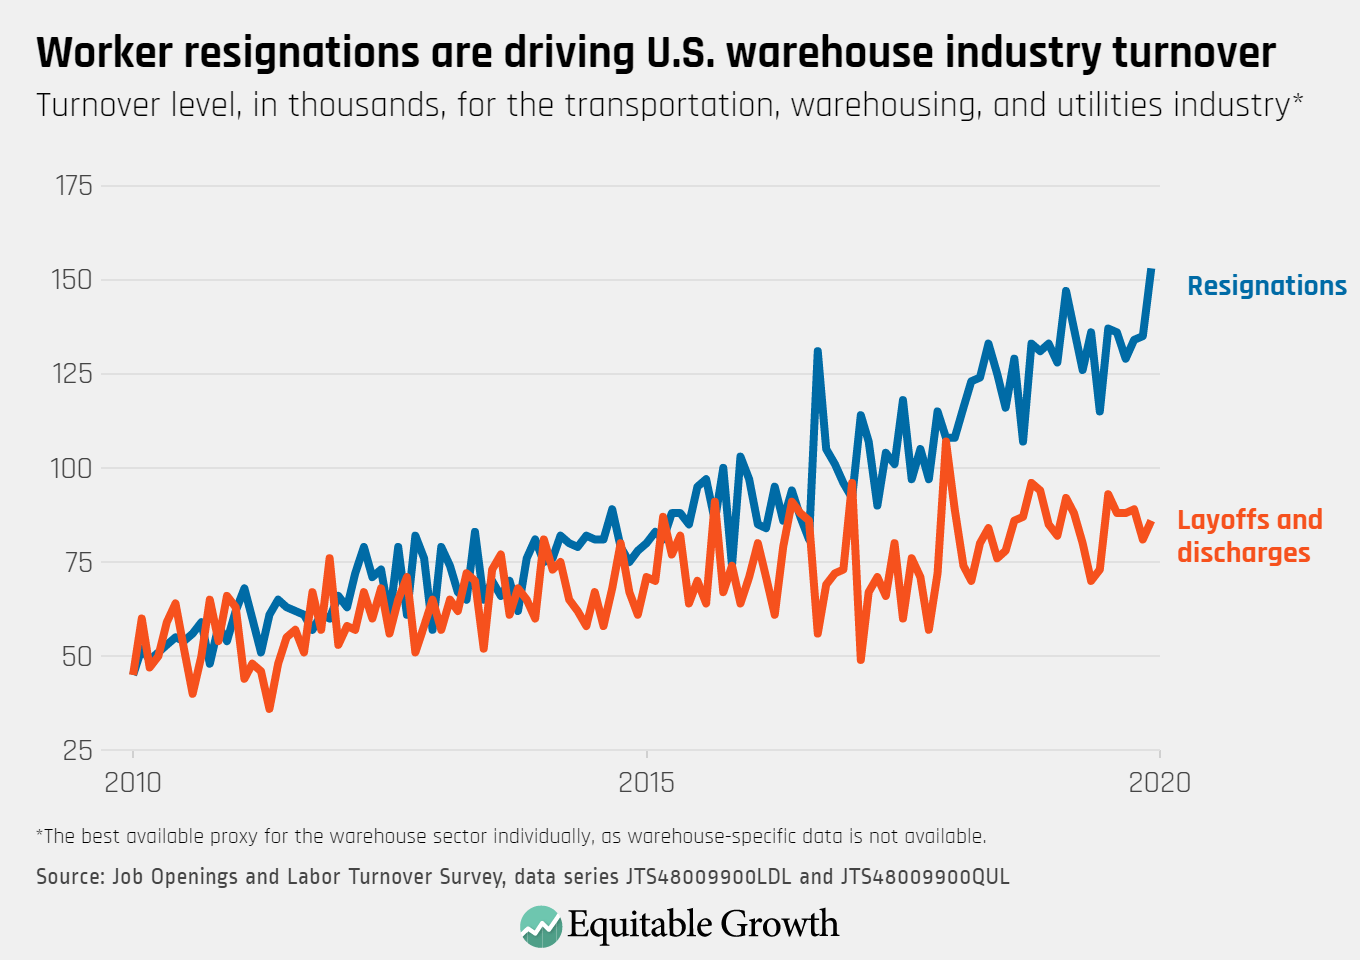
Workers unable to take on the long hours or the grueling pace of work27 may find themselves pushed out of their jobs, if not directly fired. If workers are being assigned schedules that are unsustainable or incompatible with their home lives, then it may drive them to quit, potentially without the safety net of Unemployment Insurance or a new job lined up. Over the past decade, the Bureau of Labor Statistics' Job Openings and Labor Turnover Survey shows a steady increase in the level and rate of workers quitting their positions in the transportation, warehousing, and utilities industry while turnover due to layoffs or firings has increased more slowly.28 (See Figure 1.)

Figure 1

The role that scheduling plays in this turnover is not clear. On the one hand, workers across industries quit more often when there is confidence in the labor market, as has been the case in recent years.29 On the other hand, research in the retail and service sector identifies a significant association between unpredictable schedules and employee turnover.30 This has the potential to cause a vicious cycle in which poor-quality schedules drive some workers out of the industry, worsening the schedules for those left behind who must take on the additional work.

More research is needed to disentangle the relationship between scheduling quality and turnover in this industry. If scheduling is driving this increase in workers quitting, then it would imply that low-quality schedules have likewise increased in the sector over the past decades, which research has yet to identify.

Poor-quality schedules first and foremost impact workers, but they also are likely to have unintended consequences for businesses through increases in labor costs. The turnover discussed above results in significant costs for firms.31 Mandatory overtime might help firms meet consumer demand, but U.S. labor laws appropriately require time-and-a-half compensation for this work, making this business practice costly.32 Because warehouse work is physically taxing, worker productivity is likely to decline as consecutive hours of work increase. Thus, firms that rely on poor-quality schedules to cut costs could actually be paying more money for less productive workers—and exhausting their staff in the process. More research is needed to explore these links.

EXPANDING THE KNOWLEDGE BASE ON WAREHOUSE SCHEDULING WILL SUPPORT FIRMS AND POLICYMAKERS DESIGNING APPROPRIATE INTERVENTIONS

Expanding the knowledge base on warehouse scheduling will support firms and policymakers designing appropriate interventions

The field of scheduling research in the retail and service sector developed from a chain of four distinct yet related "types" of research could be replicated for the warehouse sector. They are:

  • Type one, consisting of descriptive research documenting scheduling practices
  • Type two, involving causal research to identify the consequences of these documented scheduling practices for workers and business
  • Type three, involving the conceptualization and documentation of interventions to improve scheduling
  • Type four, consisting of evaluations of these interventions

The relationship of these types is logical and not inherently temporal; it is not necessary that the research be conducted in the order described.

Taken together, research across these four types will expand the knowledge base on scheduling in warehouses and will inform advocates, policymakers, and firms seeking to improve scheduling practices. Let's look at each one in turn.

Descriptive research

Reporting, testimony, and preliminary research suggest that scheduling in warehouses has issues across the five domains of scheduling quality: stability, predictability, timing, quantity, and control. Fundamentally, there remains a need for descriptive research on scheduling practices across the industry in these five scheduling categories. As researchers begin to unpack the scheduling realities of the warehouse sector, it is also an opportunity to assess whether the measures of scheduling quality (the five domains outlined above) are still applicable to warehouse workers or if new measures are needed.

Therefore, descriptive research must document scheduling practices as they unfold in the warehouse sector. Building upon the work of leading scholars in the field, researchers can structure their research questions around the five domains of scheduling quality identified above. Such research questions may include:

  • How do shifts vary for warehouse works? (stability)
  • How far in advance do workers receive their schedules, and are last-minute changes common? (predictability)
  • How common are nonstandard hours, such as overnight work, in the warehouse sector? (timing)
  • How many work hours are typical per shift/day/week? (quantity)
  • Are workers able to request shifts or modify their schedules to meet their needs? (control)

Of course, the warehouse industry is complex, so any descriptive research should look for heterogeneity-based factors, such as worker demographics, company type, job type, and other factors.

DESCRIPTIVE RESEARCH

What are the scheduling issues faced by workers in the warehouse sector?

Scheduling practices in the retail and service industry are well-documented, but what are the experiences of those in warehouses? How do warehouse workers fare in the five dimensions of quality scheduling: stability, predictability, timing, quantity, and control? Are there other unidentified domains unique to warehouses, in addition to the five identified above?

Causal research

Researchers also should engage in research on the causal implications of these scheduling practices and other business decisions by warehouse firms. While it remains challenging to identify watertight identification strategies in the scheduling context, a variety of research strategies have been used to move past description to shed light on the consequences of scheduling practices. This research attempts to shed light on causal linkages using randomized controlled trials and quasi-experimental methods.

There are probably some unique aspects of the warehouse sector that affect scheduling practices, such as the prevalence of third-party logistics companies described above or the role of automation and artificial intelligence. Causal research could test whether variations in the structure of a warehousing workplace impact the type or frequency of low-quality schedules. Conceptually, this would involve models with a measure of scheduling quality as the dependent variable and workplace factors serving as the independent variables.

The second track of causal research should focus on the effects of scheduling practices on workers. Investigative journalists and worker advocates are starting to share stories of workers in warehouses and the conditions under which they work.33 Scheduling practices factor into these stories about worker safety and the quality of work, but researchers can play an important role in disentangling the effect of scheduling quality specifically. Causal research could unpack how the documented scheduling practices uncovered in descriptive research are affecting worker's well-being on and off the warehouse floor.

The data necessary to conduct this kind of combined descriptive and causal research may be obtained from a variety of sources. In studying similar research questions in the retail and service sector, researchers could collect original data through worker/manager surveys obtained through social media recruitment or daily text messages, time diaries, focus groups, and interviews. Researchers also might be able to negotiate data-sharing agreements with individual warehouse and logistics firms, although accessing sufficient data to make cross-company comparisons may be onerous.

Then, there are third-party payroll firms. They may be able to provide a wealth of scheduling information across firms if sufficient data-sharing agreements can be negotiated. Among the leaders in the industry and their payroll services platforms are Automated Data Processing Inc.'s ADP Workforce Now, Kronos Inc.'s Kronos Workforce Ready, and OnPay Inc.'s eponymous payroll service.

Secondary data analysis using national surveys, despite some measurement concerns, also can help researchers study volatile work schedules if thoughtfully employed.34 While multiple surveys contain questions that can provide insight into respondents' work schedules, identifying respondents working in the warehouse sector specifically and ensuring a sufficient sample size is one barrier to using nationally representative surveys.

Several key surveys, among them the National Longitudinal Survey of Youth 1997, the General Social Survey, and the Survey of Household Economics and Decisionmaking offer information on several aspects of scheduling quality, including measures of scheduling quantity, fluctuation, nonstandard work timing, predictability, and employee schedule control.35 These surveys ask respondents to identify the industry in which they are employed, which can shed light on the type of work performed by respondents with unstable schedules.

CAUSAL RESEARCH QUESTIONS

What are the factors impacting scheduling in warehouses?

Are there unique aspects of warehouses that affect scheduling practices such as outsourcing, supply chain structure, technology, inventory type, organizational structure and ownership, or collective bargaining arrangements? If so, how do these or other factors affect scheduling practices?

What are the impacts of scheduling for workers in the warehouse sector?

If there are documented scheduling issues in the warehouse sector, how are these issues affecting workers? Are these practices affecting health outcomes, childcare access, income volatility, career pathways, mental health, or other areas?

Documenting scheduling interventions

Workers, advocates, policymakers, and—to some extent—employers have recognized the negative consequences of poor-scheduling quality and taken action to ameliorate its negative effects. To date, interventions to improve scheduling policies have been informed by research in the retail and service industry, but warehouse workers have largely been excluded from the enacted legislation at the state and local levels thus far. That might change as more efforts to enact fair workweek legislation across the country and nationally have included protections for warehouse employees. This interest in the scheduling practices of warehouse firms underscores the importance of high-quality research and the potential pathways, or tracks, interventions might take.

The first potential track for interventions is workplace-specific improvements to scheduling policies. Through collective bargaining agreements, grassroots organizing, and legal action, workers and advocates have pushed individual companies to change their scheduling practices. Among others, Gap, Starbucks Corp., Williams-Sonoma Inc., and Abercrombie & Fitch Co. have all announced changes to their scheduling practices, such as ending clopening and on-call shifts, though advocates question the degree to which some of these firms have followed through on their promises.36

Some of the retail companies implementing these changes have, in part, been influenced by research linking improved scheduling quality with productivity and profitability. Expanding the knowledge base on scheduling in the warehouse sector may prompt a similar response by firms in this industry.

The second potential track for intervention is legislative. Thus far, most political energy around improving worker schedules has targeted municipal and state legislative bodies. Those that have passed legislation designed to provide workers with more stable, predictable, and adequate schedules are:

  • New York City
  • San Francisco
  • Seattle
  • Philadelphia
  • Emeryville, California
  • Chicago
  • The state of Oregon

Efforts are underway in Massachusetts, New Jersey, and Washington state to pass similar legislation. The Schedules that Work Act has been introduced at the federal level.

As researchers begin documenting potential workplace and legislative interventions in the warehouse sector, it will be important to hear directly from workers themselves. Poor scheduling quality has, in part, derived from the tendency to view workers as widgets that can be used or discarded erratically in order to control business costs. Researchers or policymakers considering interventions must avoid any similar tendencies. Focus groups, interviews, or worker advisors on research teams will help elevate the perspective of warehouse employees and could diversify the array of potential interventions.37

RESEARCH QUESTIONS TO DOCUMENT INTERVENTIONS

What interventions to improve scheduling quality are being implemented in the warehouse and logistics sector?

Have firms in the warehouse sector adopted scheduling interventions piloted in other sectors, such as tech-enabled shift swapping, establishment of standardized shifts, core scheduling, designating a group of part-time-plus employees, and targeted additional staffing? Have they implemented new interventions tailored to the nature of warehouse work?

Are covered warehouse managers aware of and responsive to fair workweek ordinances?

For warehouses covered by fair workweek ordinances, such as those in Chicago, are managers aware of the new law? How well do managers understand the law's provisions? What supports are firms supplying to managers to help them comply with the law?

Evaluating interventions

The final link in the research chain examined in this report is evaluation of interventions. Much of the ongoing research on scheduling in the retail and service sector is focused on evaluating interventions, and some firm-specific evaluations have been effective tools in changing companies' scheduling practices.38 Whether such evaluations can be completed in the warehouse space is dependent on firms' willingness to pilot scheduling interventions and partner with researchers.

Researchers from the Massachusetts Institute of Technology are proving that this kind of partnership is possible in the warehouse industry.39 Leveraging the association with high-quality schedules and worker productivity and profitability may be one way to encourage warehouse and logistics firms to support such research in their own sector.

With more jurisdictions adopting fair workweek legislation, it creates natural experiments for researchers to evaluate their effectiveness. Early evaluations of these ordinances are promising, but more research is needed to firmly establish the evidence base for these legislative solutions.40 Only Chicago covers warehouse workers under its scheduling ordinance, so pending evaluations may have limited applicability in the warehouse sector. Researchers should prioritize warehouse-specific evaluations in Chicago or other jurisdictions that are now considering ordinances that cover this sector, such as New Jersey.

These evaluations also must consider how the power of workers, or the lack thereof, factors into the effectiveness of these interventions. An evaluation of Seattle's ordinance, for example, noted that structuring an ordinance in which enforcement is "complaint-driven" potentially diminishes compliance with the law compared to strategic enforcement.41 These ordinances put the responsibility on individual workers to alert the appropriate authorities to any compliance issues.

This requires workers to have both familiarity with the law's specific provisions and confidence in a process that allows them to make complaints without retaliation. Research indicates that unions can be an important enforcement tool, in part because they provide workers with an intermediary entity for reporting violations without fear of retaliation.42 Any evaluations of scheduling interventions, therefore, must account for the presence of unions or other forms of worker power. Interviews and focus groups with workers can also provide insight into how satisfied workers are with the interventions and serve as another tool for promoting worker voice.

RESEARCH QUESTIONS TO EVALUATE INTERVENTIONS

What are the outcomes for warehouse workers with new scheduling quality interventions?

Following the implementation of workplace-specific or legislative interventions, how have worker schedules changed across the five domains of scheduling quality (stability, predictability, timing, quantity, and control)? Do workers express satisfaction with these interventions? If scheduling practices have changed, has there been any impact on workers' hourly pay, income, or employment status? How have these interventions impacted other measures of worker well-being, such as safety on the job?

How are the outcomes for firms with new scheduling quality interventions?

How have firms responded to new workplace-specific or legislative interventions? Do firms report any unexpected costs or challenges in complying with interventions? Are managers and executives supportive of the changes? What supports from firms have improved compliance with scheduling interventions? How does the industry's role in the supply chain impact the efficacy of scheduling interventions?

CONCLUSION

Conclusion

As the warehouse sector in the United States continues to grow and faces more scrutiny on working conditions and worker safety, researchers and advocates are paying attention to the role scheduling practices play in the industry. As in the case of retail and service workers, the use of new technologies is changing the way work is scheduled, assigned, and distributed in warehouses.

The extent to which warehouse workers encounter similar scheduling issues to workers in the retail and service sector, however, remains an open question. In convening researchers, advocates, and workers, Equitable Growth continues its efforts to broaden understanding on scheduling practices across industries. The learning from this convening, summarized and supplemented above, highlights the unique aspects of the industry, as well as areas ripe for further study.

Building off this learning to expand the knowledge base around scheduling in warehouses will help inform policymakers and firms seeking to improve productivity, safety, and well-being at this critical link in the U.S. economy's supply chains.

ABOUT THE AUTHORS

Sam Abbott is a family economic security policy analyst at the Washington Center for Equitable Growth. Alix Gould-Werth is the director of family economic security policy at the Washington Center for Equitable Growth.

ACKNOWLEDGMENTS

The Washington Center for Equitable Growth would like to thank the researchers, advocates, and workers who participated in the February 2020 research convening, "Work Schedules in the Warehouse and Logistics Sector." Their scholarship, insight, and experiences informed the content of this report. Additionally, the authors would like to thank Susan J. Lambert and Beth Gutelius, whose expertise on scheduling practices and the logistics sector, respectively, were foundational in the planning of the convening and this report.

Finally, special thanks are owed to Erin Kelly, Alex Kowalski, Beth Gutelius, Maggie Corser, and Peter Fugiel for their review and comments on drafts of this brief.


 -- via my feedly newsfeed