https://www.epi.org/blog/the-unemployment-rate-is-not-the-right-measure-to-make-economic-policy-decisions-around-the-coronavirus-driven-recession/
Policymakers often use the unemployment rate to trigger when to turn on or turn off financial assistance in economic downturns and recoveries. The unemployment rate, however, is a bad choice for a policy trigger in the current pandemic-driven recession.
A large share of workers who lose their jobs in the coming weeks and months will very likely not be counted in the official unemployment rate because they won't be actively looking for work. Given the nature of the pandemic, where we are all being told to stay away from work and all non-essential public activity, many laid-off workers will make the rational decision not to search for work until they get the all-clear from public health authorities.
Think of the restaurant worker who just got laid off. They might not report looking for work because that whole sector is shut down. What would be the point in actively looking for a job when it's clear that there are none out there?
Instead of using the unemployment rate as a trigger-off mechanism, policymakers should use the employment rate—the share of the adult population with a job.
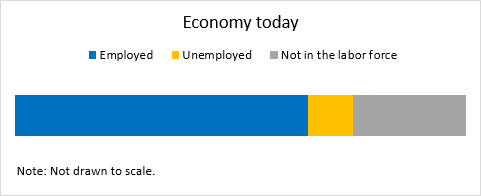
This is how the economy looked before the pandemic hit the United States. (Please note: All figures are simply for illustrative purposes and are not drawn to scale.) In February 2020, the employment rate was 61.1% and the unemployment rate was 3.5%. The group economists call "not in the labor force" is composed of people who don't have a job now and haven't looked recently. Many in this group are going to school, unable to work for health reasons, retired, have caregiving responsibilities, or are not working for a host of other reasons.
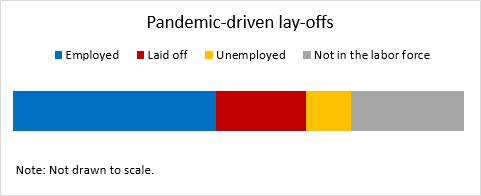
Then the pandemic hits and—depending on the GDP projections used—an estimated 3 to 14 million jobs will be lost. For this exercise, let's take a rough midpoint estimate of 10 million jobs lost by June. All of this is going to happen very quickly, much more quickly even than what happened during the Great Recession. There are new reports of layoffs every day and we saw just the tip of the iceberg in yesterday's unemployment insurance claims. The red bar (shown below) represents these 10 million workers who have been laid off. How are they going to be counted in the employment statistics? And, again, this is vital because these statistics are the ones that are typically used to trigger when help is no longer needed for people throughout the country.
There are a couple of options of where those laid-off workers can get counted. The figure below shows the two extremes.
In the first bar, the laid-off workers get counted among the unemployed, swelling the ranks of the unemployed by nearly threefold. Again, the illustrations are not drawn to scale, but as of February 2020, there were about 5.8 million unemployed workers in the economy. If we add a reasonable estimate of 10 million laid-off workers to the ranks of the unemployed, the unemployed number will swell to about 16 million. This translates into an unemployed rate of 9.6%, significantly higher than the pre-pandemic rate of 3.5%.
But, remember, workers are only officially counted as unemployed if they are actively searching for a job. This pandemic-driven recession is highly unusual and many laid-off workers are not only seeing jobs cut, but entire sectors decimated. What would be the point in looking for a new job when there are no job openings?
The second stacked bar in the figure below shows those laid-off workers getting counted as out of the labor force. Those workers may believe—and they'd mostly be right—that there are no opportunities for them in the labor force in the immediate future, so dropping out until the "curve is flattened" is the most reasonable alternative. In this case, they would not get counted among the unemployed, and policymakers may incorrectly believe that the labor market is functioning much better than it really is. If none of the newly out of work searched for a new job, the unemployment rate would stay at 3.5% and the policy triggers would be none the wiser.
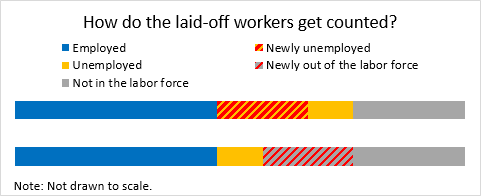
Now, take a look at that figure again. What's consistent in both sets of bars? The share of the employed doesn't change, regardless of how those laid-off workers get counted. Recall that in the pre-pandemic economy, the employment rate—also known as the employment-to-population ratio—is 61.1%. If an estimated 10 million workers lose their jobs in the near term, the employment rate will fall by about 3.8 percentage points to 57.3%. A reasonable trigger-off point could be when the employment rate climbs back up to within a half a percentage point of the pre-pandemic rate, meaning aid and stimulus should still be flowing at least up until the employment rate climbs back up to 60.6%.
Clearly, the employment rate would be a better measure of labor market strength than the unemployment rate to determine when workers and their families are back to pre-pandemic labor market conditions. And, in some ways, this also may understate labor market weakness because this leaves out the fact that many workers are not only getting laid off, but are actually having their hours cut. To measure this, we can turn to two different metrics in the employment statistics. The first is to look at those who are working part-time for economic reasons and the second is to look at total work hours in the economy.
Let's start with part-time for economic reasons, also known as involuntary part-time. This refers to workers who are working fewer hours than they want for a variety of reasons, including unfavorable business conditions at their current job, the inability to find full-time work, seasonal declines in demand, and slack work. Pre-pandemic involuntary part-time was at 4.3 million workers. This is in line with pre-Great Recession levels: The average level of part-time for economic reasons, for example, was 4.4 million in 2007. It doubled in two years to 8.9 million in 2009. It is likely that the pandemic will significantly increase the number of workers who remain working—and therefore won't be counted among the job losses—but will still be experiencing significant losses in wages and incomes.
Total work hours in the labor market is another way to get at both job losses and cuts in work hours. The Bureau of Labor Statistics creates a measure of aggregate weekly hours each month indexed to 2007 levels. Between 2007 and 2009, aggregate work hours fell by a whopping 7.5%. A large reduction in work hours is also expected in this pandemic-driven recession as workers are laid off and their hours are reduced.
Both of these are important metrics to measure labor market weakness on top of total job losses, and they should be tracked closely and even be considered as potential policy triggers instead of, or in addition to, the employment rate. At a minimum, policymakers should steer clear of unemployment rate-related triggers and use the employment rate to assess the continued need for support to workers and their families and other stimulus measures.
Whatever measures we take and however successful we are in returning the economy to its pre-pandemic state, economic policymakers will still have much work to do to ensure that important segments of society that were not participating in the previous economic expansion experience substantial boosts in wages, benefits, and employment.
-- via my feedly newsfeed

No comments:
Post a Comment