Lane Kenworthy, The Good Society
July 2019
In a representative democracy, a key goal is to ensure that government is "for the people" — that it does what citizens want.What are Americans' policy preferences? What groups and political parties do they identify with? Who do they vote for and why?
GENERAL TENDENCIES IN POLITICAL BELIEFS AND BEHAVIOR
Let's begin with some basic facts about political beliefs and behavior.
Ignorance and limited interest. Most people don't care much about politics and invest little time and effort learning about issues and developing informed preferences.
Identity. In part because of this ignorance and lack of interest, people often form opinions on issues based on what they perceive to be the position of their group or team or "identity" — a religious or racial or ethnic or regional group, a generation or cohort, a political party.
"Independents." In politics, the strongest allegiance tends to be to parties. Most people who declare themselves to be independent in fact lean toward one party and consistently vote for it. There are few genuine political independents.
Economic self-interest. A person with low income has an economic self-interest in favoring a political party that advocates generous government benefits and high taxes, because she will likely receive more in benefits than she pays in taxes. The reverse is true for a person with high income. In the middle of the 20th century, there was a strong positive correlation between income and right-party affiliation and voting. This suggests that people tended to affiliate and vote in line with their financial self-interest.
Affluence and public insurance. People tend to dislike loss. The higher our income, the more insurance we are willing to purchase in order to minimize potential loss. This leads to growing support for government social programs as a country gets richer.
Materialism and postmaterialism. Beginning in the 1970s, there's been a shift in the rich democratic nations from survival/materialist/traditionalist value orientations toward postmaterialist/self-expressive orientations. The new value orientations prioritize individual freedom, tolerance, fairness, equal opportunity, and inclusion. This shift happens when people are able to take survival and economic security for granted. It began with the cohort that grew up after World War II and has gotten stronger in successive cohorts.
Stickiness over the life course. Most people's value orientation and political party preference are formed around age 20 and remain the same throughout their life.
Economic period effects. There are period effects in value orientations. The main one is in response to economic downturns, which cause people to become less altruistic and fairness-minded. This tends to be temporary; when the economy improves, values and beliefs usually return to where they were before the downturn. One exception is when a society reaches a point at which postmaterialist/self-expression values exceed survival/materialist values in a country; when this happens, even middle-aged and older persons may permanently change their views to conform to the new cultural norms (e.g., acceptance of homosexuality).
Myopia. People's assessment of the performance of incumbent parties or candidates tends to attach an excessive weight to the very recent past.
These general tendencies help us to understand a good bit about Americans' political preferences and voting behavior.
MANY AMERICANS DISLIKE THE IDEA OF BIG GOVERNMENT, BUT THEY LIKE A LOT OF THE THINGS GOVERNMENT DOES
Surveys conducted since the mid-1970s have asked representative samples of American adults "If you had to choose, would you rather have a smaller government providing fewer services or a bigger government providing more services?" In only a few years has the share choosing "bigger government providing more services" reached 50%; in most years it has hovered between 30% and 45%. Gallup periodically asks "In your opinion, which of the following will be the biggest threat to the country in the future — big business, big labor, or big government?" Since the early 1980s, 50-70% of Americans have said "big government" is the largest threat. For more than twenty years, the Pew Research Center has asked Americans whether they agree or disagree that "When something is run by the government, it is usually inefficient and wasteful." In each year 55% to 75% have said they completely agree or mostly agree. The National Election Study (NES) regularly asks "Do you think that people in government waste a lot of the money we pay in taxes, waste some of it, or don't waste very much of it?" In most years 60% to 75% have said "a lot." Since the early 1970s, the General Social Survey (GSS) has asked Americans if they have "a great deal of confidence, only some confidence, or hardly any confidence at all" in various organizations and institutions. For Congress and the president, the share responding "a great deal of confidence" has been below 30% in every year.
Public opinion data like these suggest that Americans don't want a big government. Yet they hide a deeper truth: while Americans are ideologically conservative when it comes to the size and scope of government, we're programmatically progressive. We're averse to big government in the abstract, but we like a lot of the things government actually does.
The General Social Survey regularly asks a set of questions prefaced by the following statement: "We are faced with many problems in this country, none of which can be solved easily or inexpensively. I'm going to name some of these problems, and for each one I'd like you to tell me whether you think we're spending too much money on it, too little money, or about the right amount." Since the late 1970s a large majority, always over 80% and often more than 90%, has said current spending is too little or about right on "assistance to the poor," on "improving the nation's education system," on "improving and protecting the nation's health," and on "Social Security." An irregular series of polls since 1980 has asked "Do you favor or oppose national health insurance, which would be financed by tax money, paying for most forms of health care?" In almost every instance 50% to 65% have said they are in favor, with 25% to 40% opposed. In 2011 the Pew Research Center found 61% of Americans saying "people on Medicare already pay enough of the cost of their health care" versus 31% saying "people on Medicare need to be more responsible for the cost of their health care in order to keep the program financially secure." In 2007, Benjamin Page and Lawrence Jacobs asked a representative sample of Americans "Would you be willing to pay more taxes in order to provide health coverage for everyone?" Nearly 60% were willing, versus just 40% who were unwilling. They asked the same question about paying more in taxes for "early childhood education in kindergarten and nursery school." Here 64% were willing, versus 33% unwilling. Page and Jacobs also asked whether the Earned Income Tax Credit (EITC) should be increased, decreased, or kept about the same. More than 90% wanted it increased or kept the same. The only noteworthy exception to the popularity of existing social programs in America is "welfare."
James Stimson has compiled a large number of public opinion survey questions about government programs into a single indicator of "policy liberalism." The measure indicates the average share of Americans who support liberal (progressive) positions over conservative positions. As figure 1 shows, the liberal share has been above 50% in every year since the early 1950s.

Figure 1. Policy liberalism
Share of American adults who favor the bigger-government position rather than the smaller-government position on an array of public opinion survey questions. Data source: James Stimson, stimson.web.unc.edu/data, series public policy mood.
Has there been movement over time? Yes, but that movement is cyclical rather than secular. Policy liberalism tends to shift in reaction to which party holds the presidency: it typically decreases when a Democrat is president and increases when a Republican holds the White House.
We can be pretty confident from these data that Americans haven't soured on government programs over the past half century. Indeed, the policy liberalism scores probably hide public support for an increasing government role. Over this lengthy period, we have steadily added more government programs and increased spending on many of the programs that already existed. Some of the questions ask whether the respondent favors less spending, more spending, or no change on a particular program. If spending rises and the share saying they favor more spending holds constant, support for a large government role likely has increased. The same is true if the policy liberalism indicator holds steady over time while including more and more programs.
So although many Americans dislike the idea of big government, when we think in terms of specific programs we're not at all averse to a government that is medium-sized or even large.
MORE AMERICANS CONSIDER THEMSELVES "CONSERVATIVE" THAN "LIBERAL," BUT THAT'S MISLEADING
Gallup, the American National Elections Study (ANES), the General Social Survey (GSS), and other public opinion polls have regularly asked American adults a question such as "I'm going to show you a seven-point scale on which the political views that people might hold are arranged from extremely liberal to extremely conservative. Where would you place yourself on this scale?" Political analysts typically code the three points to the left as "liberal," the middle point as "moderate," and the three points to the right as "conservative."
Figure 2 shows that, among those who choose either liberal or conservative (not moderate), the share identifying as "liberal" has never been a majority. The liberal share was flat in the 1940s and 1950s, then fell by six percentage points between 1963 and 1991, and since then has again held constant.
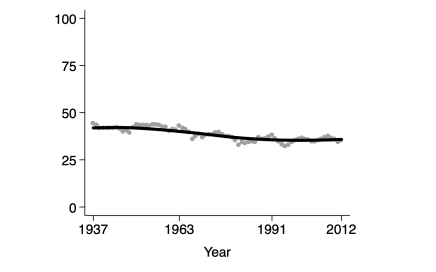
Figure 2. Liberal political views
Share identifying as liberal, among those who identify as either liberal or conservative (not moderate). Data source: James Stimson, stimson.web.unc.edu/data, series macroideology. For details on the data, see Christopher Ellis and James A. Stimson, Ideology in America, Cambridge University Press, 2012, ch. 4.
Christopher Ellis and James Stimson have looked carefully into these data. They find that most Americans who identify as liberal are "consistent liberals," meaning they also choose progressive positions on policy issues. But among those who identify as conservative, only about one-third are "consistent conservatives." Another sizable group think of themselves as conservative because they hold conservative views specifically on cultural issues, such as religion, abortion, and homosexuality. A third segment identifies as conservative not because of their views on government, the economy, or culture, but because they see the label "conservative" as reflecting their approach to life — respect for tradition and authority, playing by the rules, and following convention in appearance and behavior.
Conservatism in America, Ellis and Stimson conclude, is as much symbolic as it is political. That is why the share identifying as liberal or conservative is, among other things, a poor predictor of election outcomes.
AMERICANS ARE SPLIT ROUGHLY 50-50 BETWEEN THE TWO POLITICAL PARTIES
In the 1950s, 1960s, and 1970s, Democrats enjoyed a large advantage in party identification, as we see in figure 3. Since 1980 the Democratic edge in affiliation has been smaller. Combined with the fact that self-identified Republicans are more likely than their Democratic counterparts to vote, this has yielded an electorate that is split about evenly between the two parties.
The result is that while Democrats dominated elections to the House, Senate, and to a lesser extent the presidency through the end of the 1970s, since then the two parties have alternated in power, as we see in figure 4.
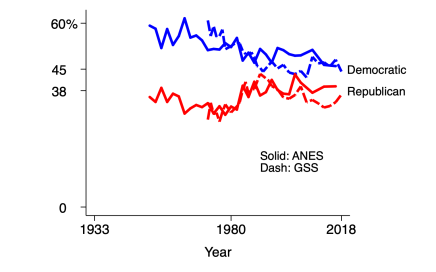
Figure 3. Party identification
Share of US adults. Question: "Generally speaking, do you usually think of yourself as a …?" The ANES has seven response options: strong Democrat, weak Democrat, independent leaning Democrat, independent, independent leaning Republican, weak Republican, strong Republican. Data source: American National Election Studies, ANES 1948-2016 cumulative datafile, sda.berkeley.edu, series VCF0303. The GSS has eight response options: strong Democrat, not strong Democrat, independent leaning Democrat, independent, independent leaning Republican, not strong Republican, strong Republican, other party. "Democrat" here is the three Democrat groups. "Republican" is the three Republican groups. Those choosing "other party" in the GSS, usually just 1% or 2%, are excluded. Data source: General Social Survey, sda.berkeley.edu, series partyid.

Figure 4. Partisan control of government
Blue: Democratic control. Red: Republican control.
RECENT ECONOMIC PERFORMANCE IS THE MAIN DETERMINANT OF NATIONAL ELECTION OUTCOMES
Citizens care a lot about how the economy is doing, and they tend to be myopic. We would therefore expect recent economic performance to influence how people vote. In fact, it has a huge impact on presidential election outcomes, as we see in figure 5.On the vertical axis is the incumbent-party candidate's vote margin. On the horizontal axis is the growth rate of per capita real disposable personal income in the middle two quarters (April to September) of the election year, adjusted for how long the incumbent party has been in office. This simple model does a very good job at predicting the vote outcome. Other models can predict even more accurately by including additional factors, but in all of them measures of recent economic performance play a central role.

Figure 5. Income growth and presidential election outcomes
Vertical axis: incumbent-party candidate's popular vote margin. Data source: Wikipedia. Horizontal axis: growth rate of real disposable personal income per capita in the second and third quarters of the election year, adjusted for incumbency (-1.29 for each consecutive term, beyond the first, that the incumbent party has held the White House). Data source: Bureau of Economic Analysis, bea.gov, using National Income and Product Accounts (NIPA) data. This replicates and extends Larry Bartels' chart in "Obama Toes the Line," The Monkey Cage, 2013. For more detail, see Christopher Achen and Larry Bartels, Democracy for Realists, Princeton University Press, 2016, ch. 6. The line is a linear regression line. The correlation is +.91.
What about Congress? House and Senate elections are more idiosyncratic than presidential elections. Yet the condition of the national economy has consistently been a good predictor of the outcome, and congressional elections increasingly are influenced by the popularity of the current president, which in turn hinges on the economy.
WHY DO RICH STATES TEND TO VOTE DEMOCRATIC AND POOR STATES TEND TO VOTE REPUBLICAN?
As noted earlier, people with higher incomes are more likely to vote for the party that advocates lower taxes and smaller government, which in the US is the Republican party. In other words, affluent Americans tend to vote Republican.
Yet when we look across the US states, we see that affluent states are more likely to vote Democratic while poorer states tend to vote Republican. Figure 6 shows how this looked in the 2016 presidential election.

Figure 6. Income and Republican vote share
Vote share for the Republican candidate: 2016 presidential election. Data source: Wikipedia, "2016 United States Presidential Election." Median household income: three-year average for 2015-2017. Data source: US Census Bureau, "Historical Income Tables: Households," table H-8B. The line is a linear regression line.
What explains this state-income paradox?
One common view is that lower-income voters in poor states now vote based on their conservative preferences on social and cultural issues ("God, guns, and gays") or their resentment against "takers" and "welfare" cheats, rather than on their economic interests. Their views on social and cultural issues tend to be traditional, so they vote Republican.
While this may contribute, the main cause of the state-income paradox is that higher-income voters, not lower-income ones, betray their economic self-interest. Many upper-income voters, especially highly-educated ones, now vote based on their views on social-cultural issues. In rich states their views on these issues tend to be progressive, so they vote Democratic. In poorer states their views tend to be traditional, in part because they're more likely to be religious.
The chart in figure 7 is from Andrew Gelman, David Park, Boris Shor, and Jeronimo Cortina. It shows voting by household income in a low-income state (Mississippi), a middle-income state (Ohio), and a high-income state (Connecticut) in the 2004 presidential election. The conventional view predicts that lower-income voters in a state such as Mississippi will vote Republican. But they don't. They, like their counterparts in Ohio and Connecticut, tend to vote Democratic. What differs across the three states is mainly how higher-income persons vote. In the low-income state, Mississippi, they tend to vote Republican. This is likely based on their economic interests or their preferences on cultural issues — perhaps both. In the high-income state, Connecticut, high-income voters instead tend to vote like low-income voters; they vote Democratic. This is probably because their views on cultural issues are liberal.

Figure 7. Income and Republican voting in a low-income state, a middle-income state, and a high-income state
2004 presidential election. Source: Andrew Gelman, David Park, Boris Shor, and Jeronimo Cortina, Red State, Blue State, Rich State, Poor State: Why Americans Vote the Way They Do, Princeton University Press, 2008, figure 2.7.
Recall the tendency of people to shift to postmaterialist values once they reach a certain level of affluence ("General Tendencies" section above). This would lead us to expect people with higher incomes to be more likely than lower-income persons to vote based on cultural preferences rather than economic self-interest. And that is what we observe, according to the finding of Gelman and his coauthors.
There is a different take, however, on why higher-income voters in rich states tend to vote Democratic. Figure 8, from Lee Drutman, Vanessa Williamson, and Felicia Wong, shows views on a variety of questions about government social programs, regulation, and taxes. On average, Democrats are more likely than Republicans to favor the progressive position, as we would expect. And lower-income Republicans are more likely than higher-income Republicans to support the progressive position; this too is what we would expect. The surprise is that higher-income Democrats are just as likely as low-income Democrats to be economically progressive.

Figure 8. Higher-income Democrats tend to be economically progressive
Vertical axis: Higher scores reflect more progressive responses to the following questions: Should government … provide tax credits for lower-income workers, require employers to provide paid leave for parents and caretakers, raise the minimum wage, raise taxes on families with incomes over $200,000, break up big banks, reduce government regulation of businesses, make it easier for workers to unionize, reduce differences in income? Horizontal axis: household income (shown separately for Democrats and Republicans). Source: Lee Drutman, Vanessa Williamson, and Felicia Wong, "On the Money: How Americans' Economic Views Define, and Defy, Party Lines," Democracy Fund Voter Study Group, 2019, figure 2.
Now, it could be that higher-income (or more-educated) Americans in rich states side with Democrats due mainly to their cultural preferences, and once they do so they then gravitate toward Democrats' views on economic issues. But the pattern in figure 8 at least suggests reason for caution about the assumption that cultural issues are the key to explaining the state-income paradox.
WHY DID WORKING-CLASS WHITES TURN AWAY FROM THE DEMOCRATS?
Figure 3 above shows that there has been little if any change in Americans' identification with the Republican party since polling began in the 1950s. Identification with the Democrats, on the other hand, has dropped significantly since the early 1960s.
Given that there are only two major political parties, this decline isn't surprising. The Democrats had a huge margin in the middle of the 20th century, and that probably that would have eventually eroded on its own. In addition, the Democrats' advantage was partly artificial: following the Civil War, most southerners refused to vote Republican, giving the Democrats a near monopoly in the south even though it is the country's most conservative region. This was bound to end at some point, and it did following passage of the Civil Rights Act and the Voting Rights Act in the mid-1960s under a Democratic president and congress.
More puzzling is why there was an equally strong decline in Democratic identification among working-class whites. On economic self-interest grounds, this group ought to lean Democratic. Figure 9 shows this decline for two different measures of "working-class": having less than a four-year college degree and being in the bottom third of the income distribution.

Figure 9. Working-class whites' Democratic identification
Share of US adults. "Non-FYCD" = less than a four-year college degree. "Low income" = bottom third of the income distribution. Question: "Generally speaking, do you usually think of yourself as a strong Democrat, weak Democrat, independent leaning Democrat, independent, independent leaning Republican, weak Republican, strong Republican?" "Democrat" here is the three Democrat groups. Data source: American National Election Studies, ANES 1948-2016 cumulative datafile, sda.berkeley.edu, series VCF0303, VCF0105A, VCF0110, VCF0114.
Working-class whites are of interest in part because, as we see in figure 10, they are a large portion of the American population, even though their share has been shrinking.

Figure 10. Whites with less than a four-year college degree as a share of the total population
Persons age 25 and older. Data source: General Social Survey, sda.berkeley.edu, series race, racehisp, degree.
One hypothesis says working-class whites' growing conservatism is what led them to defect from the Democrats. This fits with media and pundit emphases on "hard hats for Nixon," blue-collar Reagan supporters, and the huge share of whites without a college degree who voted for Donald Trump in 2016. But public opinion survey data suggest it isn't true, as an array of graphs in the appendix show. On nearly every relevant issue, the views of non-college-degree whites either didn't change or became less conservative.
A second hypothesis says the Democratic Party moved to the left of working-class whites on some key social and cultural issues. This is what we would expect to happen given the shift toward a postmaterialist value orientation beginning with the cohort who grew up after World War II. Think of two dimensions of politics: (1) government intervention in the economy; (2) traditionalism vs openness/change/individual freedom on social and cultural issues. For much of the 20th century, the economic dimension dominated people's vote choice. Left parties such as the Democrats came into the 1970s associated mainly with more government intervention in the economy but also with more openness, fairness, and inclusion on social and cultural issues. This led some highly-educated, high-income persons in the new postmaterialist cohorts to vote for left parties, even though their economic preferences (lower taxes) might have been more in line with the right. Because of their commitments to openness and inclusion and because their electoral base included more and more high-income/high-education postmaterialists, left parties increasingly embraced postmaterialist policy positions. This led some traditionalist low-income working-class voters to shift to parties of the right.
This is plausible. Democratic elected representatives did indeed move to the left on issues such as equal rights for women and African Americans, the role of religion in public schools, protection of the environment, and abortion. But we have no data that can tell us whether, and if so to what degree, this influenced working-class whites' party identification.
According to a third hypothesis, the shift to a postmaterialist orientation led some working-class whites to attach greater importance to social and cultural issues, as opposed to economic ones, in deciding their party preference. Given that the Democratic Party was to the left of a nontrivial share of working-class whites on social and cultural issues, this would produce a shift away from the party. This hypothesis is similar to the second one, but it says the key development was a rise in postmaterialism among working-class whites rather than a shift in the Democratic Party's positions. This too is plausible, but once again it is difficult if not impossible to assess with data.
A fourth hypothesis posits that a key cause of working-class whites' movement away from the Democratic Party was the bad economic period of 1973-83. In this story, 1973-83 was the 1930s revisited, with the parties reversed. The Democrats were in charge during a prolonged economic meltdown. The 1973-83 period featured a deep and lengthy recession in 1973-75, a sharp slowdown in growth of earnings and household incomes beginning in the mid-to-late 1970s, high unemployment beginning in the mid-1970s, high inflation (epitomized by a sharp rise in gas prices), a "double-dip" recession in 1980 and 1981-82, and high interest rates (the Federal Reserve's strategy to reduce inflation). And while economic troubles were at the center of concern, they were part of a broader context of dissatisfaction that included rising crime, growing disorder and decay in public spaces (schools, parks, city streets), national security debacles (the Vietnam War, the USSR's invasion of Afghanistan, the Iranian revolution and hostage crisis), and opposition to busing and affirmative action.
Beginning around 1978, Ronald Reagan and other Republicans offered a simple and seemingly plausible story that blamed Democratic policies (high taxes and heavy government regulation) and suggested a clear alternative (smaller government). The Republicans won the presidency and the Senate in 1980, and by 1984, when Reagan was running for reelection, the economic crisis had ended, so Republicans got credit for the recovery. As a result, a growing number of working-class whites no longer believed their economic interests were best served by the Democrats.
A fifth hypothesis comes from Larry Bartels. Bartels posits that a key influence on voters' party choice is the parties' performance at achieving income growth. During the period from 1945 through the end of the 1970s, income growth was far more rapid under Democratic presidents than under Republican ones. This, says Bartels, encouraged many working-class whites to prefer the Democratic Party.
However, voters are myopic, and Democrats have been less likely than Republicans to produce healthy income growth in election years. This should have led some working-class whites who preferred the Democrats' policy positions and who may like the party's long-run economic success to nevertheless vote Republican.
Bartels finds that this was indeed the case, at least up through the early 2000s election. This hypothesis also squares with regional and over-time differences in low-income whites' party choice and voting. Most important, it may help us better understand figure 11, which shows that Democratic presidential candidates have seldom gotten the votes of a majority of working-class whites, even back in the 1950s and 1960s. We tend to think of working-class whites' fondness for the Republican Party as a relatively recent phenomenon, but in terms of voting patterns that's wrong.
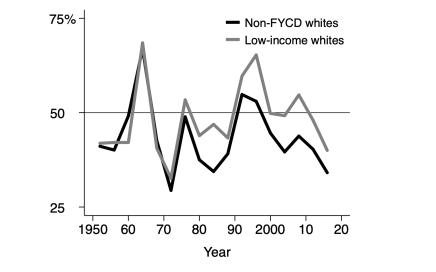
Figure 11. Working-class whites' Democratic voting
Democratic candidate's share of the two-party vote. Presidential elections. "Non-FYCD" = less than a four-year college degree. "Low income" = bottom third of the income distribution. The vertical axis doesn't begin at zero. Data source: American National Election Studies, ANES 1948-2016 cumulative datafile, sda.berkeley.edu, series VCF0704A, VCF0105A, VCF0110, VCF0114.
What's the bottom line? In the middle of the 20th century, a healthy majority of working-class whites identified as Democrats. That has diminished significantly since the early 1960s. Plausible causes abound, and there is little agreement among social scientists as to which has mattered most. When it comes to voting, on the other hand, it turns out that working-class whites were never solidly Democratic.
One final point here: If lots of working-class whites have voted Republican for quite some time, how can it be that, as I noted in an earlier section ("Why Do Rich States?"), low-income Americans tend to vote Democratic? The reason is that some working-class whites aren't low-income and many low-income Americans aren't white.
THE COMING DEMOCRATIC MAJORITY
In recent decades the United States has been close to a 50-50 country in national elections, with roughly half of voters casting ballots for Democratic candidates and half for Republican ones (see above). In their 2002 book, The Emerging Democratic Majority,John Judis and Ruy Teixeira predicted that this wouldn't be the case for too much longer, because demographic trends increasingly favor the Democrats. Urbanites, Latinos, and African Americans, three solidly Democratic groups, are a growing share of the country's population. Whites, religious persons, and rural dwellers, core Republican groups, are a shrinking share. And women and college-educated professionals, two groups that for much of the previous half century had leaned Republican, are increasingly progressive and thus more and more likely to favor the Democrats.
Figure 12 shows where these and other groups stood as of the 2016 election. The horizontal axis has the group's size as a portion of voters, and the vertical axis has the Democratic candidate's vote margin (plus or minus) among the group.
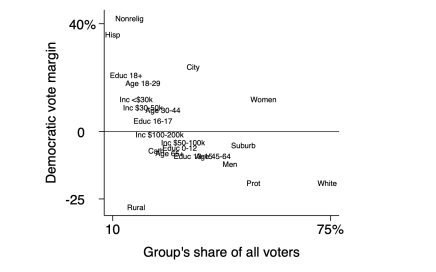
Figure 12. Sociodemographic groups' share of the electorate and party choice
2016 presidential election. Democratic vote margin: share voting for the Democratic candidate minus share voting for the Republican candidate. Group's share of all voters: percentage of those who cast ballots. African Americans aren't shown; in 2016 they were 10% of voters, and 80% of them voted for the Democratic candidate. "Cath" = Catholic. "City" = city with more than 50,000 population. "Hisp" = Hispanic. "Prot" = protestant. Data sources: "Election 2016: Exit Polls," New York Times, 2016; Rob Griffin, Ruy Teixeira, and John Halpin, "Voter Trends in 2016: A Final Examination," Center for American Progress, 2017; Ruth Igielnik, Scott Keeter, Courtney Kennedy, and Bradley Spahn, "Commercial Voter Files and the Study of U.S. Politics," Pew Research Center, 2018.
In the aftermath of the 2016 election, with Republicans holding the presidency and a majority in both houses of congress, it was easy to dismiss the notion of a coming Democratic majority. But if anything, the case for this projection is stronger now than when Judis and Teixeira first offered it.
Recent Republican parity (and occasional majority status) in national elections is largely a function of the country's antiquated electoral rules. The Democratic presidential candidate has gotten a majority of the popular vote in six of the past seven elections, but twice the electoral college has handed the presidency to the Republican instead. Democrats frequently get more votes than Republicans in Senate elections, but Republicans remain competitive because they have a hold on a number of small conservative states, each of which gets the same number of senate seats as large progressive states such as California and New York.
As a country gets richer, its citizens tend to want more insurance against loss, greater fairness and opportunity for the less-advantaged, and more individual freedom. The first of these leads to support for more generous and expansive government social programs. The second and third produce growing progressivism on social and cultural issues. Each of these shifts favors the Democratic Party.
We've already seen that most Americans, even those who dislike the idea of big government or who call themselves "conservative," favor much of what government actually does. And quite a few would prefer that government do more.
What about social and cultural issues? Figure 8 above showed that low-income Republicans differ from high-income Republicans in their degree of economic progressivism, with quite a few low-income Republicans just as progressive as Democrats. For Republicans, cultural conservatism has become just as important as limited government, if not moreso.
But cultural conservatism is on the decline. This is what we would expect, given the shift toward postmaterialist value orientations. And it is what we observe in the public opinion survey data. Every noteworthy cultural shift that has occurred over the past half century — on gender roles, families, racial and ethnic inclusion, religion, and more — has been away from traditionalism and in the direction of greater fairness and individual liberty. Figure 13, from Larry Bartels, shows that cultural conservatism has been declining slowly but steadily among not only Democrats but also independents and Republicans.

Figure 13. Cultural conservatism
Index measuring conservative views on issues such as respect for the American flag, the English language, and our national borders, antipathy toward Muslims, immigrants, atheists, and gays and lesbians, and racial resentment and concerns about discrimination against whites. Source: Larry Bartels, "Partisanship in the Trump Era," Center for the Study of Democratic Institutions, Vanderbilt University, 2018, figure 4, using data from YouGov's 2016 Cooperative Campaign Analysis Project.
The Republican Party's positions on economic, social, and cultural issues put it well outside the mainstream of political parties across the world's rich democratic nations. Figure 14 shows its positioning compared to parties in western Europe and Canada. The only ones to the right of the Republicans are a handful of nationalist anti-immigrant parties. And this isn't just a function of Donald Trump; the Republican Party's positioning has been this far to the right since 2000.
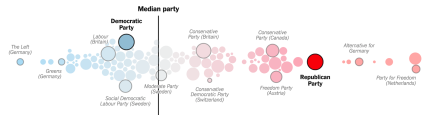
Figure 14. Party position on a left-right scale
Parties to the left are more progressive; parties to the right are more conservative. The scoring is based on parties' positions in their official manifesto/platform documents. Includes parties in a selection of western European countries, Canada, and the United States. Excludes parties that got less than 1% of the vote and parties no longer in existence. The size of the circles represents the party's vote share in the most recent election as of June 2019. Source: Sahil Chinoy, "What Happened to America's Political Center of Gravity?," New York Times, 2019, using Manifesto Project data.
The clearest signal that the Republican Party faces diminishing electoral support comes from the views and party preferences of younger Americans. Recall that value orientations and party preferences tend to be formed around age 20 and stick throughout the life course. "Millennials" and members of "generation Z" tend to be considerably more progressive on social and cultural issues than preceding generations. And as we see in figure 15, younger cohorts are more likely than their predecessors to identify as Democrats and much more likely to vote for Democrats.
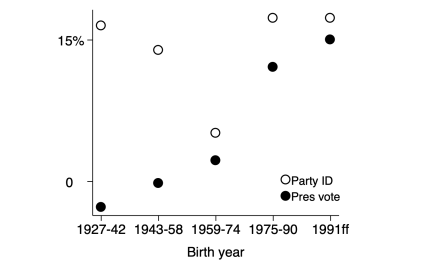
Figure 15. Democratic advantage in party identification and presidential voting
1952-2016. "Party ID" = share of persons identifying as Democrat (strong Democrat, not strong Democrat, or independent leaning Democrat) minus the share identifying as Republican (strong Republican, not strong Republican, or independent leaning Republican). "Pres vote" = share of persons voting for the Democratic candidate in presidential elections minus the share voting for the Republican candidate. Data source: American National Election Studies, ANES 1948-2016 cumulative datafile, sda.berkeley.edu, series VCF0303, VCF0704A, VCF0103.
What about racial anxiety and fear? Might that enable the Republican Party to remain electorally competitive without moving toward the political center?
People are less likely to empathize with those they see as different. While skin color is in principle an unimportant difference, for some it is a real or imagined marker of distinct norms, behaviors, and values. Members of a racial or ethnic group may therefore feel threatened by members of other groups. That can be particularly true when one group historically has held a dominant position vis-à-vis another, as with whites and African Americans in the United States, or where racial/ethnic difference is coupled with a sharp difference in religion, as with native populations in rich countries and Muslim immigrants. Difference can prompt not just uncertainty and discomfort but also fear.
When this happens, people's thinking can turn — or return — to a scarcity orientation. This reduces sentiment for fairness, personal freedom, and government programs that insure against loss. Instead, people tend to focus on protecting what they have, including the cultural norms and values they see as integral to their way of life. If they perceive these norms and values to be threatened by another group that is growing in size or newly prominent or assertive, they may turn to protective mode. When threats to existing patterns of life are coupled with a perceived threat to economic well-being and/or physical safety, the reaction may be even more intense. These developments can lead to a political backlash by the dominant group.
One important case, the California experience, suggests that backlash to racial diversity and immigration may be only a temporary savior for Republicans. In the first two-thirds of the 20th century, California's economy grew rapidly — propelled by natural resources, heavy investment in public goods (water, roads, ports, education), population inflow from other states, and emerging manufacturing industries. In the 1970s, however, the state struggled, like the nation as a whole, with rising unemployment and inflation. A decade later the decline of manufacturing jobs, also a nationwide phenomenon, began to bite, and in the 1990s California's defense-oriented manufacturing sector was hit hard by the end of the cold war. During this period the state also experienced an enormous rise in immigration. In 1960, California was home to 9% of America's population and 13% of its immigrants. By 1990, California had 12% of the nation's population and 32% of its immigrants.
These changes created, in Manuel Pastor's words, "a perfect stew of racial anxiety and economic drift." In concert with other developments — the 1960s counterculture and antiwar movement, urban riots, surging crime, and rapidly-rising property taxes — they sparked a popular backlash. In the 1980s, 1990s, and early 2000s, Californians elected law-and-order, tough-on-immigration Republicans to the governorship and prominent mayoral positions, and they voted in favor of a series of referendums to reduce taxes and limit supports for immigrants and minorities. In 1978, Californians passed Proposition 13, which reduced property tax revenues and limited future property tax increases, putting a crimp in funding for K-12 schools. It also hampered the state government's ability to raise general tax revenues by requiring than any proposed revenue increase get a two-thirds majority, rather that a simple majority, in both legislative bodies. Other referendums affirmed by California voters banned school busing and reversed other school desegregation mechanisms (1972, later ruled unconstitutional by the state's Supreme Court); banned affirmative action by the state government and other public entities, including in university admissions (1996); restricted bilingual education in schools (1998); prohibited unauthorized immigrants from having access to public services (1994, also later ruled unconstitutional); mandated a minimum sentence of 25 years for persons with a third felony conviction (1994); required juveniles accused of certain crimes to be treated as adults (2000); and imposed term limits on state legislators (1990).
By the mid-2000s, however, California's economy had found a new footing, led by the success of digital tech firms in Palo Alto and San Francisco. And while the state's population had become even more diverse, its white inhabitants had had more time to come to terms with this reality. The last gasp of the conservative backlash came in 2005, when Republican governor Arnold Schwarzenegger called a special election aimed at passing a set of propositions limiting state spending, labor union power, and teacher tenure. All of his initiatives were voted down. Over the past two decades Californians have turned away from a politics of traditionalism and fear. And the state's Republican Party, which mirrors national Republicans in hewing to small-government orthodoxy and to traditional views on many social and cultural issues, has steadily lost electoral ground.
Will the rest of the country follow suit? There is no guarantee it will, but one of the biggest potential obstacles, whites' discomfort with growing diversity, is very likely to diminish. As figure 16 shows, the nation's demographic mix is following California's. As it does so, whites' electoral influence will decrease, and so too will the degree to which racial anxiety shapes their political orientation.
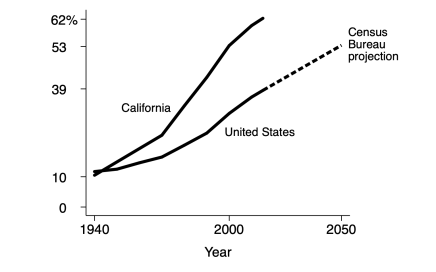
Figure 16. Population that is nonwhite and/or Hispanic
Share of the total population. The dashed portion of the line for the US as a whole is a projection. Data source: Census Bureau.
SUMMARY
Many Americans dislike the idea of big government, but they like a lot of the things government does. More Americans call themselves "conservative" than "liberal," but conservatism in the US is as much symbolic as political, an approach to life rather than a view about what government should or shouldn't do.
The best predictor of national election outcomes, by far, is the performance of the economy in the middle six months of the election year.
Across persons, income is positively correlated with voting for Republicans. Across states, the opposite is true. That's mainly because higher-income individuals in rich states increasingly vote Democratic — "against their economic interests." One view says this is because they are progressive on social and cultural issues, but some evidence suggests it may be because they've moved to the left on the role of government in the economy.
From the 1930s through the 1960s, Democrats enjoyed a large advantage over Republicans in party identification and in elections. The gap in party identification persists, but it has narrowed from around 20 to 25 percentage points to just 5 to 10. Because Republican identifiers are more likely to vote than Democrats, voting for the two parties has been split roughly 50-50 in recent decades.
Identification with the Democrats has decreased not just overall but also, perhaps more surprisingly, among working-class whites. There is little agreement among social scientists about what caused this. When it comes to voting, on the other hand, it turns out that working-class whites were never solidly Democratic.
While the two parties have been evenly matched in national elections in recent decades, a number of indicators suggest looming difficulties for the Republicans: demographic trends, the rise of postmaterialism and accompanying decline of cultural conservatism, and the progressivism and Democratic voting of younger cohorts. Backlash against growing racial diversity and immigration will help the Republicans, but California's experience over the past generation suggests it may do so only temporarily.
APPENDIX
The appendix has additional data.


