Friday, July 10, 2020

Dani Rodrik: China as Economic Bogeyman [feedly]

China as Economic Bogeyman
https://www.project-syndicate.org/commentary/west-should-stop-criticizing-china-industrial-policy-by-dani-rodrik-2020-07

Many Western economists presume that governments are not very good at identifying industries that merit support, and that domestic consumers and taxpayers incur the bulk of the costs. By the same logic, if Chinese policymakers effectively targeted activities where social benefits exceed private benefits, then it is not clear why foreigners should complain.

CAMBRIDGE – As COVID-19 spread from China to Europe and then the United States, pandemic-stricken countries found themselves in a mad scramble for medical supplies – masks, ventilators, protective garments. More often than not, it was to China that they had to turn.

By the time the crisis erupted, China had become the world's largest supplier of key products, accounting for half of all European and US imports of personal protective equipment. "China has laid the groundwork to dominate the market for protective and medical supplies for years to come," according to recent reporting by the New York Times.

When China first turned toward global markets, it had the advantage of virtually unlimited supplies of low-cost labor. But as everyone recognizes by now, China's manufacturing prowess is not the result of unfettered market forces.

As part of its Made in China 2025 policy, the Chinese government targeted ambitious increases in domestic producers' share of global medical supplies. The New York Times report explains in detail how the government provided cheap land to Chinese factories, extended subsidized loans, directed state companies to produce key materials, and stimulated domestic supply chains by requiring hospitals and firms to use local inputs.

For example, Sichuan, China's second-largest province, reduced by half the number of categories for which imports of medical equipment were allowed. Most hospitals were obliged to source everything locally, with only top hospitals allowed to bring in supplies from abroad.

Western media are now replete with accounts of China's "drive to dominate important cogs in the global industrial machine," in the words of the New York Times again. Increasingly, China's role in the world economy is portrayed in terms reminiscent not of "doux commerce" but of imperial aggression. Chinese President Xi Jinping's growing authoritarianism and the escalating trade conflicts with the US obviously play into this narrative as well.


The strategic and geopolitical tensions between the US and China are real. They are grounded in China's growing economic and military power and US leaders' reluctance to recognize the reality of a necessarily multipolar world. But we should not allow economics to become hostage to geopolitics or, worse, to reinforce and magnify the strategic rivalry.

For starters, we must recognize that a mixed, state-driven economic model has always been at the root of Chinese economic success. If one-half of China's economic miracle reflects its turn to markets after the late 1970s, the other half is the result of active government policies that protected old economic structures – such as state enterprises – while new industries were spawned through a wide array of industrial policies.

The Chinese people were the main beneficiaries, of course, experiencing the fastest poverty reduction in history. But these gains did not come at the expense of the rest of the world. Far from it. The growth policies that today arouse other countries' ire are the reason China has become such a large market for Western exporters and investors.

But aren't Chinese industrial policies, such as those deployed in medical supplies, unfair to competitors elsewhere?

We should exercise caution before reaching such a verdict. The standard justification for industrial policy is that new industries produce learning spillovers, technological externalities, and other broad social benefits that render state support desirable. But many Western economists presume that governments are not very good at identifying industries that merit support, and that domestic consumers and taxpayers incur the bulk of the costs. In other words, if Chinese industrial policy has been misguided and misdirected, it is China's own economy that has suffered as a result.

By the same logic, if Chinese policymakers effectively targeted activities where social benefits exceed private benefits, producing improved economic performance, then it is not clear why foreigners should complain. This is what economists call a case of "fixing market failures." It makes as much sense for outsiders to want to block the Chinese government from pursuing such policies as it does to prevent a competitor from freeing up its markets.

This is especially true when the externality in question is a global one, as in the case of climate change. Chinese subsidies for solar panels and wind turbines have produced a decline in the cost of renewable energy – an enormous benefit for the rest of the world.

Sign up for our weekly newsletter, PS on Sunday

The economics of industrial policy can get more complicated in the presence of monopolies and market-dominant firms. Industrial policies can be justifiably restricted when they enable the exercise of market power at the expense of the rest of the world.

But Chinese producers are rarely accused of propping up prices, which is the hallmark of market power. More often, the complaint is the opposite. Such considerations probably apply more to the US and European firms that are frequently the dominant players in high-tech markets.

None of this is an argument for other countries to stand idly by while China progresses to ever more sophisticated industries. The US, for one, has a long history of successful industrial policy, particularly in defense-related technologies. There is now broad political agreement in the US political spectrum that the country needs a more explicit industrial policy targeting good jobs, innovation, and a green economy. A bill advanced by the US Senate's top Democrat, Chuck Schumer, proposes to spend $100 billion over the next five years on new technologies.

Much of the new push for industrial policy in the US and Europe is motivated by the perceived Chinese "threat." But economic considerations suggest this is the wrong focus. The needs and remedies lie in the domestic sphere. The objective should be to build more productive, more inclusive economies at home – not simply to outcompete China or try to undercut its economic progress.
 -- via my feedly newsfeed

Thursday, July 9, 2020

Enlighten Radio:Talkin Socialism Friday morning -- Ruthie Foster, Bonnie, and Rhiannon Giddens till then

The Red Caboose has sent you a link to a blog:


Blog: Enlighten Radio
Post: Talkin Socialism Friday morning -- Ruthie Foster, Bonnie, and Rhiannon Giddens till then
Link: https://www.enlightenradio.org/2020/07/talkin-socialism-friday-morning-ruthie.html

--
Powered by Blogger
https://www.blogger.com/

Teleworking is Not Working for the Poor, the Young, and the Women [feedly]

Teleworking is Not Working for the Poor, the Young, and the Women
https://blogs.imf.org/2020/07/07/teleworking-is-not-working-for-the-poor-the-young-and-the-women/

The COVID-19 pandemic is devastating labor markets across the world. Tens of millions of workers lost their jobs, millions more out of the labor force altogether, and many occupations face an uncertain future. Social distancing measures threaten jobs requiring physical presence at the workplace or face-to-face interactions. Those unable to work remotely, unless deemed essential, face a significantly higher risk of reductions in hours or pay, temporary furloughs, or permanent layoffs. What types of jobs and workers are most at risk? Not surprisingly, the costs have fallen most heavily on those who are least able to bear them: the poor and the young in the lowest-paid jobs.

In a new paper, we investigate the feasibility to work from home in a large sample of advanced and emerging market economies. We estimate that nearly 100 million workers in 35 advanced and emerging countries (out of 189 IMF members) could be at high risk because they are unable to do their jobs remotely. This is equivalent to 15 percent of their workforce, on average. But there are important differences across countries and workers.

The nature of jobs in each country

Most studies measuring the feasibility of working from home follow job definitions used in the United States. But the same occupations in other countries may differ in the face-to-face interactions required, the technology intensity of the production process, or even access to digital infrastructure. To reflect that, the work-from-home feasibility index that we built uses the tasks actually performed within each country, according to surveys compiled by the OECD for 35 countries.

We found significant differences across countries even for the same occupations. It is much easier to telework in Norway and Singapore than in Turkey, Chile, Mexico, Ecuador, and Peru, simply because more than half the households in most emerging and developing countries don't even have a computer at home.

Who is most vulnerable?

Overall, workers in food and accommodation, and wholesale and retail trade, are the hardest hit for having the least "teleworkable" jobs at all. That means more than 20 million people in our sample who work in these sectors are at the highest risk of losing their jobs. Yet some are more vulnerable than others:

  • Young workers and those without university education are significantly less likely to work remotely. This higher risk is consistent with the age profiles of workers in the sectors hardest hit by lockdowns and social distancing policies. Worryingly, this suggests that the crisis could amplify intergenerational inequality.

  • Women could be particularly hit hard, threatening to undo some of the gains in gender equality made in recent decades. This is because women are disproportionately concentrated in the hardest-hit sectors like food service and accommodation. In addition, women carry a heavier burden of child care and domestic chores, while market provision of these services has been disrupted.

  • Part-time workers and employees of small and medium-sized firms face greater risk of job loss. Workers in part-time work are often the first to be let go when economic conditions deteriorate, and the last to be hired when conditions improve. They are also less likely to have access to health care and the formal insurance channels that can help them weather the crisis. In developing economies, in particular, part-time workers and those in informal work face a dramatically higher risk of falling into poverty.

The impact on low-income and precariously-employed workers could be particularly severe, amplifying long-standing inequities in societies. Our finding—that workers at the bottom of the earnings distribution are least able to work remotely—is corroborated by recent unemployment data from the United States and other countries. The COVID-19 crisis will exacerbate income inequality.

To compound the effect, workers at the bottom of the income distribution are already disproportionately concentrated in the hardest-hit sectors like food and accommodation services, which are among those sectors least amenable to teleworking. Low-income workers are also more likely to live hand-to-mouth and have little financial buffers like savings and access to credit.

How to protect the most vulnerable?

The pandemic is likely to change how work is done in many sectors. Consumers may rely more on e-commerce, to the detriment of retail jobs; and may order more takeout, reducing the labor market for restaurant workers.

What can governments do? They can focus on assisting the affected workers and their families by broadening social insurance and safety nets to cushion against income and employment loss. Wage subsidies and public-works programs can help them regain their livelihoods during the recovery.

To reduce inequality and give people better prospects, governments need to strengthen education and training to better prepare workers for the jobs of the future. Lifelong learning also means bolstering access to schooling and skills training to help workers displaced by economic shocks like COVID-19.

This crisis has clearly shown that being able to get online was a crucial determinant to people's ability to continue engaging in the workplace. Investing in digital infrastructure and closing the digital divide will allow disadvantaged groups to participate meaningfully in the future economy.


 -- via my feedly newsfeed

Tim Taylor: The Subway Map View of US Mortality and Health [feedly]

Tim Taylor: always finding diamonds in the rough

The Subway Map View of US Mortality and Health
https://conversableeconomist.blogspot.com/2020/07/the-subway-map-view-of-mortality-and.html

If the US had a national goal of improving health, it would quite possible take aggressive action to reduce current spending on health care, and instead use those funds to address social factors that affect health. Donald M. Berwick makes this case in his short essay, "The Moral Determinants of Health" (Journal of the American Medical Association, June 12, 2020). Berwick writes (footnotes omitted): 
Except for a few clinical preventive services, most hospitals and physician offices are repair shops, trying to correct the damage of causes collectively denoted "social determinants of health." Marmot has summarized these in 6 categories: conditions of birth and early childhood, education, work, the social circumstances of elders, a collection of elements of community resilience (such as transportation, housing, security, and a sense of community self-efficacy), and, cross-cutting all, what he calls "fairness," which generally amounts to a sufficient redistribution of wealth and income to ensure social and economic security and basic equity. ...

The power of these societal factors is enormous compared with the power of health care to counteract them. One common metaphor for social and health disparities is the "subway map" view of life expectancy, showing the expected life span of people who reside in the neighborhood of a train or subway stop. From midtown Manhattan to the South Bronx in New York City, life expectancy declines by 10 years: 6 months for every minute on the subway. Between the Chicago Loop and west side of the city, the difference in life expectancy is 16 years. At a population level, no existing or conceivable medical intervention comes within an order of magnitude of the effect of place on health. ...

How do humans invest in their own vitality and longevity? The answer seems illogical. In wealthy nations, science points to social causes, but most economic investments are nowhere near those causes. Vast, expensive repair shops (such as medical centers and emergency services) are hard at work, but minimal facilities are available to prevent the damage. In the US at the moment, 40 million people are hungry, almost 600 000 are homeless, 2.3 million are in prisons and jails with minimal health services (70% of whom experience mental illness or substance abuse), 40 million live in poverty, 40% of elders live in loneliness, and public transport in cities is decaying. ...

Decades of research on the true causes of ill health, a long series of pedigreed reports, and voices of public health advocacy have not changed this underinvestment in actual human well-being. Two possible sources of funds seem logically possible: either (a) raise taxes to allow governments to improve social determinants, or (b) shift some substantial fraction of health expenditures from an overbuilt, high-priced, wasteful, and frankly confiscatory system of hospitals and specialty care toward addressing social determinants instead. Either is logically possible, but neither is politically possible, at least not so far.
Here is one of the 21 "subway maps" of life expectancy in different areas of the United States from researchers at Virginia Commonwealth University ("Mapping Life Expectancy," September 26, 2016), this one using data from Chicago. 

Health care spending is headed for one-fifth of total GDP, and there's substantial reason to doubt that it is improving health by enough to justify that bill.  For example, here's a figure from Our World in Data showing the shifts health care spending per person over time (horizontal axis) and the change in life expectancy over time (vertical axis). The US is clearly on a different path from other high-income countries. 
Making sure people have access the kind of health care with a high impact on health seems like a valuable social goal. But if the overall social goal is improving health, not just feeding the health care industry, finding ways to transfer funds away from health care to other social needs that affect health may be more important than health insurance for all. For a previous post on the need for spending on programs "upstream" of medical care, see "U.S. Health Care: The Case for Going Upstream" (March 15, 2017). 

 -- via my feedly newsfeed

Census: Household Pulse Survey shows 34.9% of Households Expect Loss in Income; 25.9% Concerned about Housing [feedly]

Census: Household Pulse Survey shows 34.9% of Households Expect Loss in Income; 25.9% Concerned about Housing
http://feedproxy.google.com/~r/CalculatedRisk/~3/aVWHtjMUGsk/census-household-pulse-survey-shows-349.html

Note: The details in the pulse survey this week are concerning - especially about loss in income and concern about housing.

First, from @ernietedeschi 
The @uscensusbureau Household Pulse Survey, which performed admirably in anticipating the June jobs report, now shows employment has fallen by about 1.3 million cumulatively over the last 2 weeks.

Some of this may be seasonality or survey error, but it merits pause nonetheless.
This graph is from Ernie Tedeschi (former US Treasury economist).

Note: The question on lost income is always since March 13, 2020 - so this percentage will not decline.

From the Census Bureau: Measuring Household Experiences during the Coronavirus (COVID-19) Pandemic
The U.S. Census Bureau, in collaboration with five federal agencies, is in a unique position to produce data on the social and economic effects of COVID-19 on American households. The Household Pulse Survey is designed to deploy quickly and efficiently, collecting data to measure household experiences during the Coronavirus (COVID-19) pandemic. Data will be disseminated in near real-time to inform federal and state response and recovery planning.

Data collection for the Household Pulse Survey began on April 23, 2020. The Census Bureau will collect data for 90 days, and release data on a weekly basis.
This will be updated weekly, and the Census Bureau released the recent survey results last Wednesday. This survey asks about Loss in Employment Income, Expected Loss in Employment Income, Food Scarcity, Delayed Medical Care, Housing Insecurity and K-12 Educational Changes.

 Click on graph for larger image.

The data was collected between June 25 and June 30, 2020.

Definitions:

Loss in employment income: "Percentage of adults in households where someone had a loss in employment income since March 13, 2020."

This number is since March 13, and has increased slightly.

Expected Loss in Employment Income: "Percentage of adults who expect someone in their household to have a loss in employment income in the next 4 weeks."

34.9% of households expect a loss in income over the next 4 weeks.   This is down from 38.8% in late April, but up from 32% the previous (the previous week was the reference week for the BLS employment report).   This might suggest the job gains stalled after the data was collected for the June employment report.

Food Scarcity: Percentage of adults in households where there was either sometimes or often not enough to eat in the last 7 days.

About 10% of households report food scarcity.

Delayed Medical Care: "Percentage of adults who delayed getting medical care because of the COVID-19 pandemic in the last 4 weeks."

41.5% of households report they delayed medical care over the last 4 weeks. This has not declined.

Housing Insecurity: "Percentage of adults who missed last month's rent or mortgage payment, or who have slight or no confidence that their household can pay next month's rent or mortgage on time."

25.9% of households reported they missed last month's rent or mortgage payment (or little confidence in making this month's payment).  This has increased from a low of 22.1% in the survey of June 4th - June 9th.

Without an extension of the extra unemployment benefits (expires at the end of July), we will likely see a significant increase in housing stress.

K-12 Educational Changes: "Percentage of adults in households with children in public or private school, where classes were taught in a distance learning format, or changed in some other way."

Essentially all households with children are reporting were not being taught in a normal format.  

 -- via my feedly newsfeed

NMHC: Rent Payment Tracker Finds Decline in People Paying Rent in July [feedly]

NMHC: Rent Payment Tracker Finds Decline in People Paying Rent in July
http://feedproxy.google.com/~r/CalculatedRisk/~3/1ZhrhQESMt8/nmhc-rent-payment-tracker-finds-decline.html

Without further disaster relief, there will a significant housing and financial issue.

From the NMHC: NMHC Rent Payment Tracker Finds 77.4 Percent of Apartment Households Paid Rent as of July 6
The National Multifamily Housing Council (NMHC)'s Rent Payment Tracker found 77.4 percent of apartment households made a full or partial rent payment by July 6 in its survey of 11.4 million units of professionally managed apartment units across the country.

This is a 2.3-percentage point decrease from the share who paid rent through July 6, 2019 and compares to 80.8 percent that had paid by June 6, 2020. These data encompass a wide variety of market-rate rental properties across the United States, which can vary by size, type and average rental price.

"It is clear that state and federal unemployment assistance benefits have served as a lifeline for renters, making it possible for them to pay their rent," said Doug Bibby, NMHC President. "Unfortunately, there is a looming July 31 deadline when that aid ends. Without an extension or a direct renter assistance program, that NMHC has been calling for since the start of the pandemic, the U.S. could be headed toward historic dislocations of renters and business failures among apartment firms, exacerbating both unemployment and homelessness."
emphasis added
CR Note: It appears fewer people are paying their rent compared to last year (down 2.3 percentage points from a year ago).   In the previous surveys, over the last few months, people were paying their rents at about the same pace as last year.   The disaster relief has been key to helping people pay their bills, especially the extra unemployment benefits and the PPP.  

 -- via my feedly newsfeed

Almost four months in, joblessness remains at historic levels: Congress must extend the extra $600 in UI benefits, which expires in a little more than two weeks [feedly]

Almost four months in, joblessness remains at historic levels: Congress must extend the extra $600 in UI benefits, which expires in a little more than two weeks
https://www.epi.org/blog/almost-four-months-in-joblessness-remains-at-historic-levels-congress-must-extend-the-extra-600-in-ui-benefits-which-expires-in-a-little-more-than-two-weeks/

Last week, 2.4 million workers applied for unemployment insurance (UI) benefits. This is the 16th week in a row that unemployment claims have been more than twice the worst week of the Great Recession. Of the 2.4 million workers who applied for UI, 1.4 million applied for regular state unemployment insurance (not seasonally adjusted), and 1.0 million applied for Pandemic Unemployment Assistance (PUA). PUA is the federal program for workers who are not eligible for regular unemployment insurance (UI), like gig workers. It took some time, but all states except New Hampshire and West Virginia are now reporting PUA claims.

It's important to note that some initial claims from last week are likely from people who got laid off prior to last week but either waited until last week to file a claim, or applied earlier and their application had been caught in an agency backlog. Why do I think that's likely? In May, there were more than 8 million initial claims in regular state UI programs, but last week's Job Opening and Labor Turnover Survey (JOLTS) data show there were only 1.8 million layoffs, which is back to pre-virus levels. This suggests many May UI claims were from earlier layoffs, and that dynamic is likely still in play.

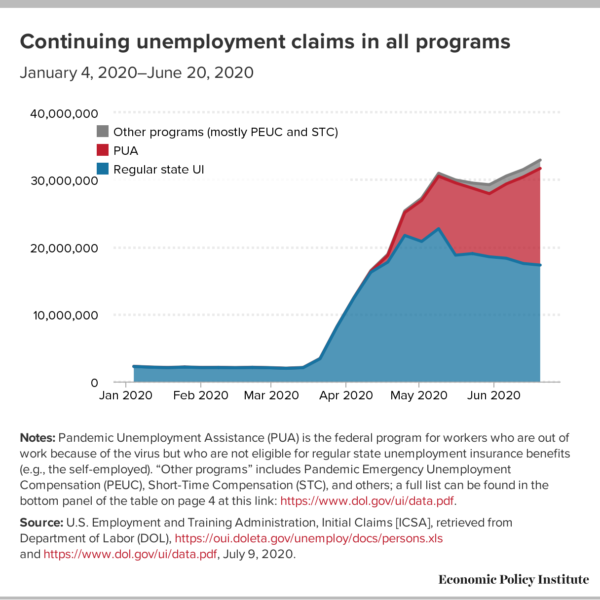
Figure A shows continuing claims in all programs over time (the latest data are for June 20). Continuing claims are more than 31 million above where they were a year ago. The latest figure in "other programs" in Figure A is 1.2 million claims. Most of this (0.9 million) is Pandemic Emergency Unemployment Compensation (PEUC). PEUC is the additional 13 weeks of benefits provided by the CARES Act for people who have exhausted regular state benefits. The number of people on PEUC can be expected to grow dramatically as the crisis drags on and more and more of the nearly 17 million people currently on regular state benefits exhaust their regular benefits and move on to PEUC.

Figure A

"Other programs" in Figure A also includes Short-Time Compensation (STC). STC is a great alternative to layoffs where employers reduce work hours rather than lay off workers, and workers get partial UI. But DOL reports that just 360,000 workers are receiving STC.

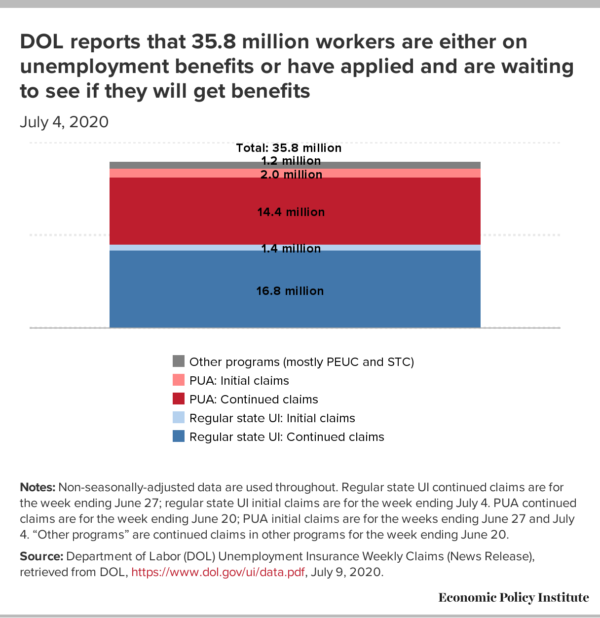
Figure A only covers continuing claims through June 20, but Figure B combines the most recent data on both continuing claims and initial claims to get a measure of the total number of people "on" unemployment benefits as of July 4th. DOL numbers indicate that right now, 35.8 million workers are either on unemployment benefits, have been approved and are waiting for benefits, or have applied recently and are waiting to get approved. That is more than one in five workers. But a note of caution: while regular state UI and PUA claims should be completely non-overlapping—that is how DOL has directed state agencies to report them—some states may be misreporting claims, so there may be some double counting. Further, some states may be including some back weeks in their continuing claims.

Figure B

Note that of the 35.8 million workers DOL's numbers indicate are "on" unemployment benefits, close to half (45.8%) are on PUA. This is a stark reminder of the huge gaps are in our regular state UI programs and how important it is that Congress established PUA, and continue to fund it.

Today's data highlight the deep recession we are now in. It's important to remember that this recession is exacerbating existing racial inequalities by causing greater job loss in Black households than white households. Policymakers must do much more. For starters, they need to extend the across-the-board $600 increase in weekly unemployment benefits, which was probably the most effective part of the CARES Act. The extra $600 expires in a little more than two weeks (the CARES Act says the $600 applies to weeks "ending on or before July 31," which is a Friday. Since, in the UI world, weeks typically end on Saturday, the last payment will be for the week ending July 25).

Letting the extra $600 expire would be a disaster for UI recipients, who would have to drastically cut their spending, and for the economy, which is being held afloat by this spending. Letting the $600 expire would cost more than 5 million jobs over the next year. Federal lawmakers also need to provide massive aid to state and local governments. Without it, 5.3 million workers in the public and private sector will lose their jobs by the end of 2021.


 -- via my feedly newsfeed