https://www.epi.org/blog/growing-inequalities-reflecting-growing-employer-power-have-generated-a-productivity-pay-gap-since-1979-productivity-has-grown-3-5-times-as-much-as-pay-for-the-typical-worker/
Key takeaways:
- Productivity and pay once climbed together. But in recent decades, productivity and pay have diverged: Net productivity grew 59.7% from 1979-2019 while a typical worker's compensation grew by 15.8%, according to EPI data released ahead of Labor Day.
- If median hourly compensation had grown at the same rate as productivity over the 1979-2019 period, the median worker would be making $9.00 more per hour.
- This divergence has been primarily driven by intentional policy choices creating rising inequality: both the top 10% and especially the top 1% and top 0.1% gained a much larger share of all compensation and labor's share of income eroded.
- Public policies which restore worker power and balance in the labor market can provide robust, widely shared wage growth.
The growth of inequalities is the central driver of the widening gap between the hourly compensation of a typical (median) worker and productivity—the income generated per hour of work—in recent decades. Specifically, this growing divergence has been driven by the growth of two distinct dimensions of inequality: the surge of compensation received by the top 10%—particularly the top 1.0% and top 0.1%—and the erosion of labor's share of income and the corresponding growth of capital's share. This post documents these trends by presenting an updated account of the U.S. productivity-pay divergence originally analyzed in both Mishel and Gee 2012 and Bivens and Mishel 2015.
The key metric, as explained below, is the lag between the growth of net productivity (taking into account depreciation and evaluated using consumer prices) and hourly compensation (wages and benefits) of a typical or median worker. Between 1979 and 2019, net productivity grew 59.7% while a typical (median) worker's compensation grew by 15.8%, a 43.9 percentage point divergence driven by inequality. The effects have been felt broadly: During this period, 90% of U.S. workers experienced wage growth (26%) far slower than the economywide average, while workers in the top 1% (mostly highly credentialed professionals and corporate managers) saw 160% wage growth (Mishel and Kandra 2020) and owners of capital reaped large rewards made possible only by this anemic wage growth for the bottom 90%.
This divergence between net productivity and a typical worker's compensation means that neither slow productivity growth nor inevitable economic forces can explain the poor wage growth of America's workers. In fact, wage problems are a "failure by design" (Bivens 2010), engineered by those with the most wealth and power. The dynamics are primarily located in the labor market and the strengthening of employers' power relative to their rank-and-file workforce (which increasingly includes those workers with a four-year college degree). As Mishel and Bivens (2021) recently documented, wage suppression was generated by policy choices that resulted in excessive unemployment, eroded unionization, corporate globalization, lower labor standards (e.g., lower minimum wage), new imposed contract terms (e.g., noncompetes), and corporate structures changes that pushed down wages and profits in supply chains to the benefit of large firms.
The gap between productivity and median hourly compensation growth
The last four decades have seen a systematic divergence between the growth of economywide productivity and the growth of hourly compensation (wages and benefits) for typical workers. We proxy the wages of "typical" workers as either wages for nonsupervisory workers (roughly 80% of the private-sector workforce) or wages for the worker earning the median wage. As a starting point, we compare this to the growth of net productivity for the entire economy (rather than only nonfarm businesses or any subset of the economy).
Figure A below shows the growth of net productivity (gross productivity minus depreciation) adjusted for inflation according to consumer prices (rather than inflation in all types of output including investment goods and government), which is labeled 'effective productivity' as it is available for household consumption. Figure A compares this growth with the typical worker's hourly compensation since 1948, using the hourly compensation of production/nonsupervisory workers because that is the only series available for the entire period since 1948 (it corresponds closely to median wage growth). Further detail on the underlying data and measurement issues can be found on the newly expanded EPI page providing information on the productivity-pay gap.
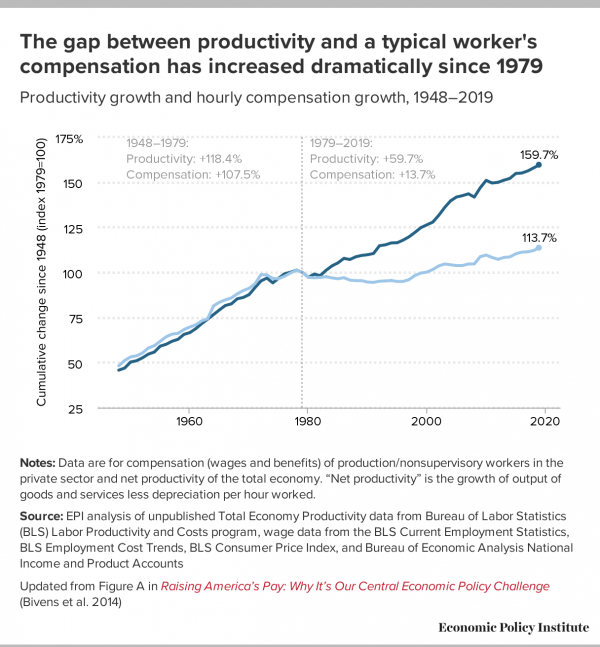
The starting point in the analysis below is net productivity measured at output prices since that is how statistical agencies measure productivity and it allows us to illustrate the difference between net productivity measured at consumer rather than output prices. Net productivity measured at output prices and a typical worker's compensation grew roughly in tandem over the 1948–1973 period, but strongly diverged thereafter and split entirely after 1979. Specifically, this measure of productivity grew 112.5% from 1948 to 1979 with a corresponding 90.2% growth in a worker's compensation. In contrast, productivity grew 85.1% (1.55% annually) further between 1979 and 2019, but a typical worker's compensation grew by only 13.2% (0.31% annually). Again, this calculation is for net productivity measured at output prices rather than consumer prices.
This divergence was first pointed out in the early 1990s (Mishel and Bernstein 1994) to demonstrate that stagnant wages for the typical worker over the previous decade or so could not be explained solely or even mainly by the slowdown of productivity growth. This section updates our 2015 analyses of the wedges between typical workers' pay and productivity and the decomposition of the main factors generating it, drawing on previous work (Mishel and Gee (2012) and the decomposition framework developed by the Centre for the Study of Living Standards: Sharpe, Arsenault, and Harrison 2008a; Sharpe, Arsenault, and Harrison 2008b; and Harrison 2009. This decomposition enables a breakdown of the productivity-pay divergence into the three wedges between compensation and productivity: (1) growing inequality of compensation; (2) the erosion of labor's share of income; and (3) the divergence of the growth of output prices (used to measure productivity) and consumer prices (used to measure worker compensation trends).
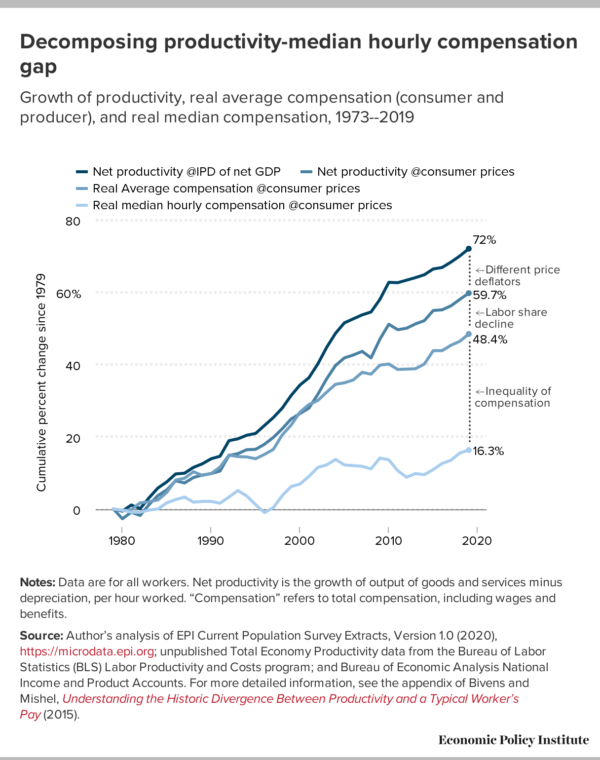
These three wedges are illustrated in Figure B. The first is the area between net productivity deflated by the implicit price deflator (output prices in net domestic product) and net productivity deflated by consumer prices (CPI-U-RS), which is labeled "net effective productivity." The second wedge is the gap between net effective productivity and average compensation (also deflated by consumer prices), reflecting changes in labor's share of income. The third wedge is the area between average compensation growth and median hourly compensation growth, which reflects growing inequality of compensation.
The top panel (A) in Table 1 below provides the basic trends required to compute the divergence and the wedges in each of the subperiods starting in 1973 and for the entire 1979-2019 period. The 1979-2019 period is chosen as the period for analysis (though there are data through 2020) since this is the period of rising inequality and 1979 and 2019 are both cyclical peaks (years of low unemployment) and therefore suitable for comparison. We compute the wedges between net productivity (productivity net of capital depreciation, which is a better metric of the income available from productivity growth than is gross productivity) in row 2 and median hourly compensation (wages and benefits) presented in row 6 but provide data on median wages and gross productivity for completeness. We shift to the compensation of the median worker rather than for nonsupervisory workers because data for the median worker are available starting in 1973 (the results are comparable, regardless of measure).
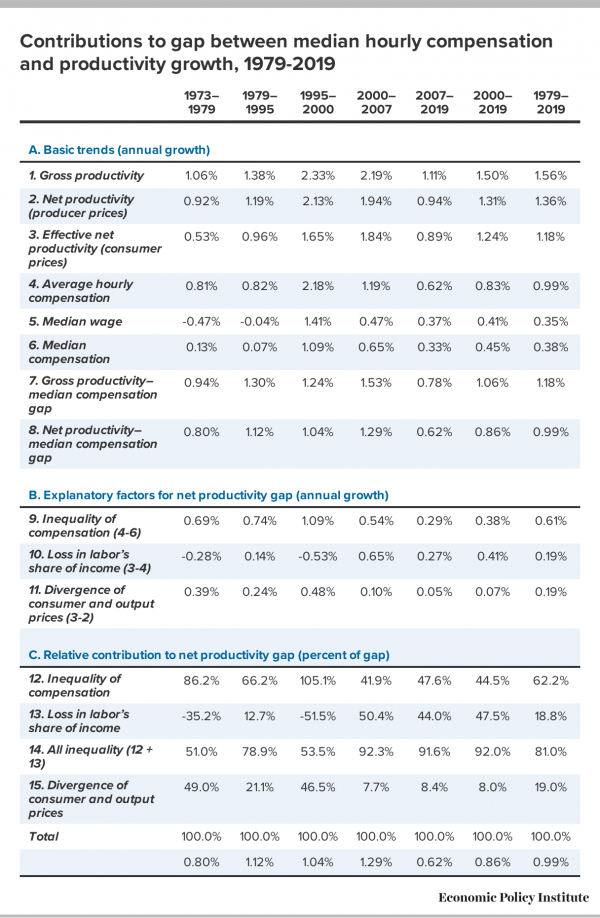
Over the 1979-2019 period, net productivity (row 7) grew 1.36% annually while median hourly compensation (row 2) grew just 0.38% annually, a sizeable divergence (row 8) of 0.99% each year. Panel B provides the annual impact of each of the three wedges (rounded to two decimals, with all calculations made using entire values) and the bottom panel shows the share of the net productivity-median hourly compensation growth gap that can be accounted for by each wedge.
The most important finding is that the gap between the growth of net productivity and median hourly compensation was primarily driven by factors associated with growing inequality—the decline of labor's share (especially since 2000) and the growing inequality of compensation, as shown in rows 9 and 10. These inequality factors together can explain 81.0% of the growth of the productivity–median hourly compensation gap (row 14) over the entire 1979-2019 period, with the remaining portion due to difference in the growth of producer (used to measure productivity) and consumer (used to measure compensation) prices (row 15). In the most recent period, from 2000 to 2019, the inequality factors together can explain 92.0% of the productivity-pay divergence (44.5% due to rising compensation inequality and 47.5% from the erosion of labor's share) and the difference in deflators was much less important (only 8.0%).
There is some controversy about whether the consumer–output price divergences should be included in analyses of the productivity-pay divergence. In this analysis we consciously sidestep this issue below by examining both net productivity and median hourly compensation adjusted for inflation by consumer prices (CPI-U-RS index) so their gap only captures the two inequality wedges. We label net productivity deflated by consumer prices as "net effective productivity" to indicate that its growth is readily available for consumption. That said, we are agnostic whether the output–consumer price divergences are simply a technical matter or reflect non-technical matters of political economy. There has not been serious research into what has caused these price divergences in the various subperiods presented in Table 1. In that regard, it is curious to us that rapid improvements in information equipment investment productivity, resulting in rapidly falling prices, have not seemed to flow through to consumers.
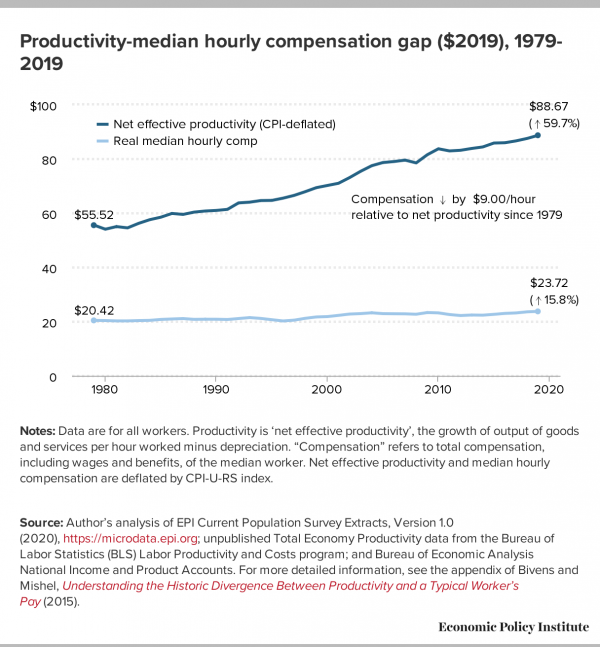
The net effective productivity–median hourly compensation divergence, exclusive of the price deflator differences, reflects the rising inequalities. Over 1979-2019, as noted earlier, net productivity grew 59.7% while median hourly compensation grew 15.8%, a 43.9 percentage point divergence. Net productivity, in other words, grew more than 3.5 times as fast as median hourly compensation. The compensation of the median worker would have risen 0.80 percentage points faster each year (summing rows 9 and 10) had median compensation not lagged net effective productivity. As shown in Figure C below, this resulted in a $9.00 loss in compensation for the median worker.
Figure C illustrates the increased net effective productivity–median hourly divergence in inflation-adjusted ($2019) dollars over the 1979-2019 period where both net effective productivity and median hourly compensation are inflation-adjusted with consumer prices (eliminating the consumer versus output price wedge). Median hourly compensation rose from $20.46 in 1979 to $23.72 in 2019, up 15.8%. However, if median hourly compensation had grown at the 59.7% pace of net effective productivity, then median hourly compensation would have reached $32.71, $9.00 higher than what was actually attained. In other words, rising inequality of compensation and the erosion of labor's income share over the 1979-2019 period cost the median worker $9.00 an hour.
The decline in labor's share of income
One of the trends that alerted analysts to the erosion of worker bargaining power and the corresponding strengthening of employer bargaining power in recent years is the erosion of labor's share of income in the 2000s (as shown in Table 1). These metrics reflect the shift in income shares for the whole economy, including the government and nonprofit sectors which have no profits. The distributional conflict between workers (labor) and employers (capital) is best examined in the corporate sector, where all income is divided between compensation going to workers and income accruing to owners of capital. Focusing on the corporate sector hence avoids issues of having to decide whether some other form of income—"proprietor's income," or income of noncorporate businesses—is labor or capital (see Bivens 2019 for measurement details) or the influence of trends in sectors which have no profits.
EPI's Nominal Wage Tracker provides data on the "workers' share of corporate income." The data clearly show a decline in labor's share in the 2000s. For example, labor's share fell from 82.4% in 2000 to 77.9% in 2007, the last year before the Great Recession. By 2016, when unemployment had reached levels comparable to what had prevailed in 2006 and 2007, it remained roughly 2.5 percentage points below its 2007 level, equivalent to an 8.4% across-the-board cut in compensation for every employee. Equivalently, it would require an across-the-board compensation boost of 9.1% to restore labor's share to its 2000 level.
This computation may exaggerate the impact of labor's falling share, since 2000 was a near historic high because of the lowest unemployment rate in decades (4.0%). However, the unemployment rate in 2018 and 2019 also averaged below 4.0%, and labor's share ended 2019 at 77.3%, well below 2000's level. This shift toward greater capital income and returns is even more impressive given that real interest rates have fallen sharply in recent years, a development that should (all else equal) be accompanied by a lower return to capital (Farhi and Gourio 2018).
Conclusion
In the 40 years since 1979, the net productivity growth vastly exceeded the growth of compensation for the median or typical worker. This was not the case in the 1948-1973 period. This productivity-pay divergence has been primarily driven by rising inequality, both the top 10% and especially the top 1% gained a much larger share of all compensation and labor's share of income eroded since 2000. In other words, the factors driving inequalities in the labor market are responsible for workers' inability to make gains commensurate with productivity growth.
Whether workers make wage gains commensurate with future productivity growth will depend on whether we prevent this ongoing, and eminently preventable, growth in wage inequality. These inequalities, in turn, are the consequence of conscious policy decisions made on behalf of the rich and corporations, as documented in Mishel and Bivens (2021), such as failing to achieve full employment, weakening unions, reducing labor standards, pursuing corporate globalization, employers imposing contract terms (such as noncompete agreements), and large firms using domestic outsourcing to redistribute wages and profits up from the supply chain. Public policies which restore worker power and balance in the labor market can provide robust, widely shared wage growth. What is broken is politics and policy, not the economy itself.
This work has benefitted from a long-term collaboration with EPI director of research Josh Bivens and data computations by EPI research assistant Jori Kandra.
-- via my feedly newsfeed

No comments:
Post a Comment