How the Clean Water Act has served the environment and the economy
David Keiser, Joseph S. Shapiro 24 October 2018
Over the last 20 years, the president or the Supreme Court of the US have restricted, reinstated, and then restricted again Clean Water Act protections for roughly half of US waters. Two Supreme Court decisions in the 2000s – SWANCC and Rapanos – removed the Clean Water Act's protection for wetlands, intermittent streams, and many other waters. The Obama administration's Waters of the United States Rule reinstated these protections, and a 2017 executive order by the Trump administration sought to revise or rescind this rule.
The 1972 Clean Water Act has a strong rationale. Before 1972, many US rivers were polluted to the extent that they would catch fire, and the 1969 fire on the Cuyahoga River in Cleveland, Ohio provided impetus for the passage of the Clean Water Act.
Despite this, the Clean Water Act has been controversial, for two reasons. First, there is no clear evidence that the Clean Water Act has decreased pollution, or even whether water pollution has fallen(Adler et al. 1993). Second, some argue that the Clean Water Act's costs have exceeded its benefits. These costs have exceeded $1 trillion in total (in 2014 dollars). That is more than $100 per person, per year.
Most analyses have concluded that the Clean Water Act's benefits are smaller than its costs. This includes studies by the Environmental Protection Agency (Lyon and Farrow 1995, Freeman 2000, USEPA 2000a, USEPA 2000b, Keiser et al. forthcoming). This contrasts with analyses of the Clean Air Act, which often find benefits much larger than its costs (USEPA 1997).
Analyses of the Clean Water Act have been hampered by three challenges:
- limited data on water quality,
- the difficulty of inferring values for clean water by observing human behaviour, and
- separating effects of the Clean Water Act from effects of other changes in policy and the economy.
We have tried to shed light on these controversies using the most comprehensive set of files on water pollution and its determinants in either academia or government (Keiser and Shapiro, forthcoming). These include 50 million water pollution readings from more than 240,000 monitoring sites in the continental US, from 1962 to 2001. Also we use detailed records on each of 35,000 grants the federal government gave cities in order to improve the treatment of municipal wastewater.
The analysis finds three sets of results.
Water pollution
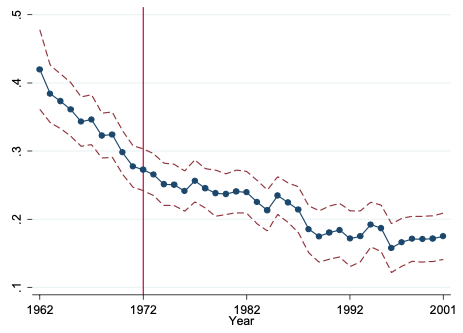
Most measures of water pollution declined between 1962 and 2001, though the rate of decline slowed over time. For example, the share of waters unsafe for fishing fell by about 12% between 1972 and 2001 (Figure 1).
Figure 1 Share of waters not fishable, 1962–2001

Source: Keiser and Shapiro (forthcoming).
Wastewater treatment
The analysis investigates the effect on water pollution of $650 billion in grants that the federal government gave cities to improve wastewater treatment plants. In most cities, sewage and other wastes flow through a network of underground pipes to a plant that treats the waste before discharging it to a river, lake, or other body of water. Upgrading these treatment plants so that ambient water pollution would decrease was a major goal of the Clean Water Act.
To measure the effects of these grants on pollution, our research compares pollution upstream of a treatment plant that received a grant to pollution downstream of the plant. We did this in years before and after the grant was received, and in plants receiving grants in early or late years.
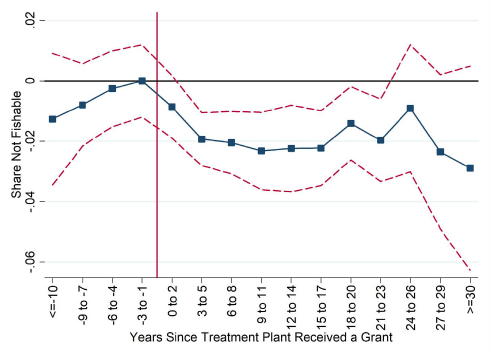
These grants substantially decreased water pollution. The average grant project, which cost around $30 million, decreased the probability that downstream waters were unsafe for fishing by about half a percentage point (Figure 2). This benefit extended about 25 miles downstream and lasted for about 30 years. The research also studies these grants' cost-effectiveness. It finds that, using these grants, it cost about $1.5 million per year to make one mile of a river safe for fishing.
Figure 2 The effects of Clean Water Act grants on share of waters not fishable

Source: Keiser and Shapiro (forthcoming).
Home values
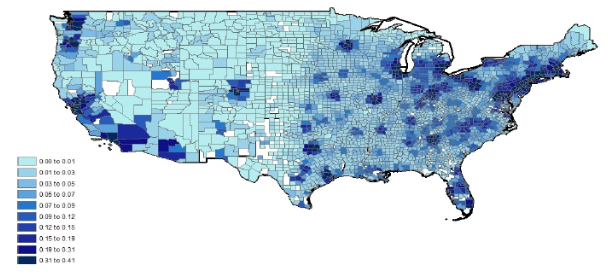
The analysis finds some evidence that these grants increased home values within a 25-mile radius around the waters that were cleaned up. The aggregate change in home values, however, was around one quarter of the total cost of these grants.
Figure 3 Ratio of change in housing values to grant costs by county

Source: Keiser and Shapiro (forthcoming).
There are several reasons why this ratio of measured benefits (change in home values) to costs of around 0.25 may understate the true benefit-cost ratio. People may inaccurately perceive the (especially health) benefits these grants provide. This ratio does not count benefits to people who live more than 25 miles away from the rivers, and it abstracts from changes in sewer fees and local taxes.
One interpretation is that the benefits of these Clean Water Act grants would exceed their costs if the benefits not captured in the housing market analysis exceeded the benefits captured here by a ratio of more than three-to-one. Current research is investigating whether existing analyses have underestimated the benefits of cleaning up rivers to this degree, for example by ignoring health benefits, and so whether the benefits of these investments are greater or less than their costs.
Policy implications
On one hand, Clean Water Act grants largely concluded by 1988. This new analysis stops in 2001, and the waters targeted by these Supreme Court and federal rules is far from a random sample, because they focus on wetlands and intermittent streams while the new analysis studies all rivers. In this sense, the new results do not directly measure any consequences of these current policy changes.
Nonetheless, there are two ways this work may inform current policy debates.
- The Clean Water Act has decreased US water pollution. This finding is clearest for pollutants that the Clean Water Act targeted, while the analysis finds less improvement in pollutants primarily from agricultural sources that the Clean Water Act traditionally has not regulated. Thus, removing Clean Water Act protections may increase US water pollution, particularly in areas with municipal and industrial discharges.
- The estimated change in home values due to Clean Water Act grants was smaller than the grants' costs (see Figure 3). This estimated ratio is larger for grants to more densely populated areas. The Clean Water Act, unlike the Clean Air Act, imposes similar water pollution regulations on most US surface waters. These findings are consistent with the idea that targeting water pollution regulations so that they focus on waters that are particularly important for social welfare could increase the ratio of benefits to costs of these regulations.
Efficient environmental policy balances the benefits and costs of pollution control. For policies such as air pollution regulation, available evidence suggests that the benefits of existing regulation justify its costs. For water quality regulation, available evidence is incomplete, but suggests that re-targeting environmental investments could at least improve their net social benefits.
References
Adler, R W, J C Landman, and D M Cameron (1993), The Clean Water Act 20 Years Later, NRDC.
Freeman, A M (2000), "Water Pollution Policy", chapter in Public Policies for Environmental Protection, RFF.
Keiser, D A, C L Kling, and J S Shapiro (forthcoming), "The low but uncertain measured benefits of US water quality policy", Proceedings of the National Academy of Sciences.
Keiser, D A and J S Shapiro (forthcoming), "Consequences of the Clean Water Act and the Demand for Water Quality", Quarterly Journal of Economics.
Lyon, R M and S Farrow (1995), "An Economic Analysis of Clean Water Act Issues", Water Resources Research 31: 213–223.
USEPA (1997), "The Benefits and Costs of the Clean Air Act, 1970 to 1990", USEPA discussion paper.
USEPA (2000a), A Benefits Assessment of Water Pollution Control Programs Since 1972: Part 1, The Benefits of Point Source Controls for Conventional Pollutants in Rivers and Streams: Final Report, USEPA.
USEPA (2000b), A Retrospective Assessment of the Costs of the Clean Water Act: 1972 to 1997: Final Report, USEPA.
Harpers Ferry, WV

No comments:
Post a Comment