The Red Caboose has sent you a link to a blog:
Blog: Enlighten Radio
Post: Talkin Socialism: What Socialista Say about Labor Day
Link: https://www.enlightenradio.org/2021/09/talkin-socialism-what-socialista-say.html
--
Powered by Blogger
https://www.blogger.com/
Friday, September 3, 2021
Growing inequalities, reflecting growing employer power, have generated a productivity–pay gap since 1979: Productivity has grown 3.5 times as much as pay for the typical worker [feedly]
In the quest for economic justice, as in "fair wages" or "fair trade", PRODUCTIVITY is an important and, as it turns out, rather profound practical and theoretical challenge. In the universe of physical commodities, it is arguably the best objective measure of the labor component in the "value" of a product produced solely for exchange, meaning 'sale', instead of personal use or gift..
In labor contract negotiations, for example, our union frequently sought to resolve wage disputes by asking to see the unit labor costs for the duration of the past contract. Unit labor cost was defined simply as the product sales divided by the average per hour direct labor bill, comparable to a "firm" productivity measure. The companies usually declined to provide that information on grounds of "confidentiality in proprietary corporate processes". This led, of course, to union distrust of company claims of being unable to afford union proposed wage rates and benefits.
Current measures of productivity, however, fail to capture the objectivity, or thus accuracy, reflected in the price/wage ratios of physical commodities, when measuring services (where only labor is exchanged) -- especially public services. The product is no longer homogenous, but variable with the human capital deployed: a lawyer, a cleaning service, etc. The failure is even more obvious in measuring intangibles (software, etc). Amazon, for example, cannot say for certain what the value add of its Amazon Web Services division -- the largest cloud hosting service -- really is. Yet Bezos chose its leader as his replacement CEO.
As physical production grows more and more automated, services and intangibles begin to consume a bigger and bigger share of GNP, and the workforce. A key value proposition of capitalism is simultaneously becoming more difficult to define. A new chapter, perhaps, in the labor theory of value: "we think its getting bigger, but cannot define how much".
https://www.epi.org/blog/growing-inequalities-reflecting-growing-employer-power-have-generated-a-productivity-pay-gap-since-1979-productivity-has-grown-3-5-times-as-much-as-pay-for-the-typical-worker/
Key takeaways:
- Productivity and pay once climbed together. But in recent decades, productivity and pay have diverged: Net productivity grew 59.7% from 1979-2019 while a typical worker's compensation grew by 15.8%, according to EPI data released ahead of Labor Day.
- If median hourly compensation had grown at the same rate as productivity over the 1979-2019 period, the median worker would be making $9.00 more per hour.
- This divergence has been primarily driven by intentional policy choices creating rising inequality: both the top 10% and especially the top 1% and top 0.1% gained a much larger share of all compensation and labor's share of income eroded.
- Public policies which restore worker power and balance in the labor market can provide robust, widely shared wage growth.
The growth of inequalities is the central driver of the widening gap between the hourly compensation of a typical (median) worker and productivity—the income generated per hour of work—in recent decades. Specifically, this growing divergence has been driven by the growth of two distinct dimensions of inequality: the surge of compensation received by the top 10%—particularly the top 1.0% and top 0.1%—and the erosion of labor's share of income and the corresponding growth of capital's share. This post documents these trends by presenting an updated account of the U.S. productivity-pay divergence originally analyzed in both Mishel and Gee 2012 and Bivens and Mishel 2015.
The key metric, as explained below, is the lag between the growth of net productivity (taking into account depreciation and evaluated using consumer prices) and hourly compensation (wages and benefits) of a typical or median worker. Between 1979 and 2019, net productivity grew 59.7% while a typical (median) worker's compensation grew by 15.8%, a 43.9 percentage point divergence driven by inequality. The effects have been felt broadly: During this period, 90% of U.S. workers experienced wage growth (26%) far slower than the economywide average, while workers in the top 1% (mostly highly credentialed professionals and corporate managers) saw 160% wage growth (Mishel and Kandra 2020) and owners of capital reaped large rewards made possible only by this anemic wage growth for the bottom 90%.
This divergence between net productivity and a typical worker's compensation means that neither slow productivity growth nor inevitable economic forces can explain the poor wage growth of America's workers. In fact, wage problems are a "failure by design" (Bivens 2010), engineered by those with the most wealth and power. The dynamics are primarily located in the labor market and the strengthening of employers' power relative to their rank-and-file workforce (which increasingly includes those workers with a four-year college degree). As Mishel and Bivens (2021) recently documented, wage suppression was generated by policy choices that resulted in excessive unemployment, eroded unionization, corporate globalization, lower labor standards (e.g., lower minimum wage), new imposed contract terms (e.g., noncompetes), and corporate structures changes that pushed down wages and profits in supply chains to the benefit of large firms.
The gap between productivity and median hourly compensation growth
The last four decades have seen a systematic divergence between the growth of economywide productivity and the growth of hourly compensation (wages and benefits) for typical workers. We proxy the wages of "typical" workers as either wages for nonsupervisory workers (roughly 80% of the private-sector workforce) or wages for the worker earning the median wage. As a starting point, we compare this to the growth of net productivity for the entire economy (rather than only nonfarm businesses or any subset of the economy).
Figure A below shows the growth of net productivity (gross productivity minus depreciation) adjusted for inflation according to consumer prices (rather than inflation in all types of output including investment goods and government), which is labeled 'effective productivity' as it is available for household consumption. Figure A compares this growth with the typical worker's hourly compensation since 1948, using the hourly compensation of production/nonsupervisory workers because that is the only series available for the entire period since 1948 (it corresponds closely to median wage growth). Further detail on the underlying data and measurement issues can be found on the newly expanded EPI page providing information on the productivity-pay gap.
Figure A
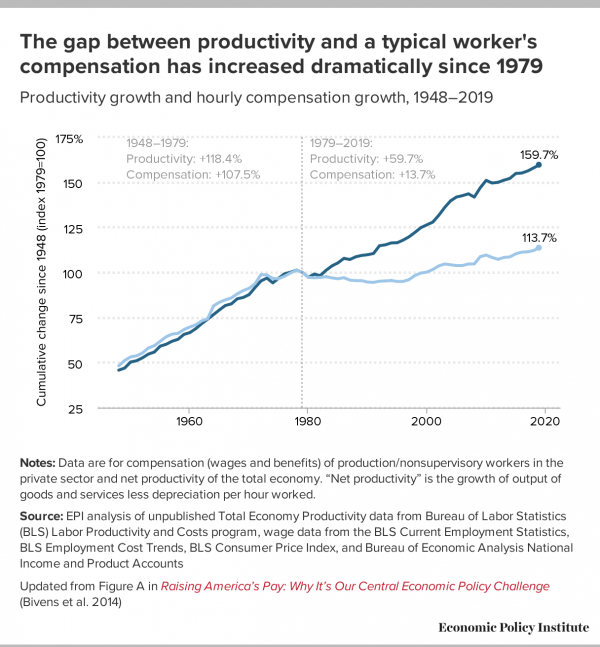
The starting point in the analysis below is net productivity measured at output prices since that is how statistical agencies measure productivity and it allows us to illustrate the difference between net productivity measured at consumer rather than output prices. Net productivity measured at output prices and a typical worker's compensation grew roughly in tandem over the 1948–1973 period, but strongly diverged thereafter and split entirely after 1979. Specifically, this measure of productivity grew 112.5% from 1948 to 1979 with a corresponding 90.2% growth in a worker's compensation. In contrast, productivity grew 85.1% (1.55% annually) further between 1979 and 2019, but a typical worker's compensation grew by only 13.2% (0.31% annually). Again, this calculation is for net productivity measured at output prices rather than consumer prices.
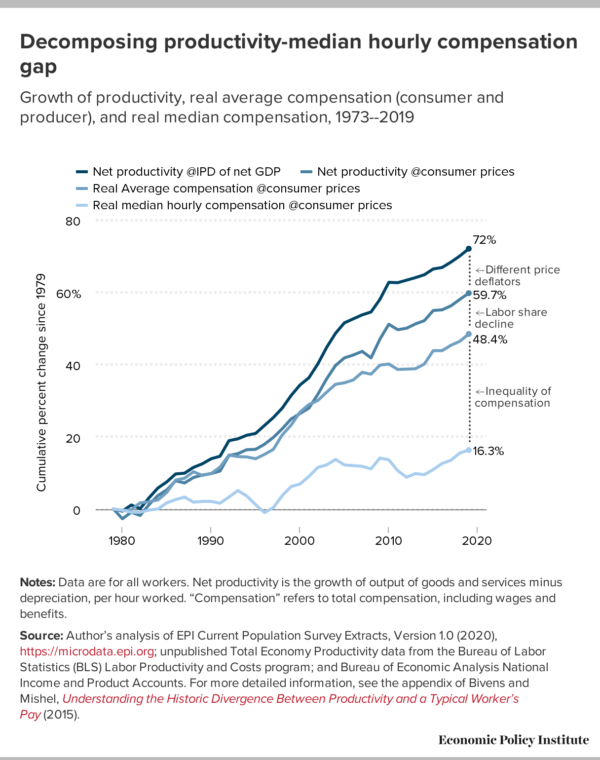
This divergence was first pointed out in the early 1990s (Mishel and Bernstein 1994) to demonstrate that stagnant wages for the typical worker over the previous decade or so could not be explained solely or even mainly by the slowdown of productivity growth. This section updates our 2015 analyses of the wedges between typical workers' pay and productivity and the decomposition of the main factors generating it, drawing on previous work (Mishel and Gee (2012) and the decomposition framework developed by the Centre for the Study of Living Standards: Sharpe, Arsenault, and Harrison 2008a; Sharpe, Arsenault, and Harrison 2008b; and Harrison 2009. This decomposition enables a breakdown of the productivity-pay divergence into the three wedges between compensation and productivity: (1) growing inequality of compensation; (2) the erosion of labor's share of income; and (3) the divergence of the growth of output prices (used to measure productivity) and consumer prices (used to measure worker compensation trends).
These three wedges are illustrated in Figure B. The first is the area between net productivity deflated by the implicit price deflator (output prices in net domestic product) and net productivity deflated by consumer prices (CPI-U-RS), which is labeled "net effective productivity." The second wedge is the gap between net effective productivity and average compensation (also deflated by consumer prices), reflecting changes in labor's share of income. The third wedge is the area between average compensation growth and median hourly compensation growth, which reflects growing inequality of compensation.
Figure B
The top panel (A) in Table 1 below provides the basic trends required to compute the divergence and the wedges in each of the subperiods starting in 1973 and for the entire 1979-2019 period. The 1979-2019 period is chosen as the period for analysis (though there are data through 2020) since this is the period of rising inequality and 1979 and 2019 are both cyclical peaks (years of low unemployment) and therefore suitable for comparison. We compute the wedges between net productivity (productivity net of capital depreciation, which is a better metric of the income available from productivity growth than is gross productivity) in row 2 and median hourly compensation (wages and benefits) presented in row 6 but provide data on median wages and gross productivity for completeness. We shift to the compensation of the median worker rather than for nonsupervisory workers because data for the median worker are available starting in 1973 (the results are comparable, regardless of measure).
Table 1
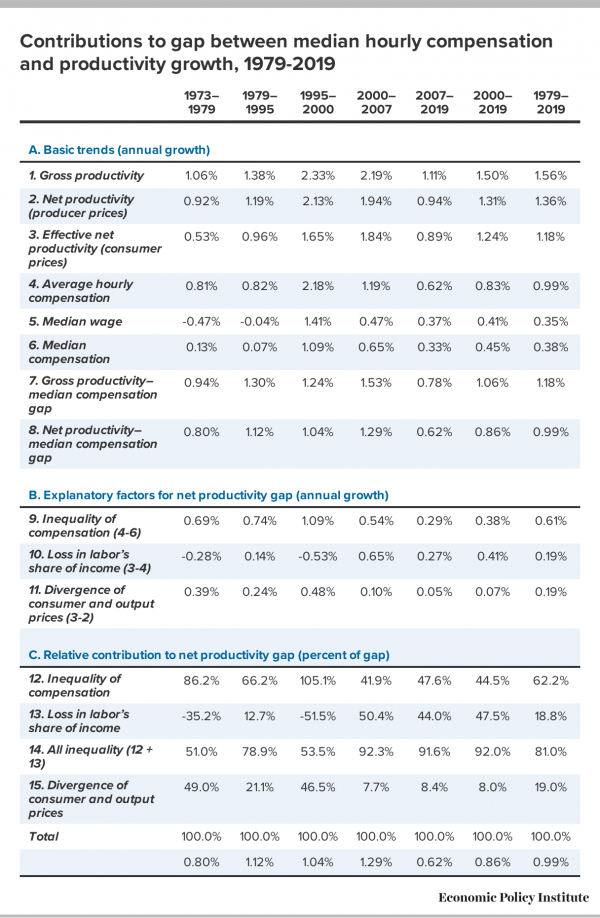
Over the 1979-2019 period, net productivity (row 7) grew 1.36% annually while median hourly compensation (row 2) grew just 0.38% annually, a sizeable divergence (row 8) of 0.99% each year. Panel B provides the annual impact of each of the three wedges (rounded to two decimals, with all calculations made using entire values) and the bottom panel shows the share of the net productivity-median hourly compensation growth gap that can be accounted for by each wedge.
The most important finding is that the gap between the growth of net productivity and median hourly compensation was primarily driven by factors associated with growing inequality—the decline of labor's share (especially since 2000) and the growing inequality of compensation, as shown in rows 9 and 10. These inequality factors together can explain 81.0% of the growth of the productivity–median hourly compensation gap (row 14) over the entire 1979-2019 period, with the remaining portion due to difference in the growth of producer (used to measure productivity) and consumer (used to measure compensation) prices (row 15). In the most recent period, from 2000 to 2019, the inequality factors together can explain 92.0% of the productivity-pay divergence (44.5% due to rising compensation inequality and 47.5% from the erosion of labor's share) and the difference in deflators was much less important (only 8.0%).
There is some controversy about whether the consumer–output price divergences should be included in analyses of the productivity-pay divergence. In this analysis we consciously sidestep this issue below by examining both net productivity and median hourly compensation adjusted for inflation by consumer prices (CPI-U-RS index) so their gap only captures the two inequality wedges. We label net productivity deflated by consumer prices as "net effective productivity" to indicate that its growth is readily available for consumption. That said, we are agnostic whether the output–consumer price divergences are simply a technical matter or reflect non-technical matters of political economy. There has not been serious research into what has caused these price divergences in the various subperiods presented in Table 1. In that regard, it is curious to us that rapid improvements in information equipment investment productivity, resulting in rapidly falling prices, have not seemed to flow through to consumers.
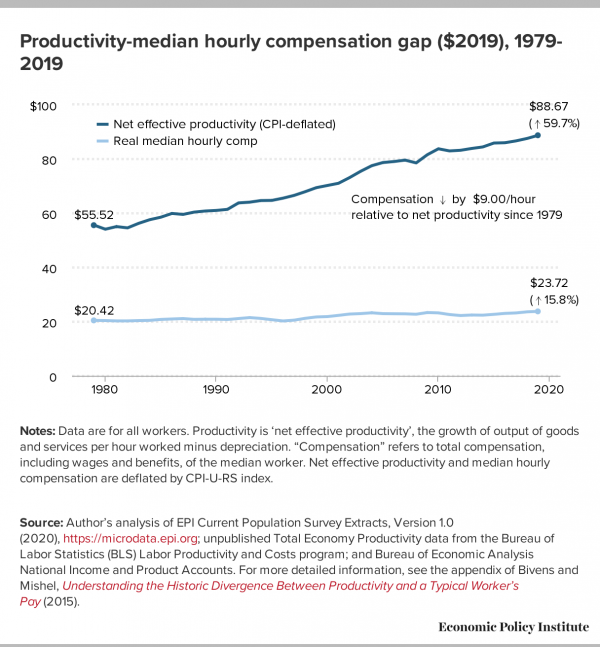
The net effective productivity–median hourly compensation divergence, exclusive of the price deflator differences, reflects the rising inequalities. Over 1979-2019, as noted earlier, net productivity grew 59.7% while median hourly compensation grew 15.8%, a 43.9 percentage point divergence. Net productivity, in other words, grew more than 3.5 times as fast as median hourly compensation. The compensation of the median worker would have risen 0.80 percentage points faster each year (summing rows 9 and 10) had median compensation not lagged net effective productivity. As shown in Figure C below, this resulted in a $9.00 loss in compensation for the median worker.
Figure C illustrates the increased net effective productivity–median hourly divergence in inflation-adjusted ($2019) dollars over the 1979-2019 period where both net effective productivity and median hourly compensation are inflation-adjusted with consumer prices (eliminating the consumer versus output price wedge). Median hourly compensation rose from $20.46 in 1979 to $23.72 in 2019, up 15.8%. However, if median hourly compensation had grown at the 59.7% pace of net effective productivity, then median hourly compensation would have reached $32.71, $9.00 higher than what was actually attained. In other words, rising inequality of compensation and the erosion of labor's income share over the 1979-2019 period cost the median worker $9.00 an hour.
Figure C
The decline in labor's share of income
One of the trends that alerted analysts to the erosion of worker bargaining power and the corresponding strengthening of employer bargaining power in recent years is the erosion of labor's share of income in the 2000s (as shown in Table 1). These metrics reflect the shift in income shares for the whole economy, including the government and nonprofit sectors which have no profits. The distributional conflict between workers (labor) and employers (capital) is best examined in the corporate sector, where all income is divided between compensation going to workers and income accruing to owners of capital. Focusing on the corporate sector hence avoids issues of having to decide whether some other form of income—"proprietor's income," or income of noncorporate businesses—is labor or capital (see Bivens 2019 for measurement details) or the influence of trends in sectors which have no profits.
EPI's Nominal Wage Tracker provides data on the "workers' share of corporate income." The data clearly show a decline in labor's share in the 2000s. For example, labor's share fell from 82.4% in 2000 to 77.9% in 2007, the last year before the Great Recession. By 2016, when unemployment had reached levels comparable to what had prevailed in 2006 and 2007, it remained roughly 2.5 percentage points below its 2007 level, equivalent to an 8.4% across-the-board cut in compensation for every employee. Equivalently, it would require an across-the-board compensation boost of 9.1% to restore labor's share to its 2000 level.
This computation may exaggerate the impact of labor's falling share, since 2000 was a near historic high because of the lowest unemployment rate in decades (4.0%). However, the unemployment rate in 2018 and 2019 also averaged below 4.0%, and labor's share ended 2019 at 77.3%, well below 2000's level. This shift toward greater capital income and returns is even more impressive given that real interest rates have fallen sharply in recent years, a development that should (all else equal) be accompanied by a lower return to capital (Farhi and Gourio 2018).
Conclusion
In the 40 years since 1979, the net productivity growth vastly exceeded the growth of compensation for the median or typical worker. This was not the case in the 1948-1973 period. This productivity-pay divergence has been primarily driven by rising inequality, both the top 10% and especially the top 1% gained a much larger share of all compensation and labor's share of income eroded since 2000. In other words, the factors driving inequalities in the labor market are responsible for workers' inability to make gains commensurate with productivity growth.
Whether workers make wage gains commensurate with future productivity growth will depend on whether we prevent this ongoing, and eminently preventable, growth in wage inequality. These inequalities, in turn, are the consequence of conscious policy decisions made on behalf of the rich and corporations, as documented in Mishel and Bivens (2021), such as failing to achieve full employment, weakening unions, reducing labor standards, pursuing corporate globalization, employers imposing contract terms (such as noncompete agreements), and large firms using domestic outsourcing to redistribute wages and profits up from the supply chain. Public policies which restore worker power and balance in the labor market can provide robust, widely shared wage growth. What is broken is politics and policy, not the economy itself.
This work has benefitted from a long-term collaboration with EPI director of research Josh Bivens and data computations by EPI research assistant Jori Kandra.
-- via my feedly newsfeed
Thursday, September 2, 2021
China plans to bolster transport link with ASEAN, BRI countries and regions [feedly]
China plans to bolster transport link with ASEAN, BRI countries and regions
https://www.globaltimes.cn/page/202109/1233147.shtml
https://www.globaltimes.cn/page/202109/1233147.shtml
China's top economic planner said on Thursday that the country aims to finish building the New International Land-Sea Trade Corridor by 2025, a logistics channel that would facilitate trade with ASEAN members as well as countries and regions along the China-proposed Belt and Road Initiative (BRI).
In a document issued on Thursday, the National Development and Reform Commission (NDRC) said the corridor would be efficient, convenient, green and safe. The move is crucial as such a massive transport link has become increasingly significant since the coronavirus disrupted global supply chains and the movement of trade.
The plan covers major road, railway and port projects. Specifically, it aims to increase the capacity of rail-sea combined transport to 500,000 twenty-foot equivalent units and the number of cross-border freight trains to 2,000.
In 2020, 4,607 trains of the rail-sea combined transport mode and 1,264 China-Vietnam cross-border freight trains were dispatched, up 105 percent and 23.2 percent year-on-year.
Beibu Gulf Port in South China's Guangxi Zhuang Autonomous Region has opened 52 shipping routes and the Yangpu Port in South China's Hainan Province has opened 33 routes, reaching more than 100 countries and regions.
The strategy of building the New International Land-Sea Trade Corridor is closely linked to the BRI, the Yangtze River Economic Belt and the Guangdong-Hong Kong-Macao Greater Bay Area, Zhou Xiaoqi, an official with the NDRC, told a press conference on Thursday.
"In addition, once goods can go from Southwest China to the southern part or the Yangtze River direction, the corridor could reduce the navigation capacity burden of the Three Gorges Dam and provide more options for shipping goods," Zhou said.
In terms of facilitating inspection and quarantine at customs, an official with the customs authority said that after negotiating with ASEAN members, China has established a digital review mechanism for seafood imports from Vietnam and fruit imports from Thailand faster and more conveniently.
-- via my feedly newsfeed
Thursday, August 26, 2021
US jobless claims climb for first time in 5 weeks, to 353,000 [feedly]
US jobless claims climb for first time in 5 weeks, to 353,000
https://www.businessinsider.com/weekly-jobless-claims-353000-unemployment-insurance-benefits-filings-labor-market-2021-8?utm_source=feedly&utm_medium=webfeeds
-- via my feedly newsfeed
https://www.businessinsider.com/weekly-jobless-claims-353000-unemployment-insurance-benefits-filings-labor-market-2021-8?utm_source=feedly&utm_medium=webfeeds
People line up outside Kentucky Career Center prior to its opening to find assistance with their unemployment claims in Frankfort, Kentucky, U.S. June 18, 2020.
Bryan Woolston/Reuters
- US jobless claims jumped to 353,000 last week, just above pandemic lows but the first increase in five weeks.
- Economists had expected claims to rise slightly to 350,000.
- Continuing claims fell to 2.86 million, but fell short of the 2.76 million claims estimate.
- See more stories on Insider's business page.
Filings for unemployment insurance jumped from pandemic-era lows last week as the country crept closer to the expiration of federal UI aid.
Weekly jobless claims reached an unadjusted 353,000 last week, the Labor Department announced Thursday morning. That compares to a median estimate of 350,000 claims from economists surveyed by Bloomberg.
The print interrupts four straight weeks of declines. The previous week's count was revised to 349,000 from 348,000 and still marks the lowest reading since the pandemic drove claims higher.
Continuing claims, which count Americans actively receiving unemployment benefits, fell to 2.86 million for the week that ended August 14. That missed the median estimate of 2.76 million claims. Continuing claims set a pandemic low that week and have generally declined more consistently than weekly claims.
While claims sit far lower than they did just months ago, they remain nearly twice their pre-pandemic levels. Weekly counts have been among the most closely watched indicators of the labor market's recovery, despite their volatile nature.
The latest reading also comes mere weeks before the federal boost to UI lapses. A handful of programs created by Congress have augmented weekly benefits payouts since the pandemic began early last year, but they're set to expire in September. The Biden administration reiterated earlier this month it would let the programs expire, and Democrats are unlikely to extend the benefit further.
Twenty-six states announced plans to prematurely slash the benefit, with many arguing the move would push more jobless Americans into the workforce.
Yet a new study suggests the early cuts did more harm than good. Researchers at University of Massachusetts Amherst, Harvard University, Columbia University, and University of Toronto found the reduction of benefits drove a 20% drop in recipients' weekly spending and did little to improve hiring, with only 4.4% more workers in early-out states taking jobs compared to peers in states that kept benefits.
"Clearly, if it had been the case that more people losing benefits were easily able to transition into paid work, you wouldn't see that sort of reduction and sharp reduction in spending, but that's what you saw," Arindrajit Dube, an economics professor at UMass Amherst and of the paper's authors, told Insider's Juliana Kaplan.
The Brookings Institute joined some Democrats and millions of unemployed Americans on Wednesday in arguing for an extention of the federal support. There is little evidence the boosted benefits are behind the labor shortage, Annelies Goger, a fellow at Brookings' Metropolitan Policy Program, said in a report. The premature cutoff also stands to worsen economic inequality at a time when the recession's fallout is already extremely uneven, she added.
"This return to 'normalcy' will penalize many of the workers who the pandemic impacted most severely," Goger said.
Read the original article on Business Insider
-- via my feedly newsfeed
Wednesday, August 25, 2021
75 doctors from South Florida hospitals staged a walkout to protest a surge in unvaccinated COVID-19 patients [feedly]
Hey boss -- there are no replacements
https://www.businessinsider.com/florida-doctors-walkout-unvaccinated-patients-surge-2021-8?utm_source=feedly&utm_medium=webfeeds
South Florida doctors took part in a walkout to protest a surge in unvaccinated patients.
-- via my feedly newsfeed
- About 75 doctors from hospitals in South Florida took part in a walkout Monday.
- The doctors wanted to draw attention to a surge in unvaccinated COVID-19 patients.
- Florida recorded nearly 150,000 new coronavirus cases in the past week.
- See more stories on Insider's business page.
Dozens of South Florida doctors staged a symbolic walkout of a hospital in Palm Beach Gardens on Monday to protest a surge in unvaccinated COVID-19 patients, according to local reports.
WPTV reported that about 75 doctors - from numerous hospitals and offices - took part in the walkout. Some even took breaks from their shifts to participate, MSNBC reported.
Florida is experiencing the largest COVID-19 outbreak in the nation, having reported nearly 150,000 new cases in the past week alone, according to Monday data from the Centers for Disease Control and Prevention.
Hospitals in the state are at 84.6% capacity, according to the Department of Health and Human Services. Only a little over half of the state's population - 51.6% - is fully vaccinated against the coronavirus, according to data from the Mayo Clinic.
The doctors who took part in Monday's walkout said the vast majority of the cases they're seeing most recently were among unvaccinated patients, many of whom have expressed regret about not having been vaccinated, WPTV reported.
They decided to stage the walkout to draw attention to the crisis and to call on more people to get vaccinated.
"We are exhausted. Our patience and resources are running low and we need your help," Dr. Rupesh Dharia from Palm Beach Internal Medicine told WFLA.
"The vaccine still remains the most effective and reliable way to stop this madness," Dr. Leslie Diaz, an infectious-disease specialist, told WFLA.
The protest came on the same day the Pfizer-BioNTech vaccine gained full approval from the Food and Drug Administration.
Vaccines from Moderna and Johnson & Johnson are also available in the US, still under the FDA's emergency-use authorization. All three have been shown to be highly effective at preventing severe infection, hospitalization, and death from COVID-19.
Read the original article on Business Insider
-- via my feedly newsfeed
Monday, August 23, 2021
PK: Honey, Who Shrunk the World? [feedly]
Krugman has a weakness: when the explanations for phenomena are reduced to fundamentals of capitalism, or class war, PK looks for an ideological, not systematic, answer. But his history of trade and its components is fascinating -- he is an expert.
https://www.nytimes.com/2021/08/20/opinion/us-globalization-tariffs.html
Paul Krugman
This is a preview of the Paul Krugman newsletter, which is now reserved for Times subscribers. Sign up to get it in your inbox twice a week.
When I was in my 30s, my parents gave me a sweatshirt bearing the words "Global shmobal." At the time, I was going to many economics conferences; when my parents would ask me what the latest conference was about, I apparently always replied, "Global shmobal."
What I didn't know at the time was that the global was about to get even shmobaler. In the mid-1980s, world trade had recovered from the disruptions and protectionism of the interwar period, but exports as a share of world G.D.P. were still back only to around their level in 1913. Starting around 1988, however, there was a huge surge in trade — sometimes referred to as hyperglobalization — that leveled off around 2008 but left the world's economies much more integrated than ever before:
Image
Exports as percentage of world G.D.P.Credit...World Bank
This tight integration has played an important background role in pandemic economics. Vaccine production is very much an international enterprise, with production of each major vaccine relying on inputs from multiple nations. On the downside, our reliance on global supply chains has introduced forms of economic risk: One factor in recent inflation has been a worldwide shortage of shipping containers.
ADVERTISEMENT
Continue reading the main story
But how did we get so globalized? There are, it seems to me, two main narratives out there.
One narrative stresses the role of technology, especially the rise of containerized shipping (which is why the box shortage is a big deal). As the work of David Hummels, maybe the leading expert on this subject, points out, there has also been a large decline in the cost of air transport, which is a surprisingly big factor: Only a tiny fraction of the tonnage that crosses borders goes by air, but air-shipped goods are, of course, much higher value per pound than those sent by water, so airplanes carry around 30 percent of the value of world trade.
By the way, pharmaceuticals, presumably including Covid-19 vaccine ingredients, are mainly shipped by air:
Image
This is what it looks like when drugs fly.Credit...Brookings
An alternative narrative, however, places less weight on technology than on policy. That's the narrative one often sees associated with Trumpists (although they're not the only ones with something like this view): Globalists pushed to open our borders to imports, and that's why foreign goods have flooded into our economy.
And the truth is that from the 1930s up to Donald Trump, the U.S. government did, in fact, pursue a strategy of negotiating reductions in tariffs and other barriers to trade, in the belief that more trade would both foster economic growth and, by creating productive interdependence among nations, promote world peace.
But the long-run push toward more open trade on the part of the United States and other advanced economies mostly took place before hyperglobalization; tariffs were already very low by the 1980s:
Image
Tariffs over time.Credit...USITC
While there weren't big changes in the policies of advanced economies, however, there was a trade policy revolution in emerging markets, which had high rates of protection in the early 1980s, then drastically liberalized. Here's the World Bank estimate of average tariffs in low and middle-income countries:
Image
Average tariffs in low- and middle-income nations.Credit...World Bank
You might ask why a reduction in emerging-market tariffs — taxes on imports — should lead to a surge in emerging-market exports. So let's talk about the Lerner symmetry theorem — or, actually, let's not and just say that tariffs eventually reduce exports as well as imports, typically by leading to an overvalued currency that makes exporters less competitive. And conversely, slashing tariffs leads to more exports. Basically, nations can choose to be inward-looking, trying to develop by producing for the domestic market, or outward-looking, trying to develop by selling to the rest of the world.
What happened in much of the developing world during the era of hyperglobalization was a drastic turn toward outward-looking policies. What caused that trade policy revolution and hence helped cause hyperglobalization itself?
The immediate answer, which may surprise you, is that it was basically driven by ideas.
For more than a generation after World War II, it was widely accepted, even among mainstream economists and at organizations like the World Bank, that nations in the early stages of development should pursue import-substituting industrialization: building up manufacturing behind tariff barriers until it was mature enough to compete on world markets.
By the 1970s, however, there was broad disillusionment with this strategy, as observers noted the disappointing results of I.S.I. (yes, it was so common that economists routinely used the abbreviation) and as people began to notice export-oriented success stories like South Korea and Taiwan.
So orthodoxy shifted to a much more free-trade set of ideas, the famous Washington Consensus. (Catherine Rampell suggests that should be the new name for D.C.'s football team. Nerds of the world, unite!) The new orthodoxy also delivered its share of disappointments, but that's a story for another time. The important point, for now, is that the change in economic ideology led to a radical change in policy, which played an important role in surging world trade: We wouldn't be importing all those goods from low-wage countries if those countries were still, like India and Mexico in the 1970s, inward-looking economies living behind high tariff walls.
There are, I think, two morals from this story.
First, ideas matter. Maybe not as much as John Maynard Keynes suggested when he asserted that "it is ideas, not vested interests, which are dangerous for good or evil," but they can have huge effects.
Second, it's a corrective against American hubris. We still tend, far too often, to imagine that we can shape the world as we like. But those days are long gone, if they ever existed. Hyperglobalization was made in Beijing, New Delhi and Mexico City, not in D.C.
The Times is committed to publishing a diversity of letters to the editor. We'd like to hear what you think about this or any of our articles. Here are some tips. And here's our email: letters@nytimes.com.
Follow The New York Times Opinion section on Facebook, Twitter (@NYTopinion) and Instagram.
Paul Krugman has been an Opinion columnist since 2000 and is also a Distinguished Professor at the City University of New York Graduate Center. He won the 2008 Nobel Memorial Prize in Economic Sciences for his work on international trade and economic geography.
-- via my feedly newsfeed
Sunday, August 22, 2021
PK: The Bad Economics of Fossil Fuel Defenders [feedly]
The Bad Economics of Fossil Fuel Defenders
Paul Krugman
https://www.nytimes.com/2021/08/16/opinion/climate-change-republicans-economy.html
Global warming is fake news. Anyway, it isn't man-made. And doing anything about it would destroy the economy.
Opponents of action against climate change have always relied on multiple lines of defense: If one argument for doing nothing becomes unsustainable, they just retreat to another.
That's what we're seeing now, as conservatives argue against the Biden administration's push for climate-friendly public investment. As it happens, this push is taking place against a background of unprecedented heat waves, huge forest fires, severe drought in some places and catastrophic flooding in others — phenomena that scientists have long warned would become more common as the planet gets hotter.
Given these events, as The Times recently reported, Republicans have toned down their climate denial — in some cases pretending that they never denied the science in the first place. Thus Senator James Inhofe, the author of 2012's "The Greatest Hoax: How the Global Warming Conspiracy Threatens Your Future," is now claiming that he never called climate change a hoax.
ADVERTISEMENT
Continue reading the main story
If experience is any guide, this new willingness to accept the reality of global warming won't last; the next time America has a cold snap, the usual suspects will go right back to denying climate change and attacking scientists. For now, however, they're focused on the immense economic damage that they claim will result if we try to limit emissions of greenhouse gases.
So let me offer four reasons not to believe a word they say on this subject.
First, the U.S. economy has consistently done better under Democratic presidents than under Republican presidents — a pattern so strong that even progressive economists admit that it's puzzling. Whatever the cause of this partisan disparity, a party devoted to the zombie doctrine that tax cuts solve all problems has no standing to lecture us on what's good for the economy.
Second, there is a remarkable inconsistency between conservatives' expressed faith in the power of private initiative and their assertion that climate policies will paralyze the economy. Businesses, the right likes to tell us, are engines of innovation and adaptation, rising to meet any challenge. Yet somehow the same people who laud private-sector creativity insist that businesses will shrivel up and die if confronted with new regulations or emission fees.
In fact, a number of studies have shown that government projections of the effects of new environmental or safety regulations consistently overestimate their costs, precisely because businesses respond to new rules and incentives by innovating, finding ways to reduce compliance costs. And industry projections of the adverse effects of regulation are far worse, typically overstating the costs to a ludicrous degree.
Third, history strongly refutes the notion that there's any necessary link between economic growth and greenhouse gas emissions.
Editors' Picks
The Wonders That Live at the Very Bottom of the Sea
Last Stop on the Way to the Cosmos? No Thanks.
Tony Mendez, David Letterman's Oddball 'Cue Card Boy,' Dies at 76
Continue reading the main story
ADVERTISEMENT
Continue reading the main story
Consider the case of Britain, where modern economic growth began. British emissions of carbon dioxide have been falling for half a century, despite a growing economy. On a per-capita basis, Britain's CO₂ emissions are back down to what they were in the '50s — the 1850s, when real G.D.P. per person was only about one-ninth what it is today.
Finally, Republican insistence that we must remain dependent on fossil fuels is especially strange, given huge technological progress in renewable energy — progress so remarkable that the Trump administration tried to force power companies to keep using coal, which is no longer competitive on cost. Improved technology means that climate action looks far easier now than it did in, say, 2008, when John McCain called for a cap on greenhouse gas emissions, a position that would be disqualifying for anyone seeking the Republican presidential nomination today.
Of course, these facts won't change Republican minds. It's painfully obvious that politicians opposing climate action aren't arguing in good faith; they've effectively decided to block any and all measures to ward off disaster and will use whatever excuses they can find to justify their position.
Why has the G.O.P. become the party of pollution? I used to think that it was mainly about money; in the 2020 election cycle Republicans received 84 percent of political contributions from the oil and gas industry and 96 percent of contributions from coal mining.
And money is surely part of the story. But I now think there's more to it than that. Like pandemic policy, where the G.O.P. has effectively allied itself with the coronavirus, climate policy has become a front in the culture war; there's a sense on the right that real men disdain renewable energy and love burning fossil fuels. Look at the dishonest attempts to blame wind farms for Texas blackouts actually caused by freezing pipelines.
In any case, what you need to know is that claims that taking on climate change would be an economic disaster are as much at odds with the evidence as claims that the climate isn't changing.
-- via my feedly newsfeed
Paul Krugman
(text only)
https://www.nytimes.com/2021/08/16/opinion/climate-change-republicans-economy.html
Global warming is fake news. Anyway, it isn't man-made. And doing anything about it would destroy the economy.
Opponents of action against climate change have always relied on multiple lines of defense: If one argument for doing nothing becomes unsustainable, they just retreat to another.
That's what we're seeing now, as conservatives argue against the Biden administration's push for climate-friendly public investment. As it happens, this push is taking place against a background of unprecedented heat waves, huge forest fires, severe drought in some places and catastrophic flooding in others — phenomena that scientists have long warned would become more common as the planet gets hotter.
Given these events, as The Times recently reported, Republicans have toned down their climate denial — in some cases pretending that they never denied the science in the first place. Thus Senator James Inhofe, the author of 2012's "The Greatest Hoax: How the Global Warming Conspiracy Threatens Your Future," is now claiming that he never called climate change a hoax.
ADVERTISEMENT
Continue reading the main story
If experience is any guide, this new willingness to accept the reality of global warming won't last; the next time America has a cold snap, the usual suspects will go right back to denying climate change and attacking scientists. For now, however, they're focused on the immense economic damage that they claim will result if we try to limit emissions of greenhouse gases.
So let me offer four reasons not to believe a word they say on this subject.
First, the U.S. economy has consistently done better under Democratic presidents than under Republican presidents — a pattern so strong that even progressive economists admit that it's puzzling. Whatever the cause of this partisan disparity, a party devoted to the zombie doctrine that tax cuts solve all problems has no standing to lecture us on what's good for the economy.
Second, there is a remarkable inconsistency between conservatives' expressed faith in the power of private initiative and their assertion that climate policies will paralyze the economy. Businesses, the right likes to tell us, are engines of innovation and adaptation, rising to meet any challenge. Yet somehow the same people who laud private-sector creativity insist that businesses will shrivel up and die if confronted with new regulations or emission fees.
In fact, a number of studies have shown that government projections of the effects of new environmental or safety regulations consistently overestimate their costs, precisely because businesses respond to new rules and incentives by innovating, finding ways to reduce compliance costs. And industry projections of the adverse effects of regulation are far worse, typically overstating the costs to a ludicrous degree.
Third, history strongly refutes the notion that there's any necessary link between economic growth and greenhouse gas emissions.
Editors' Picks
The Wonders That Live at the Very Bottom of the Sea
Last Stop on the Way to the Cosmos? No Thanks.
Tony Mendez, David Letterman's Oddball 'Cue Card Boy,' Dies at 76
Continue reading the main story
ADVERTISEMENT
Continue reading the main story
Consider the case of Britain, where modern economic growth began. British emissions of carbon dioxide have been falling for half a century, despite a growing economy. On a per-capita basis, Britain's CO₂ emissions are back down to what they were in the '50s — the 1850s, when real G.D.P. per person was only about one-ninth what it is today.
Finally, Republican insistence that we must remain dependent on fossil fuels is especially strange, given huge technological progress in renewable energy — progress so remarkable that the Trump administration tried to force power companies to keep using coal, which is no longer competitive on cost. Improved technology means that climate action looks far easier now than it did in, say, 2008, when John McCain called for a cap on greenhouse gas emissions, a position that would be disqualifying for anyone seeking the Republican presidential nomination today.
Of course, these facts won't change Republican minds. It's painfully obvious that politicians opposing climate action aren't arguing in good faith; they've effectively decided to block any and all measures to ward off disaster and will use whatever excuses they can find to justify their position.
Why has the G.O.P. become the party of pollution? I used to think that it was mainly about money; in the 2020 election cycle Republicans received 84 percent of political contributions from the oil and gas industry and 96 percent of contributions from coal mining.
And money is surely part of the story. But I now think there's more to it than that. Like pandemic policy, where the G.O.P. has effectively allied itself with the coronavirus, climate policy has become a front in the culture war; there's a sense on the right that real men disdain renewable energy and love burning fossil fuels. Look at the dishonest attempts to blame wind farms for Texas blackouts actually caused by freezing pipelines.
In any case, what you need to know is that claims that taking on climate change would be an economic disaster are as much at odds with the evidence as claims that the climate isn't changing.
-- via my feedly newsfeed
Subscribe to:
Posts (Atom)