Wednesday, October 27, 2021

Mike Roberts: Stocks, profit margins and the economy [feedly]

Stocks, profit margins and the economy
https://thenextrecession.wordpress.com/2021/10/25/stocks-profit-margins-and-the-economy/

The US stock market went back to record highs last week.  This was despite media talk that the recent rise in goods and services prices inflation in the major economies may continue for some time ahead.  This led to further hints that not only would central bank injections of credit money (quantitative easing) be tapered back soon; but also central banks would soon start to hike their policy interest rates.  The Bank of England chief economist, Huw Pill, a follower of the hard-line 'orthodox' German economist Otto Issing, emphasised that the central banks' task was not to boost the economy but to control inflation.  Financial markets took that to mean that the BoE would be hiking rates very soon – even at the next November meeting of the policy committee.  As a result, bond yields (the rate of interest on government bonds purchased in the bond market) rose to levels not seen for some time.

A rise in the cost of borrowing should lead to a fall in stock market investment as most financial investors borrow to speculate.  However, the US stock market seems impervious to the news on inflation and interest rates.  Why is that? 

The reason seems to be that investors are still convinced that the global economy is recovering fast as the vaccines roll out and the fiscal stimulus plans of many governments, particularly the US, are to continue.  As a result, forecasts of revenues and earnings being made by companies are very strong, with earnings rising at a 20% yoy pace. 

Indeed, if we look at profit margins ie profits per unit of output, then margins appear very high indeed, at around 14%, up sharply from the pre-pandemic.  Corporations in the US and Europe have been registering huge profits this year that comfortably compensate for any reductions during the pandemic slump.

How does that square with the data which show that the profitability of capital in the US is near record lows? 

Well first, both the stock market jump and the profits being recorded are heavily concentrated in the information technology sector and within that, the so-called FAANGS.  This was something I and others pointed out before the pandemic struck in 2019.  But it is even more so in 2021.  The IT sector contributes 25% of all US non-financial corporate sector profits.  And the other large contributor to profits is the consumer media sector, where Amazon dominates (50% of profits in the sector).  So if you strip out these sectors from the stock market and the profits data, then the rest of the corporate sector is not doing so well, at all.  Moreover, US corporate profits have been heavily subsidised in the last year from government handouts.

May be an image of text that says "2000 US non-financial sector profits with and without COVID subsidies ($bn annualised) 1800 1600 1400 1981 1200 1000 800 600 1389 400 200 0 11 -Non-financial corporate profits -NFC profits exc subsidies"

This explains the numerator in the measure of average profitability of capital in the US. Then there is the denominator.  Profit margins measure profits against output.  But profitability of capital measures profits against the cost of fixed assets (plant, machinery, technology) and the wage bill.  And investment in fixed assets has been weak, in the sense of delivering productivity-increasing technology outside the tech sector itself.  Vast swathes of industry and services in the US, Europe and Japan are barely making enough profits to cover the depreciation of existing assets and the cost of debt incurred.  Investment (capex) relative to depreciation, which measures investment in new technology, has been declining over the long term, and especially in the pandemic slump, with little sign of recovery in 2021.
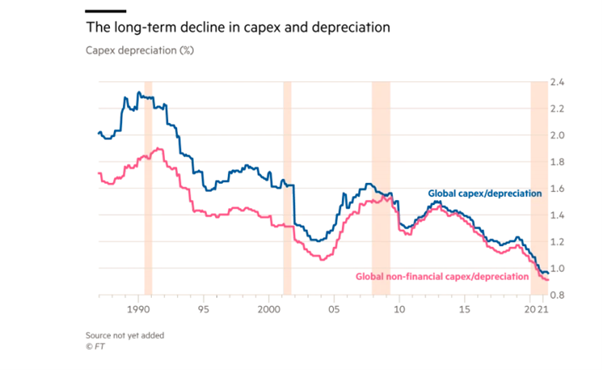
So while the tech sector holds up the stock markets and gives the impression of a widespread leap forward in profits, the rest of the capitalist economy is in the doldrums and has been throughout the 'long depression' of the 2010s. While the 'old economy' only represents about 35% of global gross domestic product, it generated at least twice the amount of corporate losses; and had about 90% of non-financial debt.

What is noticeable when we get to the so-called 'real economy' and away from the fantasy world of the stock and bond markets (the markets for what Marx called 'fictitious capital') is that the recovery from the pandemic slump of 2020 is beginning to falter.

The Atlanta Fed GDP Now forecast model tracks the data coming out of the US economy and then makes a forecast for real GDP growth.  As of 19 October, the model forecast that the US economy grew by only 0.5% (on annualised basis) in the third quarter of 2021 that ended in September. 
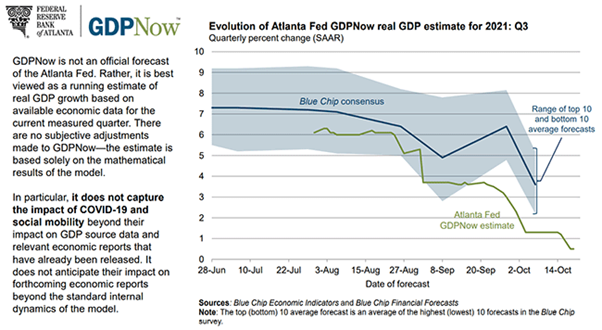
Now this is well below the consensus forecasts which are more like a 3-4% pace.  But even the consensus reckons the US economic recovery slowed sharply in the third quarter.  We shall get official preliminary estimates this week.  JP Morgan economists have noted the slowdown in Chinese growth, caused by continued COVID issues, weak growth in Asia, lack of raw materials and the impending residential property crisis.  And they now forecast just 3% growth in the US in Q3.  But they expect continued robust expansion in Europe, so that global growth was likely around 3.4% in Q3. 

However, JPM reports that "this outcome would represent a substantial step back in the speed of the recovery. Relative to our forecast at the start of last quarter, the 3Q21 global GDP shortfall from its pre-pandemic pace has deepened by over a percentage point and now points to a 2.7% journey back to a complete recovery".  Indeed, by the end of 2022, JPM still expects world GDP to be below the pre-pandemic level – and well below where world GDP would have been without a pandemic slump.  The recovery is not V-shaped but a reverse square root – see my 2021 forecast back in January.
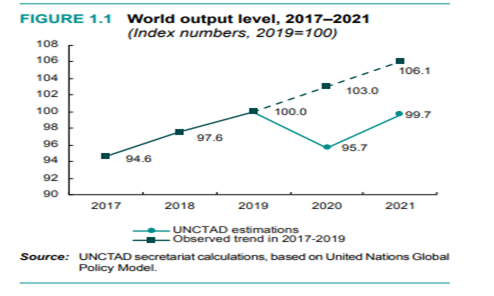
The fantasy world of rising stock market prices can continue further, but the market is based on foundations of shifting sand.  Sure, profit margins in the tech sectors in the major economies are still strong but outside of that sector, margins are tight.  With inflation rising, central banks are increasingly having to consider 'normalising' monetary policy and hiking rates.  If that happens, then the costs of debt servicing will rise.  And if the shortage of labour in key sectors continues, then wages could also move up.  Profit margins will then contract and the great stock market pandemic rally will reverse in 2022.


 -- via my feedly newsfeed

The Prospects for Services-Led Development [feedly]

Tim Taylor does an interesting take on an i important economic development challenge. Can services replace manufacturing and still yield the needed increase in productivity to support higher standards of living.

The Prospects for Services-Led Development
https://conversableeconomist.wpcomstaging.com/2021/10/26/the-prospects-for-services-led-development/

The path of economic development for countries around the world has followed a similar pattern of sectoral shifts: from agriculture to manufacturing to services. This pattern was followed (at different times) both by today's high-income countries including the United States, countries western Europe, Japan, and South Korea, and also by rising economies like China.

But the nature of manufacturing has been changing. Across many industries, the importance of low-cost labor has declined, while the cost of machine-driven manufacturing and robotics has been falling while its capabilities keep rising. Dani Rodrik has called this the problem of "premature de-industrialization"–that is, the potential for development through a movement from low-wage manufacturing to higher-wage manufacturing has diminished, even though a number of countries still very much need a path to economic development. Moreover, services have been growing faster than manufacturing for the world economy as a whole.

Can service industries offer an alternative pathway to economic development? Gaurav Nayyar, Mary Hallward-Driemeier, andn Elwyn Davies tackle this question in their World Bank monograph At Your Service? The Promise of Services-Led Development (September 2021). Here's how they set up the discussion:

Evidence suggests that manufacturing-led development in the past delivered the twin gains of productivity growth and large-scale job creation for the relatively unskilled. Underlying these were economies of scale, access to international markets, innovation, and supply chain linkages with other sectors, combined with the ability to leverage relatively unskilled labor with capital. Although services are labor intensive, they often require simultaneous production and consumption that precludes accessing larger markets. Their more limited ability to use capital to improve labor productivity also limits both scale economies and incentives to innovate. Conventional wisdom is therefore pessimistic about the prospects for services-led development.

This book seeks to test that conventional wisdom. To that end, there are two guiding questions. The first concerns whether the services sector has the potential to expand opportunities for poor people within LMICs [low- and middle-income economies] and whether these jobs can raise their productivity over time. … The second question is the extent to which the services sector can help lower-income countries catch up with the productivity and wealth of higher-income countries.

The authors make a case that, in fact, a process of growth in jobs and productivity has already been underway in many parts of the world for a few decades now. The exceptions are in the East Asia and Pacific region, where manufacturing has led the way in jobs and productivity growth. But in the rest of the developing world, services jobs and productivity growth have been faster. Here are some overall figures, showing that for the low- and middle-income countries of the world, it has been services, not manufacturing, that have been offsetting the decline in share of agricultural jobs and output.

The authors write:

First, industry has played a special, dominant role in East Asia (and to a smaller extent in Eastern Europe), whereas LMICs in other regions, on average, have not benefited as much from industry as a central driver of their development. Second, it is not the case that industry inherently outperforms services. For many LMICs, therefore, the choice between manufacturing- and services-led development is not of dire importance. The data show that services can deliver productivity growth—in several cases, growth that is higher than that of industry. What matters for the longer-term potential of services-led development is whether the features of industrialization that have enabled scale, innovation, and spillovers along with job creation for unskilled
labor—as in East Asia—are increasingly shared by the services sector. … It is not necessarily the production of "goods" or '"services" per se that matters but how these are produced.

A key insight here is that the nature of production in services is fundamentally changing, thanks in large part to the widespread arrival of information and communications technologies. These technologies allow a number of services to take advantage of economies of scale: for example, think of the issues involved in scheduling and managing trucking or courier services. Along with logistics, it seems that many service industries do have productivity spillovers to other areas: for example, some examples they mention include telecommunications, finance, education, and health care. Many services have become storable: the work can be done and saved online for later use. Services can be standardized and codified: think of uses like on-line banking or computer programming or long-distance examination of medical images. Services can be traded internationally, so developing economies have ways to tap into the buying power of high-income countries in global markets. The interaction of these activities, especially as new information technologies continue to develop and to spread, drives new innovations and economies of scale.

In short, the old-fashioned idea of services in low- and middle-income countries often involves small-scale and individual tasks, not ongoing salaried jobs. The new idea of services holds much more potential for economies of scale, innovation, and cross-sector spillovers, and thus much greater potential for jobs and growth. One possibility mentioned is international medical tourism: "Skill-intensive social services (health and education) are not amenable
to international specialization and will continue to need a substantial domestic presence owing to a significant face-to-face component. However, they also benefit from exporting opportunities, such as through health tourism. Costa Rica, India, Jordan, Malaysia, Mexico, Turkey, and Thailand have emerged as destinations for world-class health care at lower prices."

Of course, none of this should be taken to mean that economic development is now an easy task. The report goes into some detail about different categories of service industries and their various strengths. It also discusses a policy agenda based on the "four T's" of trade, technology, training, and targeting. But the report suggests that developing countries need not focus their efforts on low-wage manufacturing as the primary and necessary first step to economic development, and that other pathways are possible.


 -- via my feedly newsfeed

Sunday, October 24, 2021

The Horse Bit and Bridle Kicked Off Ancient Empires – A New Giant Dataset Tracks the Societal Factors That Drove Military Technology [feedly]

The Horse Bit and Bridle Kicked Off Ancient Empires – A New Giant Dataset Tracks the Societal Factors That Drove Military Technology
https://www.nakedcapitalism.com/2021/10/the-horse-bit-and-bridle-kicked-off-ancient-empires-a-new-giant-dataset-tracks-the-societal-factors-that-drove-military-technology.html

A strange day is coming to America… A massive and surprising new transition that could soon impact the wealth of thousands of Americans. Learn More

This era saw the advancement of the ability to control horses with bit and bridle, the spread of iron-working techniques through Eurasia that led to hardier and cheaper weapons and armor and new ways of killing from a distance, such as with crossbows and catapults. On the whole, warfare became much more deadly.

During this era, many societies were consumed by the crucible of war. A few, though – the Achaemenid Persian Empire, the Roman Empire and Han China – not only survived, but thrived, becoming megaempires encompassing tens of millions of people and controlling territories of millions of square miles.

So what drove this cascade of technological innovation that literally changed the course of history?

We are a complexity scientist, Peter Turchin, and a historian, Dan Hoyer, who have been working since 2011 with a multidisciplinary team to build and analyze a large database of past societies. In a new paper published in PLOS One on Oct. 20, 2021, we describe the main societal drivers of ancient military innovation and how these new technologies changed empires.

In the year A.D. 1, many areas of the world were dominated by massive empires each encompassing millions of people.Javierfv1212/WikimediaCommons

A Database for Human History

The store of knowledge about the past is truly enormous. The trick is to translate that knowledge into data that can be analyzed. This is where Seshat comes in.

The Seshat Databank is named after Seshat, an ancient Egyptian goddess of wisdom, knowledge and writing. Founded in 2011 as a collaboration among the Evolution Institute, the Complexity Science Hub Vienna, the University of Oxford and many others, Seshat aimed to first systematically gather as much knowledge about humanity's shared past as possible. Then our team formatted that information in a way that allows researchers to use big-data analytics to look for recurrent patterns in history and test the many theories aiming to explain such patterns.

The first step in this process was to develop a conceptual scheme for coding historical information ranging from military technology to the size and shape of states to the nature of ritual and religion. The database includes over 400 societies across all world regions and ranges in time from roughly 10,000 B.C. to A.D. 1800.

In order to trace the evolution of military technologies, we first broke them down into six key dimensions: hand-held weapons, projectiles, armor, fortifications, transport animals and metallurgical advances. Each of these dimensions was then further divided into more specific categories. Altogether we identified 46 such variables among the six technological dimensions.

For example, we distinguish types of projectile weapons into slings, simple bows, compound bows, crossbows and so on. We then coded whether or not each historical society in the Seshat sample wielded these technologies. For example, the earliest appearance of crossbows in our database is around 400 B.C. in China.

Of course, humanity's knowledge of the past is imprecise. Historians may not know the exact year crossbows first appeared in a particular region. But imprecision in a few cases is not a serious problem given the staggering amount of information in the database and when the goal is to discover macrolevel patterns across thousands of years of history.

The Seshat Databank places technological innovation in specific societies at specific times, as seen in this map showing the spread of mounted cavalry through time from its origins in the Eurasian steppes. Peter Turchin and Daniel HoyerCC BY-ND

Competition and Exchange Drive Innovation

In our new paper, we wanted to find out what drove the invention and adoption of increasingly advanced military technologies around the globe during the era of ancient megaempires.

Utilizing the massive amount of historical information collected by the Seshat team, we ran a suite of statistical analyses to trace how, where and when these technologies evolved and what factors seemed to have had the largest influence in these processes.

We found that the major drivers of technological innovation did not have to do with attributes of states themselves, like population size or the sophistication of a governance. Rather, the biggest drivers of innovation appear to be the overall world population at any given time, increasing connectivity among large states – along with the competition that such connections brought – and a few fundamental technological advances that set off a cascade of subsequent innovations.

The invention of horse bits and other bridle parts – like this one from 7th- to 8th-century B.C. Italy – gave people more effective control of horses, which had knock-on effects for the development of mounted warfare. Walter C. Baker/New York Metropolitan Museum of Art

Let's illustrate these dynamics with a specific example. Around 1000 B.C., nomadic herders in the steppes north of the Black Sea invented the bit and bridle to better control horses when riding them. They combined this technology with a powerful recurved bow and iron arrowheads to deadly effect. Horse archers became the weapon of mass destruction of the ancient world. Shortly after 1000 B.C., thousands of metal bits suddenly appeared and spread within the Eurasian steppes.

Competition and connection then grew between the nomadic people and the larger settled states. Because it was hard for farming societies to resist these mounted warriors, they were forced to develop new armor and weapons like the crossbow. These states also had to build large infantry armies and mobilize more of their populations toward such collective efforts as maintaining defenses and producing and distributing enough goods to keep everyone fed. This spurred the development of increasingly complex administrative systems to manage all these moving parts. Ideological innovations – such as the major world religions of today – were also developed as they helped to unite larger and more disparate populations toward common purpose.

Within this cascade of innovation we see the origins of the world's first megaempires as well as the rise and spread of world religions practiced by billions of people today. In a way, these critical developments can all be traced back to the development of the bit and bridle, which allowed riders better control of horses. Each step in this line has been long understood, but by employing the full range of cross-cultural information stored in the Seshat databank, our team was able to trace the dynamic sequence tying all these different developments together.

Of course, this account gives a greatly simplified explanation of very complex historical dynamics. But our research exposes the key role played by the intersocietal competition and exchange in the evolution both of technology and of complex societies. Although the focus of this research was on the ancient and medieval periods, the gunpowder-triggered military revolution had analogous effects in the modern era.

Perhaps most importantly, our research shows that history is not "just one damn thing after another" – there are indeed discernible causal patterns and empirical regularities through the course of history. And with Seshat, researchers can use the knowledge amassed by historians to separate theories that are supported by data from those that are not.

This story was co-authored by Daniel Hoyer, a researcher and project manager at the Evolution Institute and a part-time professor at George Brown College.

Print Friendly, PDF & Email
This entry was posted in Guest PostTechnology an
 -- via my feedly newsfeed

The geography of the Great Resignation: First-time data shows where Americans are quitting the most [feedly]

The geography of the Great Resignation: First-time data shows where Americans are quitting the most
https://www.washingtonpost.com/business/2021/10/22/states-labor-quitting-turnvoer-jolts/?utm_source=feedly&utm_medium=referral&utm_campaign=wp_business

text only -- check out the map via thelink

By Alyssa Fowers and Eli Rosenberg
October 22, 2021|Updated October 22, 2021 at 3:51 p.m. EDT

Kentucky, Idaho, South Dakota and Iowa reported the highest increases in the rates of workers who quit their jobs in August, according to a new glimpse of quit rates in the labor market released Friday.

The largest increase in the number of quitters happened in Georgia, with 35,000 more people leaving their jobs. Overall, the states with the highest rates of workers quitting their jobs were Georgia, Kentucky and Idaho.

The report from the Bureau of Labor Statistics builds out a portrait of August's labor market, with historic levels of people leaving jobs and a near-record number of job openings showing the leverage workers have in the new economy. It offers the first detailed insight into the state-by-state geography of this year's Great Resignation.

"It is a sign of health that there are many companies that are looking for work — that's a great sign," said Ben Ayers, senior economist at Nationwide. "The downside is there are many workers that won't come back in. And long term you can't sustain a labor market that's as tight as it is right now."

Nick Bunker, an economist at the online jobs platform Indeed, said it was notable that more-rural states had the highest quit rates.

"Service-sector jobs tend to be concentrated in more dense, urban parts of the country, so to see the quits rate pick up in other places was interesting," he said. That "may be a sign there's more competition in those parts of the country than other parts."

A record number of people are quitting their jobs. Here's what's driving the 'Great Resignation.'
4.3 million people left their jobs in August. National video reporter Hannah Jewell explains why so many people are calling it quits. (Casey Silvestri/The Washington Post)

As the Delta wave grew in August, the states with the most new infections also saw hotter job markets than the country as a whole. Employees quit or were hired at rates matching or exceeding the national average in the ten states with the highest rates of new infections that month: Alabama, Arkansas, Florida, Georgia, Kentucky, Louisiana, Mississippi, Oklahoma, South Carolina and Tennessee.

The data comes on top of another government snapshot showing that 4.3 million people quit jobs in August — about 2.9 percent of the workforce, a pandemic-era record.

The phenomenon is being driven in part by workers who are less willing to endure inconvenient hours and poor compensation, and are quitting to find better opportunities. There were 10.4 million job openings in the country at the end of August — down slightly from July's record high, which was adjusted up to 11.1 million, but still a tremendously high number. This gives workers enormous leverage as they look for a better fit.

Yes, the office is back. It just might never be the same.

Mary Kaylor is part of that groundswell.

She left her job in early July after her employer began calling workers back to the office, saying they'd have to be at their desks at least four days a week.

But her old commute — 90 minutes each way, or worse with traffic, from where she lives north of Baltimore to her office in Alexandria, Va. — was no longer acceptable to her.

"It was affecting my health, and I couldn't get my work done," she said. "I decided, 'Why am I doing this?'"

So Kaylor resigned, even though she did not have another job lined up. It didn't take long for her to land on her feet, however.

Just a few weeks after she quit, a recruiter reached out to her on LinkedIn about a position at Robert Half, a San Ramon, Calif.-based consulting company. The job allowed her to work remotely, and she said she felt that the company had a very employee-centric culture that made the switch easy from afar. She started the new position in August.

"Everything that I had read about the jobs market being hot and opportunities being out there was absolutely 100 percent correct," she said.

Now she says she has a job she likes, but with more balance at home and time to take care of herself with no commute.

"I've been able to get back to a regular workout and exercise routine — time to run in the morning and do yoga," she said. "All the time I used to spend sitting on the Beltway I can spend outside, so I'm excited about that."

Ramon Soto, 28, took advantage of the hot jobs market to look for a new position over the summer. He had been working in person at a law firm and said he got tired of the commute and constant negotiation about sick time amid persistent covid-19 risks.

By the end of August, he had dueling job offers — one at a company in Texas and another as an intake specialist at another law firm, near his home in Long Branch, N.J., that would allow him to work remotely.

He started the intake specialist job the next month, and it came with a raise to boot.

"Working from home removes a lot of the stress of regular day-to-day office work," Soto said. "You prioritize what the most essential part of your job is and get stuff done quicker so you can take full advantage of your day."

He said it was clear to him looking through job listings online that he had a lot of options to work remotely, as companies have increasingly begun offering the option to attract talent and widen applicant pools.He said that he felt he had some leverage in his job search but that the process was still extremely competitive — he interviewed three to four times at each of the companies that eventually made offers and had applied to many others.

"I knew I had an advantage," he said. "People are realizing their worth. Many of the jobs you look at now, especially in Jersey — people can't afford the cost of living working 40 hours. So you have people working two jobs, possibly three. But the pandemic actually flipped the coin, and employees have more power when it comes it to their pay now."

Chris Blanton, 34, who does clinical-trial work for companies that work with pharmaceutical firms, said he was bombarded with messages from recruiters on LinkedIn over the summer.

He finally started responding to them in early August, to see if there were better opportunities out there.

Within six weeks, he had a job offer from another company, one that would allow him to continue working remotely from his home in Orlando. It came with a raise and a substantial hiring bonus — the first bonus he had ever received, he said. Another company was interested in him, too, but was operating on a longer time frame.

So he quit the position he had and started the new job in late September.

"Usually I will ignore them all," he said of recruiters. "But I figured it was a time to see what's out there. That's when I found out there are other jobs that might be a better fit for me."

A previous version of this article incorrectly referred to a San Ramon, Calif., consulting company as Robert Hath. It is Robert Half. This version has been corrected.


 -- via my feedly newsfeed

Saturday, October 23, 2021

Enlighten Radio:Talkin Socialism: STRIKETOBER!!

The Red Caboose has sent you a link to a blog:


Blog: Enlighten Radio
Post: Talkin Socialism: STRIKETOBER!!
Link: https://www.enlightenradio.org/2021/10/talkin-socialism-striketober.html

--
Powered by Blogger
https://www.blogger.com/