Tuesday, October 6, 2020

New wealth data show that the economic expansion after the Great Recession was a wealthless recovery for many U.S. households [feedly]

New wealth data show that the economic expansion after the Great Recession was a wealthless recovery for many U.S. households
https://equitablegrowth.org/new-wealth-data-show-that-the-economic-expansion-after-the-great-recession-was-a-wealthless-recovery-for-many-u-s-households/

Overview

The Federal Reserve's 2019 Survey of Consumer Finances, or SCF, released last week, shows that the wealth of many U.S. households never recovered from the shock of the Great Recession more than a decade ago. Although mean (average) wealth of all households in 2019 exceeded mean wealth in 2007 by 9 percent, median (midpoint) wealth declined by 19 percent over the same time period. If housing wealth is excluded, the median wealth of all households in 2019 is about equal to median wealth in 2007.

These several data points show that U.S. households barely recovered their levels of nonhousing wealth over the more than 10 years of economic expansion since the Great Recession of 2007–2009, compared to pre-Great Recession levels. And the data show that households are now less likely to have a home to leverage as a financial asset.

Moreover, disaggregating the data by demographic characteristics shows that many of these households fared worse than the average. Whiter, wealthier, and more educated households fared better, although even these struggled to recover their pre-Great Recession levels of wealth, demonstrating just how broadly felt the slow recovery of wealth has been.

That so many of these households would soon enter the coronavirus recession, which began in February 2020, in worse condition than they entered the Great Recession is a dire warning. This current recession is already deeper and families have fewer resources to draw on to protect themselves from its effects. The upshot: Further aid from Congress is critical to avoid repeating the mistakes made as the United States recovered from the Great Recession.

Disaggregating the 2019 SCF data to discover what kinds of households entered the coronavirus recession with the resources to insulate themselves from job losses, furloughs, or ill health caused by COVID-19, the disease caused by the virus, would help policymakers understand what kinds of households need help now to weather this economic and public health crisis. Notably, however, sample sizes in the Survey of Consumer Finances are not large enough for Hispanic and Black communities to support the fine levels of disaggregation necessary for policymakers to target aid effectively and efficiently.

Furthermore, sample sizes for Asian Americans and Pacific Islanders are so small that the Federal Reserve has to withhold these data from public disclosure entirely, grouping them into a catch-all "other" category to protect the privacy of these households. This is why the Fed should consider oversampling these communities.

The analyses below compare 2007 levels of wealth, from before the Great Recession, to 2019 levels of wealth, and represent peak-to-peak comparisons that tell us whether households with particular demographic characteristics are better- or worse-positioned for the current recession than they were in 2007 for the Great Recession. Most graphs in this column include shaded 95 percent confidence intervals to show levels of statistical uncertainty for these calculations.

White households had a stronger recovery of wealth

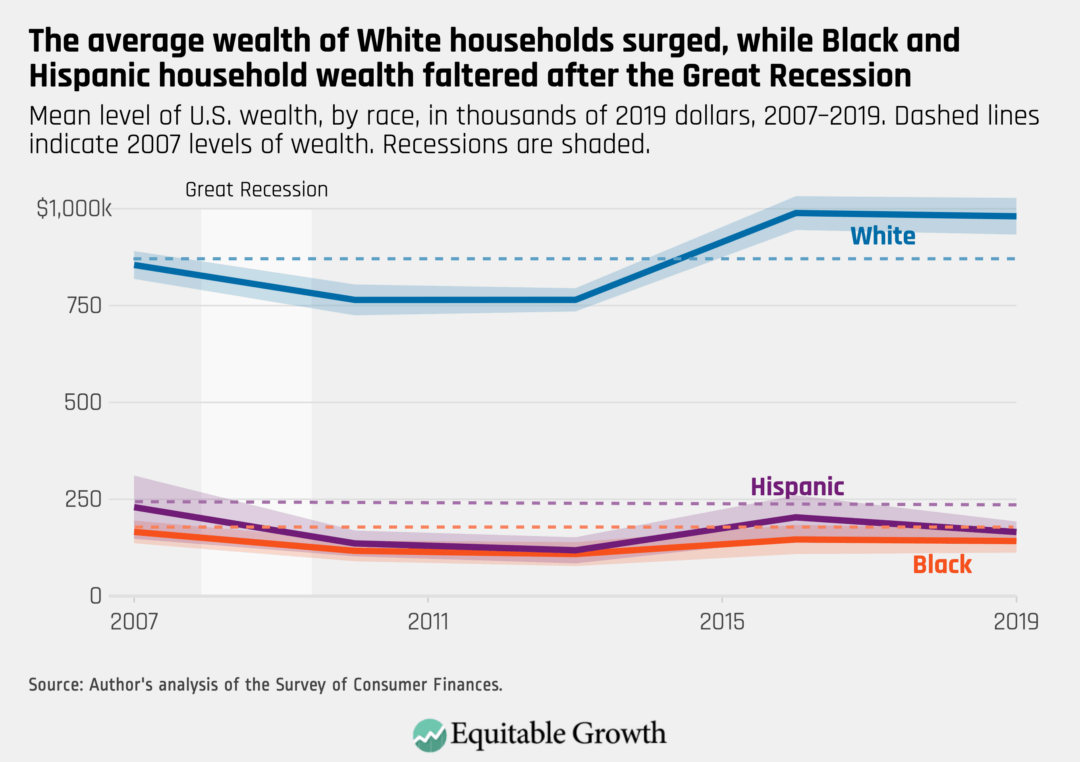
Households that fully recovered their pre-Great Recession levels of wealth are overwhelmingly White. While White households, on average, have 15 percent more wealth in 2019 than in 2007, Black households have 14 percent less wealth, and average wealth for Hispanic households declined by 28 percent. (See Figure 1.)

Figure 1
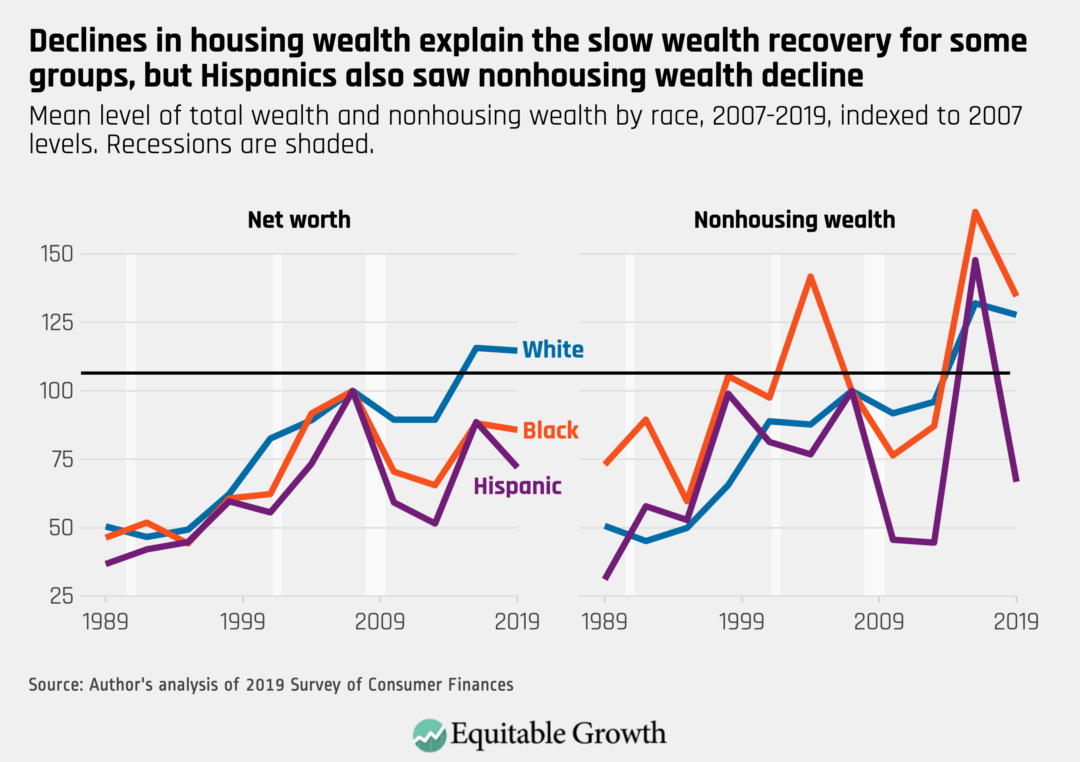
Declines in housing wealth in the United States are responsible for a significant portion of wealth declines since before the Great Recession, but they are not the whole story. The nonhousing wealth of White households between 2007 and 2019 increased by 28 percent after the Great Recession, while it surged 35 percent for Black households and dropped 33 percent for Hispanic households. That average Black wealth declined even though nonhousing wealth surged in the group indicates how important housing wealth is to Black households. (See Figure 2.)

Figure 2
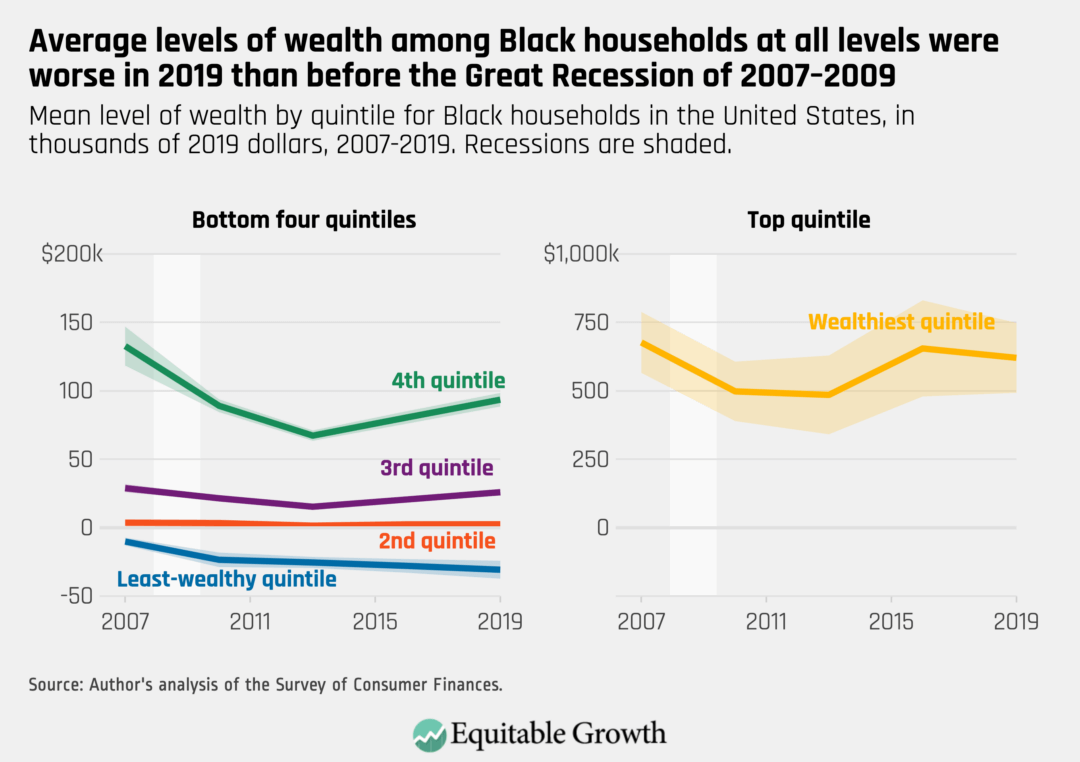
Even high-income Black households did not fully recover what they lost during the Great Recession. Classified by wealth, every quintile of Black households saw declines in their net worth. Middle-quintile Black households saw their net worth decline by 10 percent between 2007 and 2019, for example. (See Figure 3.)

Figure 3
Wealthier households had the strongest recoveries of wealth

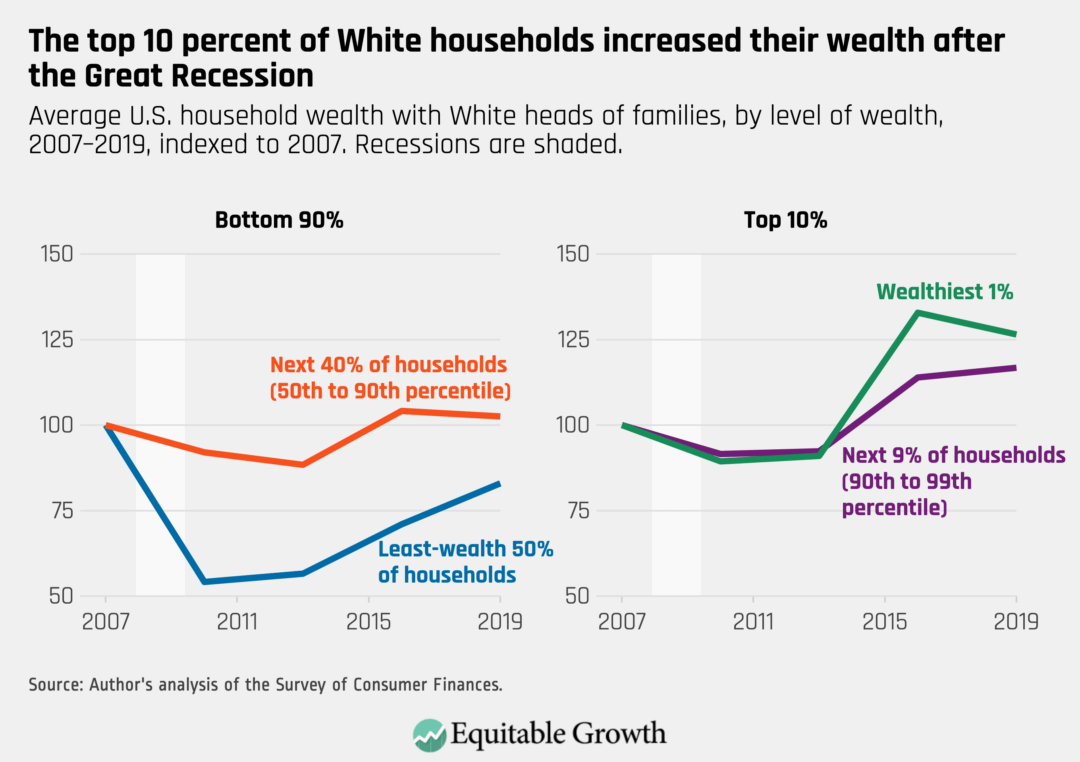
U.S. households headed by White people were more likely to recover or exceed their pre-Great Recession levels of wealth, with much of this growth happening at the top of the wealth distribution. In contrast, households outside the top 10 percent experienced relatively weak recoveries.

In fact, White households in the bottom half of the wealth distribution only recovered about 83 percent of their pre-Great Recession wealth peak. Those in the next 40 percent of the wealth distribution (from the 50th percentile to the 90th percentile) saw very modest gains of about 2.5 percent. Those at the top, however, built a significant amount of wealth. The top 1 percent increased their wealth by 26 percent during the post-Great Recession economic recovery. (See Figure 4.)

Figure 4
Less-educated households struggled to build wealth in the recovery

Americans grouped by education experienced a similar divide before and after the Great Recession. Those with a bachelor's degree or more just barely recovered their pre-Great Recession levels of wealth. But Americans in every other educational group saw significant declines in their wealth, although Americans with high school diplomas came closest to recovering. (See Figure 5.)

Figure 5
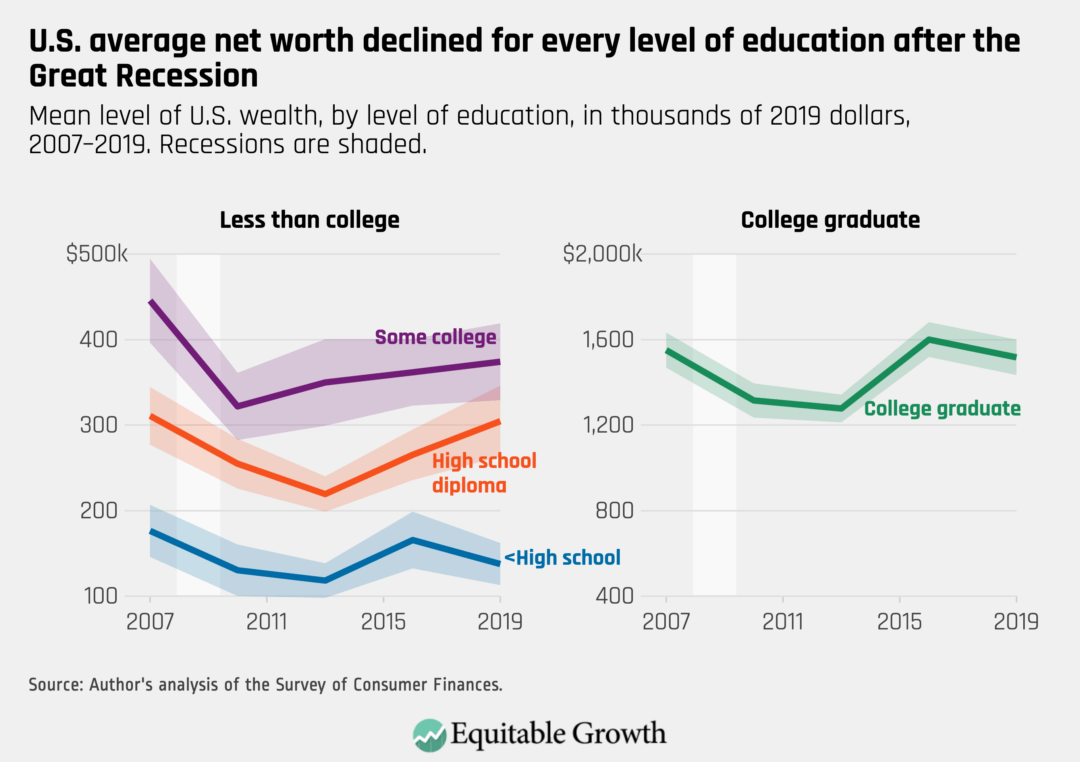
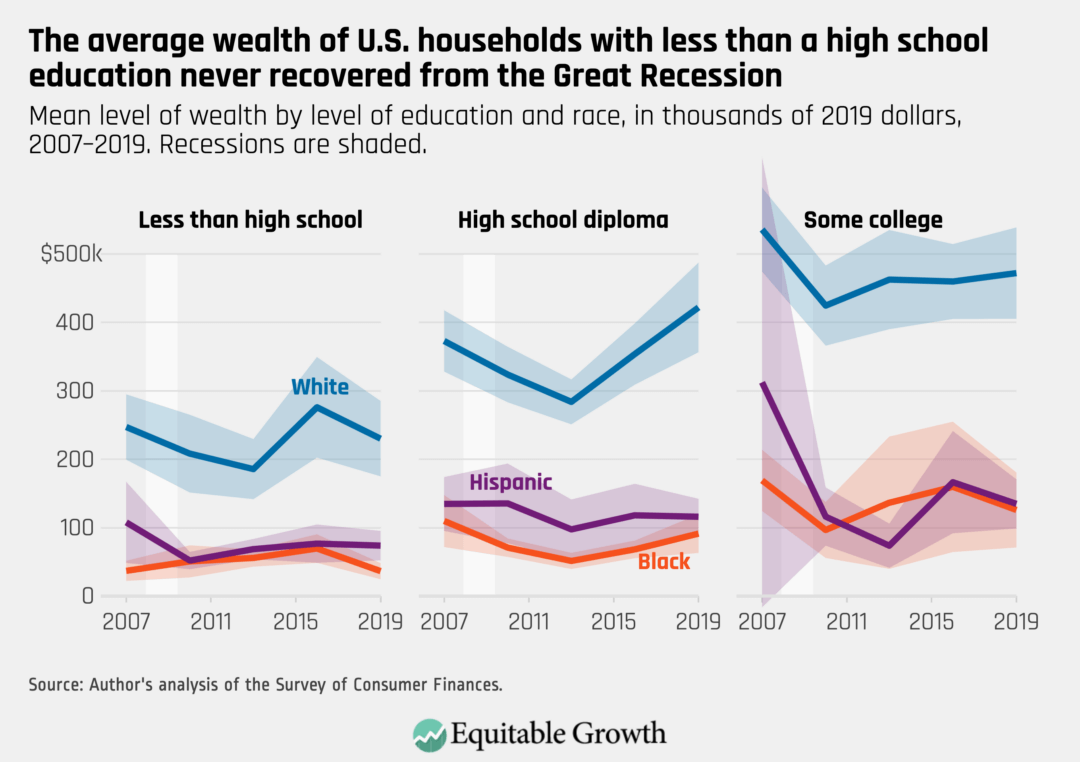
This is true even for White households at lower levels of education. Those White households with a head of the family who had less than a high school diploma or with a GED or high school diploma only narrowly recovered their 2007 levels of wealth by 2019. Sample sizes for White households with a head of the family who had some college experience are relatively small, and it is difficult to draw inferences in this group.

Again, the differences are more stark for households of color. White households with less than a college degree saw their wealth increase by 3 percent between 2007 and 2019. But Black households without a college degree entered 2020 and the coronavirus recession two months later with an average of 17 percent less wealth than what they had in 2007. (See Figure 6.)

Figure 6
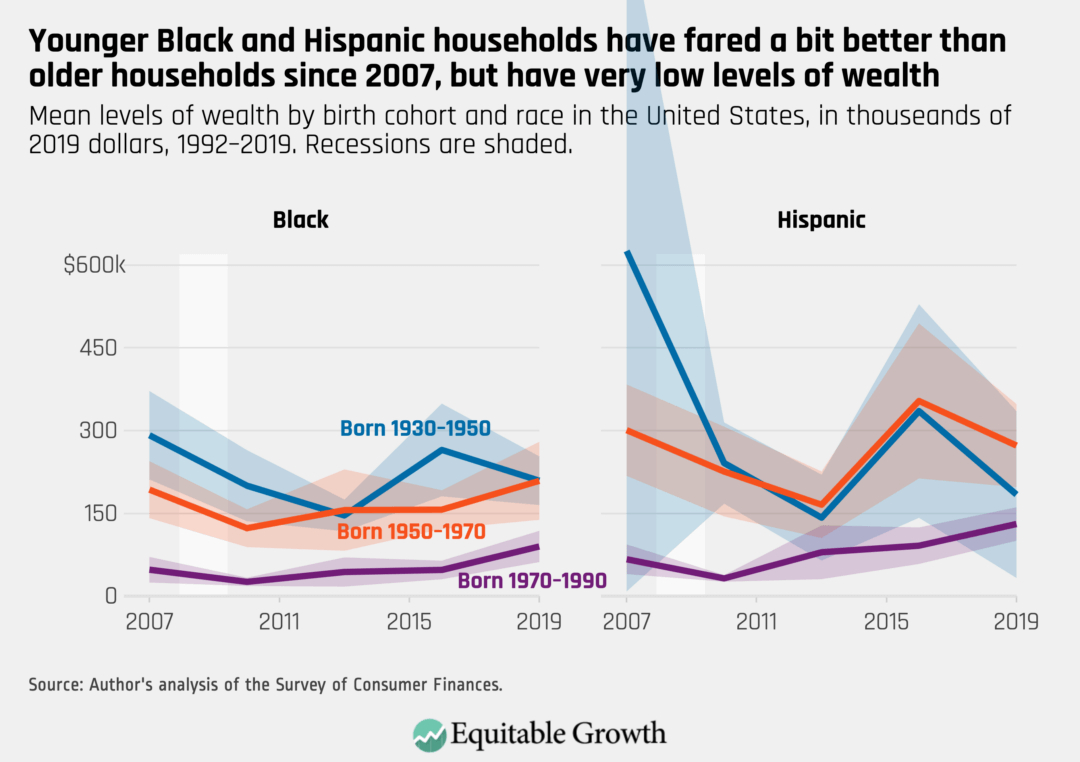
Younger Black households built wealth during the recovery but continue to have very low levels of wealth

From a generational perspective, Black households have levels of wealth far lower than even the youngest White households. A White household where the head of the family was born between 1970 and 1990 had average wealth of about $500,000 in 2019, whereas even the oldest Black households only had average wealth of around $200,000.

Black and Hispanic households of any age had very low levels of wealth entering the Great Recession. But younger generations of both Black and Hispanic households fared better over the course of the recovery after the Great Recession. Black households with heads of families born between 1970 and 1990 increased their wealth by 65 percent between 2007 and 2019, but nonetheless still have very low levels of wealth. (See Figure 7.)

Figure 7
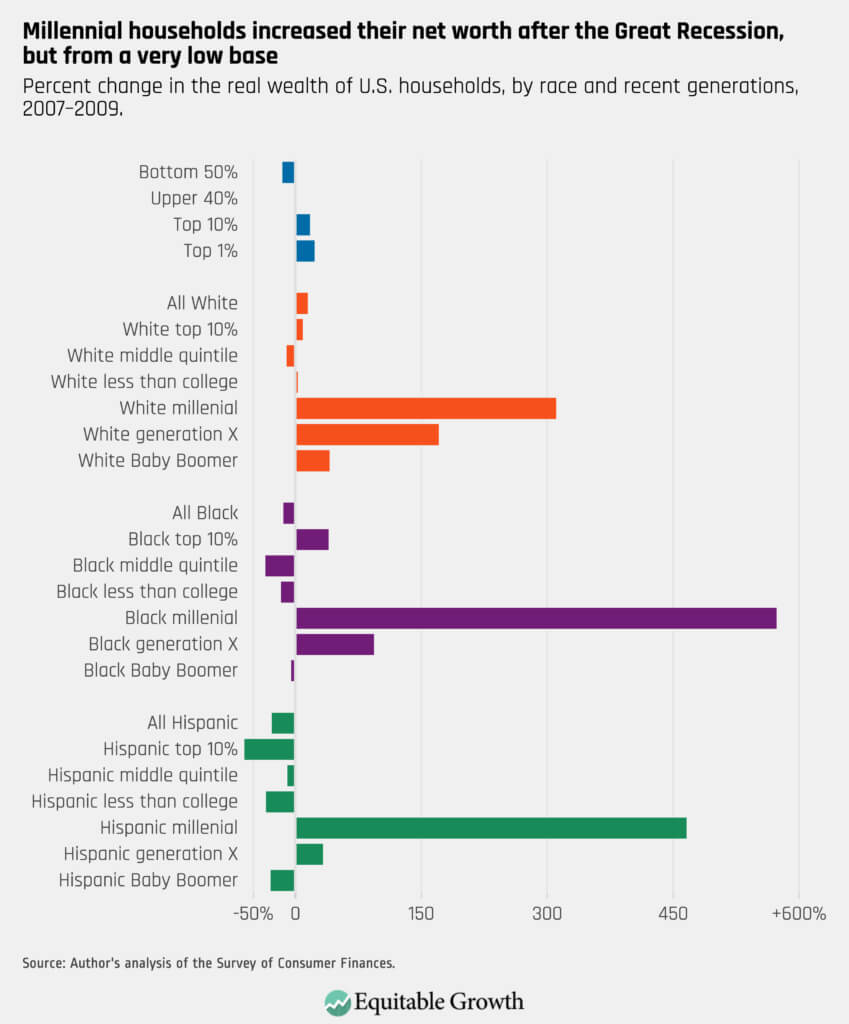
The wealth of many U.S. households is lower entering the coronavirus recession than right before the Great Recession of 2007–2009

Despite the record-long economic expansion of more than 10 years following the Great Recession, many households never fully recovered, pointing to weaknesses in wage growth and in the availability of high-quality jobs that dogged the recovery for nearly its entire length. Notably, millennial households built a considerable amount of wealth during that recovery, but only because they started with very low base levels of wealth, and they had less housing wealth to lose during the Great Recession. (See Figure 8.)

Figure 8
Conclusion

The lessons learned about U.S. household wealth across a variety of measures after the Great Recession demonstrate that the relative paucity of policymaker action after the economic gains from the American Recovery and Reinvestment Act of 2009 fed into the U.S. economy led to an overall weak recovery in U.S. household wealth. Today, that leaves many Americans struggling through the coronavirus recession. And that's why Congress should not repeat the mistakes made by past Congresses, but rather continue to act forcefully to make sure there is a robust recovery.

Another important takeaway from the data in the Federal Reserve's 2019 Survey of Consumer Finances is that the huge error bars around Hispanic and, to a lesser extent, Black household estimates of wealth in the graphs above demonstrate how uncertain these estimates become when analyzing the data at the intersection of race and education, age, gender, or other demographics. To support better decomposition of groups, the Federal Reserve should consider instituting oversamples of households of color.


 -- via my feedly newsfeed

US Income Inequality, According to CBO [feedly]

US Income Inequality, According to CBO
https://conversableeconomist.blogspot.com/2020/10/us-income-inequality-according-to-cbo.html

 -- via my feedly newsfeed

For a basic overview of income inequality in the United States, the Congressional Budget Office provides a useful overview in its report "The Distribution of Household Income, 2017" (October 2020). Versions of this report have been coming out for about 40 years. The CBO uses what is called the Statistics of Income, which is based on a nationally representative sample of individual income tax returns collected by the Internal Revenue Service. Thus, the data for income in 2017 wasn't first reported on tax returns until 2018, and it takes a couple of years before the late tax returns have arrived and the comprehensive dataset can be compiled. This CBO report is really just about presenting the data: you need to draw your own policy conclusions. 

Here's some basic information on growth of income at different points in the distribution over time. The rise in incomes for households in the bottom fifth or "quintile" of the income distribution, not including taxes and transfer payments, was about 35% from 1979 to 2017. The rise in incomes for the middle quintiles of the income distribution was about the same. But here's the pattern at the top. 

Clearly, income growth at the very top of the distribution has been at higher rates. For perspective, the average income (before taxes and transfers) for those from the 99th percentile up to the 99.9th percentile was $1.11 million in 2017; for those from the 99.9th percentile to the 99.99th percentile, average income was $5.67 million; for those at the 99.99th percentile and above, average income was $48.54 million. 

Interestingly, the source of income that has grown the fastest is what is called "business income"--that is, income from owning or running a business which at the top level includes often includes partnerships in large law firms, running as series of car dealerships, and other substantial enterprises. The CBO writes: 

As a share of income among households in the top 1 percent, business income rose from 11 percent in 1979 to 23 percent in 2017. Meanwhile, average capital income (including capital gains) grew at a slower pace than other forms of income. As a result, it declined as a share of income among households in the top 1 percent of the distribution, from 54 percent of income in 1979 to 41 percent in 2017. Labor income remained roughly constant at about one-third of income among such households from 1979 to 2017.
How have the effects of of federal redistribution changed over time, in terms of taxes and programs that tend to redistribute income? Here's a graph showing average federal tax rates over time by income group, where the average federal tax includes income taxes, payroll taxes that finance Social Security and Medicare, and corporate income taxes attributed to those who receive such income. The general pattern is generally lower federal tax rates as a share of income for those at the bottom, and not much overall change in federal tax rates for those at the top. (More detailed breakdowns of federal tax rates for the top 0.1% and 0.01% look a lot like the top 1%.)

What are the effects of federal tax and spending programs in reducing inequality, and how have these effects changed over time? The Gini coefficient is a way of measuring inequality that varies from 0 to 1, with zero being complete equality of incomes. The top line in this figure show rising inequality over time in market incomes. The second line shows the change in this inequality after taking into account Social Security and Medicare payments. The third line shows the change in inequality after taking into account means-tested federal programs aimed at those with lower incomes. The bottom line shows income inequality after taking in account all of the previous changes plus shifts in taxes. 

One basic theme that emerges from figures like this is that no matter what metric you choose, income inequality is up. However, it's also true that the combination of government programs has ameliorate the rise in market-based income inequality to some extent: for example, measured by market-based incomed, the Gini rises 13 percentage points from 1979 to 2017  (from .472 to .602), but looking at the bottom line that includes all income and transfers, the rise is about 8 percentage points (from .351 to .434).  

Finally, it's also interesting to note that in terms of reducing inequality, a lot of the action happens because of taking Social Security and Medicare into account--that is, it's mainly reducing inequality for elderly Americans. Also, a big chunk of that reduction in inequality--the Medicare portion--doesn't put any income directly into the pockets of the elderly, but instead goes to paying health care providers. 

No Meat, No Milk, No Bread: Hunger Crisis Rocks Latin America - Bloomberg

No Meat, No Milk, No Bread: Hunger Crisis Rocks Latin America

by James Attwood, Valentina Fuentes, Jonathan Gilbert and Michael McDonald

<p>Millions are getting pushed into poverty,&nbsp;moving&nbsp;from relatively comfortable lives to&nbsp;not knowing where their next meal is coming from.</p>

https://www.bloomberg.com/news/features/2020-09-28/no-meat-no-milk-no-bread-hunger-crisis-rocks-latin-america?sref=woWS9Szx


He couldn't feed his family. Matilde Alonso knew it was true but couldn't believe it. The pandemic had just hit Guatemala in full force and Alonso, a 34-year-old construction worker, was suddenly jobless.


He sat up all alone till late that night, his mind racing, and fought back tears. He had six mouths to feed, no income and no hope of receiving anything beyond the most meager of crisis-support checks -- some $130 -- from the cash-strapped government.

Today, Alonso said, breakfast, lunch and dinner all look about the same in his house in El Jocotillo: maybe a tortilla with salt; maybe a tortilla with beans; maybe a bowl of rice and beans. "We used to eat meat. Now, there's no meat. We used to eat chicken. Now, there's no chicken. We used to drink milk. Now, there's no milk." Even bread, he said, is off the menu.

For tens of millions like Alonso, the pandemic has exposed just how fragile economic status is worldwide. In many ways, nowhere has that been more apparent than in Latin America, where a resurgence of poverty is bringing a vicious wave of hunger in a region that was supposed to have mostly eradicated that kind of malnutrition decades ago. From Buenos Aires to Mexico City, families are skipping on meals and swapping fresh produce for starchy and sugary items. Even in Chile, a developing-world success story, some neighborhoods are turning to community cook-ups in a throwback to the dictatorship era of the 1980s.


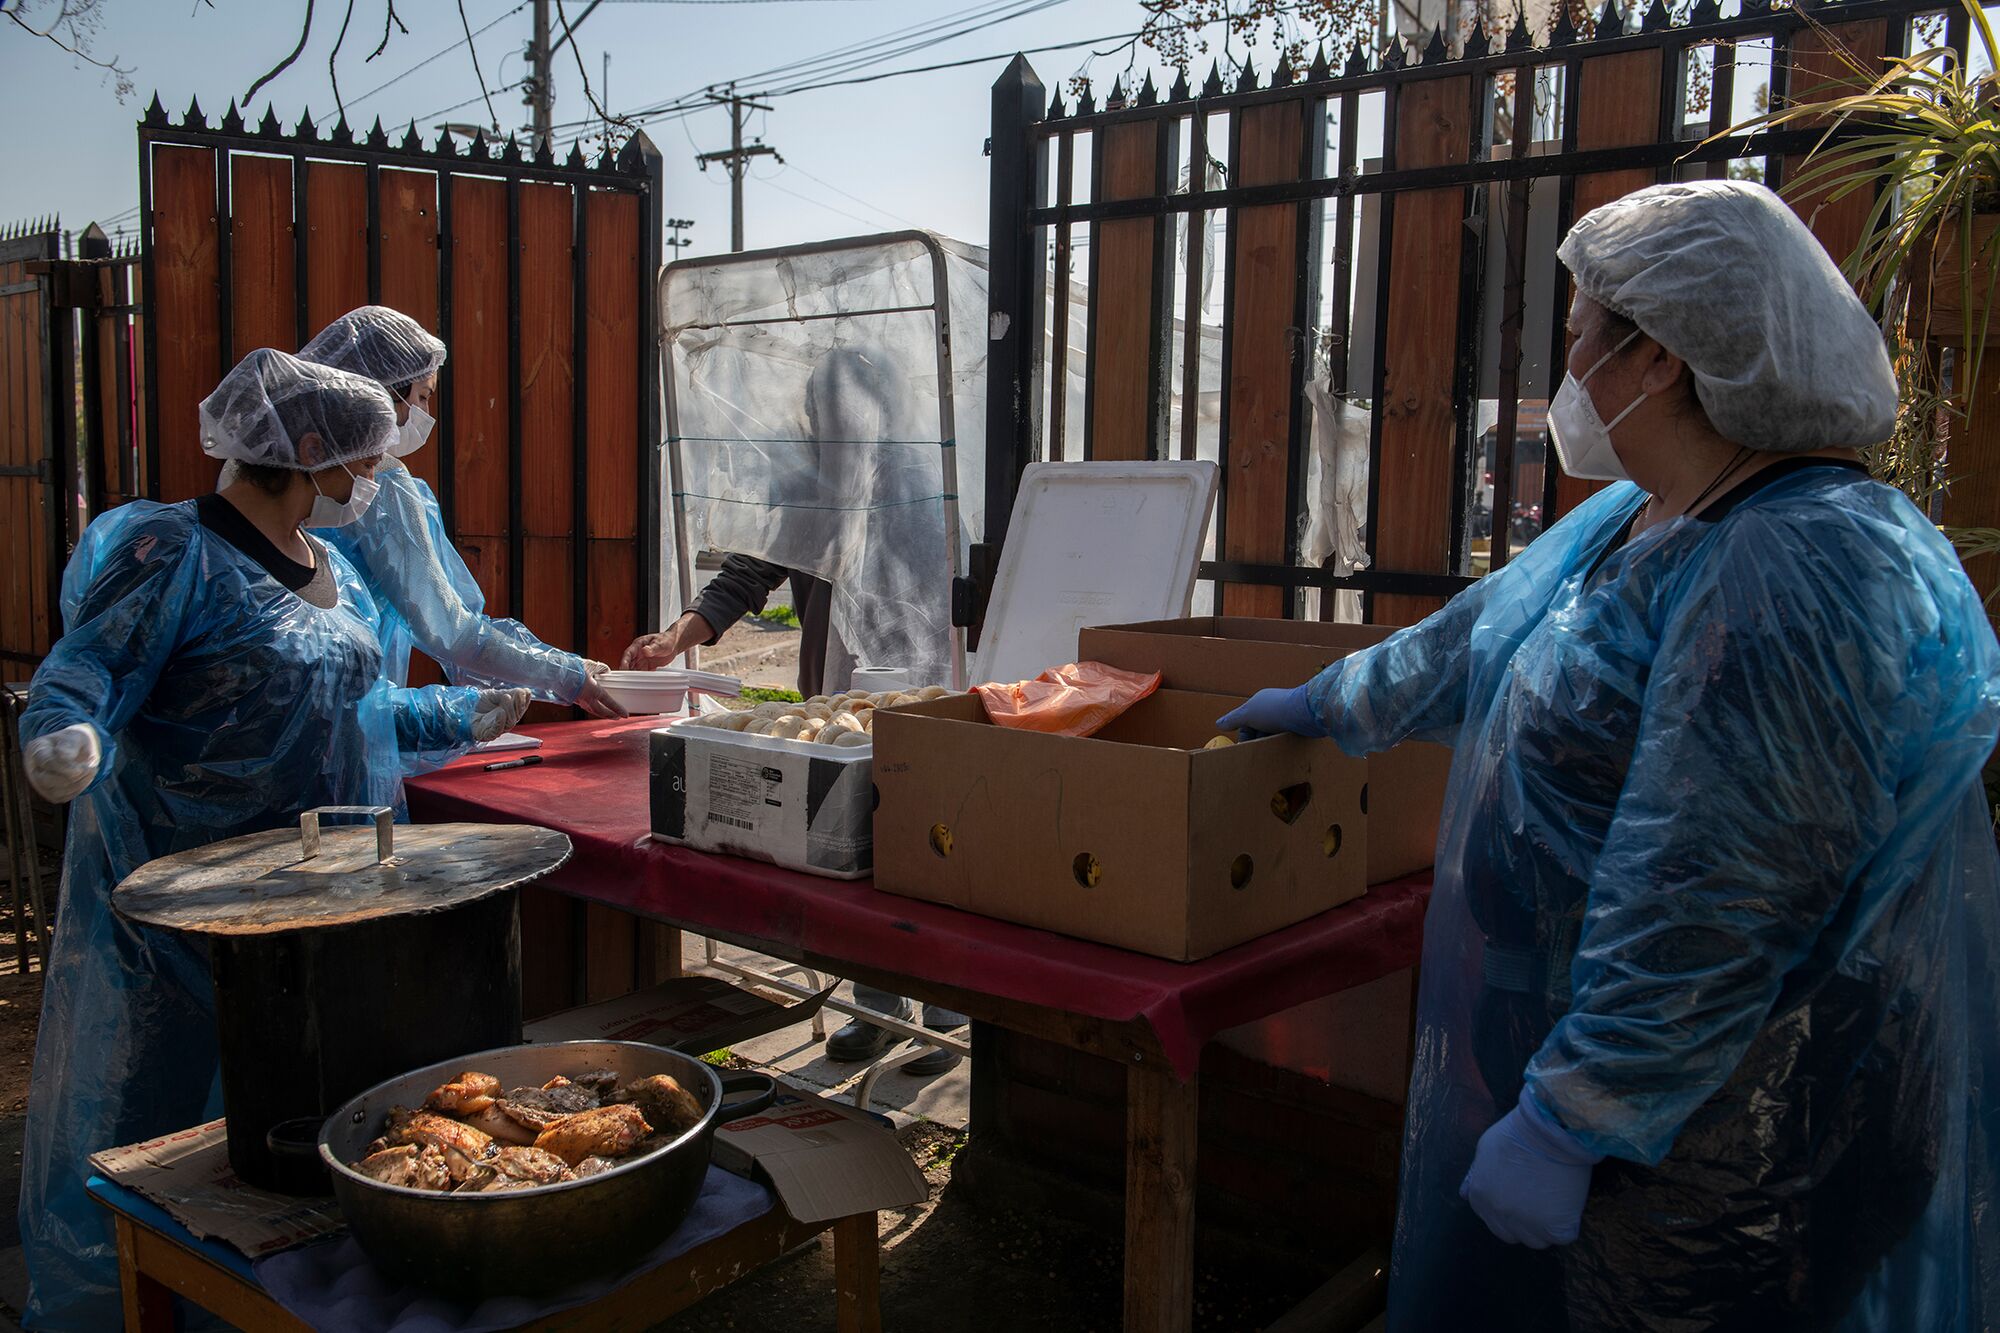
Social workers prepare and serve food during a cook-up in the Lo Hermida neighborhood of Santiago, Chile. Some communities have revived the dictatorship-era "olla comun" communal kitchens to provide aid during the pandemic-driven crisis.
Photographer: Tamara Merino/Bloomberg


Latin America stands out because most of the region's governments don't have the financial might to deliver the huge amounts of aid that's been seen in places like the U.S. and Europe. Then there are the millions of workers who labor in the informal economy, selling mangos from a street cart or cleaning homes for cash, who are often locked out of assistance programs.

The United Nations' World Food Programme estimates that the Latin American and Caribbean nations in which it operates will see a surge of roughly 270% in the number of people facing severe food insecurity over the coming months. That rise -- to 16 million from 4.3 million before the pandemic -- is likely to be the steepest in the world and more than twice the estimated global growth rate, Norha Restrepo, a WFP spokesperson in Panama, said by telephone.


Growing the region's middle class has come in fits and starts. A boom in commodity prices from 2000 to 2014 sparked a decrease in the poverty rate from 27% to 12%. But as demand for raw materials cooled, there was a swift reversal. Argentina sank into deep recession, and the economic situation in Venezuela took an unprecedented dive into despair. Meanwhile, even the earlier period of growth was hiding deep fault lines in the region, where economic inequality, racial tensions and police brutality brewed just beneath the surface. Those pressures boiled over into mass protests last year, with hundreds of thousands taking to the streets in Colombia, Chile and Ecuador.


The pandemic has made economic stability even more precarious, with millions now making the unthinkable move from relatively comfortable lives to not knowing where their next meal is coming from.

Food Access in Latin America

Percentage of the population that cannot afford a healthy diet


Source: FAO


"The difference between being poor and going poor is brutal," said Jose Aguilar, founder of Reactivemos La Esperanza, which supports 100 families in Costa Rica and is trying to reach more people. "When you're middle class and you have food, access to education and are accustomed to a certain quality of life and all of a sudden it's taken away from you through no fault of your own, that hits families really hard."

The region is on track for its worst recession in a century with a 9.1% contraction forecast for this year and unemployment set to reach 13.5%, according to the Economic Commission for Latin America and the Caribbean, or Eclac. With half the working population living outside of formal economies, job numbers don't tell the whole story. Regionally, Eclac expects an additional 28 million to enter the ranks of extreme poverty this year, with women overrepresented in poor households.

"This economic and health crisis is just starting, and it'll result in the largest number of people living in food scarcity in recent times," said Maria Teresa Garcia, who heads Bancos de Alimentos de Mexico, a food charity. "This crisis is going to leave a mark for a long, long time."

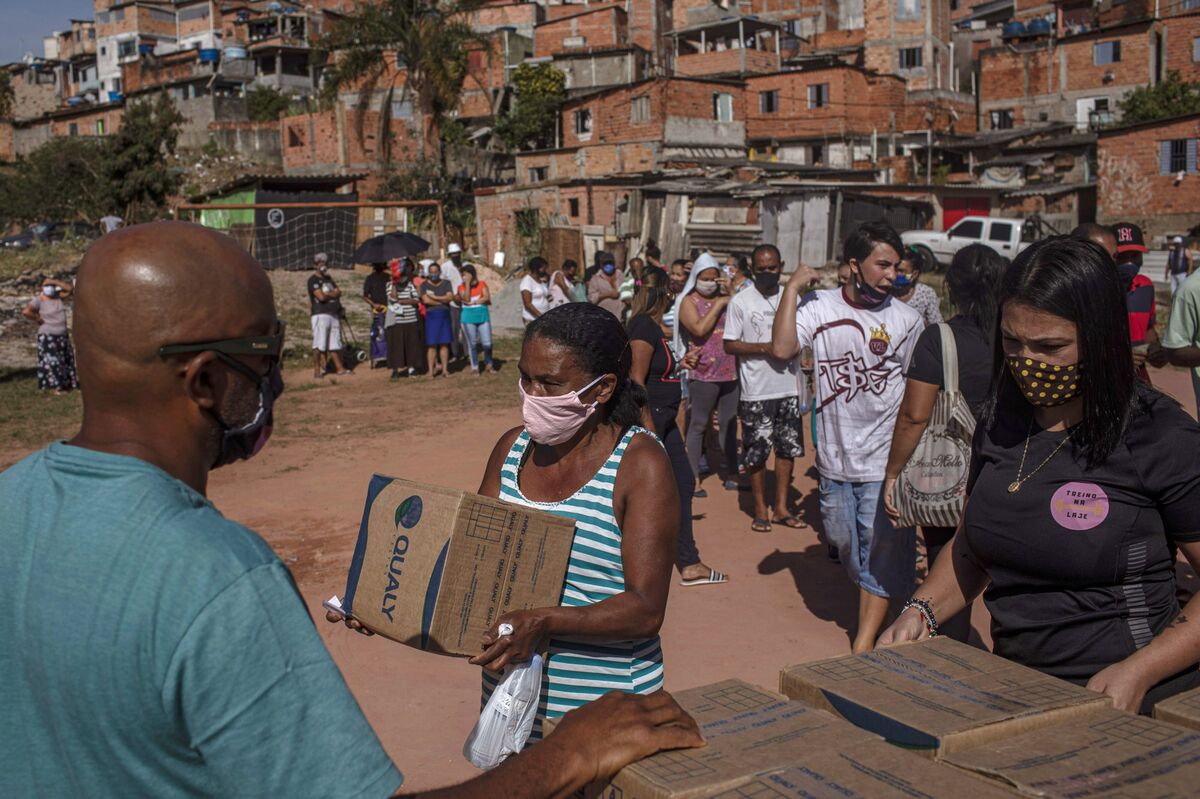
Volunteers distribute boxes of food and hygiene products to residents of a favela in Sao Paulo, Brazil. Brazil has combatted economic distress with cash stipends and aid that is bringing down rates of extreme poverty.
Photographer: Victor Moriyama/Bloomberg

Other parts of the world are also seeing the reversal. The World Bank in June warned that the pandemic could undo years of progress for the poor in less-developed nations such as India and Nigeria, with as many as 100 million more people expected to fall into extreme poverty. With that, there will be a massive spike in food inequality. As many as 132 million more people than previously projected could go hungry in 2020, and this year's increase may be more than triple any this century, according to UN estimates. Latin America is helping to lead that surge.

In Chile, Sonia Gallardo has gone from eating dinners of chicken and rice to washing down bread and butter with coffee. Sometimes it's only coffee.

She immigrated from Peru 12 years ago for a better life in Chile, leaving behind an old two-room adobe house in Chiclayo that had been passed down to her mother. Working as a houskeeper in Santiago, she used to make $600 a month, enough to start saving for a home of her own. But strict lockdowns ended that job, and now she's lucky to make $80 a month reselling cleaning products in the city's bustling markets. There's barely enough for groceries. She's suddenly dropped 10 pounds and is adding elastic to her pants to keep them from falling down.

"I never thought this was going to happen. I thought that I would never have to live like I lived in Peru again," Gallardo said.

A resident receives a meal at the "olla comun" in Lo Hermida. The community meals are funded with donations that are starting to stretch thin.
Photographer: Tamara Merino/Bloomberg

Like most of the world, the hunger gripping Latin America has nothing to do with insufficient supply. In fact, the region is an agricultural powerhouse, with its fertile plains and valleys producing grains, fruits and proteins that help feed the world. The crisis is about whether those thrown out of work during the pandemic can afford to eat.


For the most part, aid from governments is far outstripped by the need, even if some countries decided to implement aggressive stimulus packages. Brazil, for example, has started an emergency cash stipends program so ambitious that it temporarily helped bring down extreme poverty readings to national historic lows. But that massive program is expiring at the end of the year and is too fiscally expensive to sustain further. In most countries, payments are limited and people spend any cash they get to first pay for housing and utility costs. There's often little left over for food.

In Argentina, Miguel Leiva pulled himself out of the unemployment and drugs of a Buenos Aires slum, and he now supports his wife and two children as a bus driver and is training to be a primary-school teacher. The country's 41% inflation is eating into his $525 a month salary, and strict lockdowns mean he can no longer work extra hours. He's behind on credit-card and utility payments and weekly barbecues of Argentina's famed short ribs are now "a luxury we can't afford." The family has also cut back on fruit and vegetables. Chocolate biscuits, loaded with sugar, have replaced expensive yogurts, while the family's intake of flour for homemade pasta has jumped by as much as tenfold.

"It's the same for everyone," Leiva, 45, said. "We may eat OK for two weeks, but then it's a case of surviving until the end of the month and the next paycheck."

At the start of the pandemic in March, the Argentine government sent members of the military to distribute food to residents. Argentina's prolonged lockdowns have affected the economy as the country slides into its third consecutive year of contraction, pushing more people into poverty.
Photographer: Sarah Pabst/Bloomberg

An undernourished population typically means more costly visits to doctors and hospitals, a less productive workforce and more school absenteeism. Most concerning to the UN are the implications for development of young children. Food insecurity also risks exacerbating unrest after the wave of protests in 2019.

In such a diverse region, the economic impact from the pandemic is uneven. Poorer countries like Haiti and parts of Central America that rely on remittances are particularly vulnerable. As are the millions of Venezuelan migrants in Colombia, Ecuador and Peru who depend on informal work and lack access to social programs. Tens of thousands of them are returning home, bringing more mouths to feed in Venezuela, which was already on the brink of famine.


Even in more developed countries such as Chile, some communities are having to band together to ensure people are fed.

In the Santiago neighborhood of Lo Hermida—known for its participation in social struggles especially during the military dictatorship of the 1970s and 1980s—Erika Martinez is organizing "common pots," or community cook-ups, that have fed about 300 people a day since May.

The food is mostly noodles and legumes. Local butchers or grocers sometimes kick in leftovers, and chicken is a rare treat. The cooking is done with firewood because there's no money for gas. The clientele is mainly informal workers such as part-time tradesmen, gardeners or seamstresses who've been hit the hardest by pandemic lockdowns.

"For us in Lo Hermida, the common pots represent a sad memory of the 80s," said 53-year-old Martinez. "I never thought we would have to go back to that."

Erika Martinez, left, prepares over 100 pieces of roasted chicken to be served at the "olla comun." Her community kitchen has fed about 300 people a day since May.
Photographer: Tamara Merino/Bloomberg

Back in Guatemala, the government has already reported an increase in the rate of acute malnutrition among children aged 5 and under. Alonso, the construction worker, is so worried about how to keep his four kids fed that he's started planting corn and beans. A friend leased him a small plot of land. Another gave him some seeds and fertilizer and told him he can have until the end of the year to pay back the cost, he said.

"It's what I've been doing all pandemic long — improvising as best I can."


— With assistance by Ezra Fieser, Nicolle Yapur, Tatiana Freitas, Andrea Navarro, and Andrew Rosati

Journal entry: 10-5-20


10/5/20 Journal entry

jcase

 One can only hope that the Republican party's neo-fascist leadership COVID infections will assist their defeat in the presidency and the Senate, and retreat from the current political scene. The latter remains doubtful. A fascist movement as big, as well funded, and infested in the highest institutions, as this one --- led, for now, by Trump -- will not expire from the scene with his personal passage . Nor will the underlying systematic contradictions and inequities, both national and international, that are driving the paralyzing political divides recede autonomously. Without the imposition of serious, nationwide public mandated therapies -- economic, healthwise, environmental, and political therapie, our descent into hell will not be slowed or arrested. To say that such requirements argue for a "war footing", equivalent to that of the last time global fascism rose to power, may be understating the matter.

Consider three latest items in the 2020 daily cascade of horrors from national and international info outlets:

1. HUNGER IN AMERICA, ESPECIALLY FOR CHILDREN, HAS “SKYROCKETED” DURING COVID-19, DATA SHOWS'  The headlines gives you the gist.

2. A local ministries leader's call for help meeting the Homeless Challenges in my home county. Local Institutional support is either missing or overwhelmed.

3. Biden win could restore US-EU partnership for coordinated approach to China. The international humpty dumpty has been broken by Trump. Restoring it will be complicated, and made harder by Chinese international (Belt and Road global development actions) and domestic performance and resilience during both COVID and economic recovery --- all while under increasing economic and diplomatic assaults by Trump. The competitive pressure on western political and economic systems will grow very intense if Chinese socialism keeps consolidating its gains as it has done. Persistent Chinese gains will compel global recognition of the socialist alternative approaches to economic management, and principles of "peaceful coexistence" This does not bode well for unity returning   quickly to US-EU, or US-China relationships, in the short run, however. There will be little help, and possibly military conflicts, from the international catastrophes compounded by COVID.

The COVID, and associated economic, plagues are proving that corrupt, billionaire cliques --- and the political and institutional domination of market relations by a variety of billionaire cliques --- are futile against forces of destruction of this scale, and that are triggered external to markets. The fed cannot fix this. Keeping the financial system from collapsing is essential, but fatally insufficient. Public spending and investment on a massive scale -- but under the most scientifically informed leadership is necessary: coordinated, national, international, but decisive leadership. The poisonous political paralysis of the Obama years after passage of the ACA is not a state from which any remedy to the catastrophes can be retrieved.

Unfortunately, other ideologies have considerably more influence in politics than science: religion, "morality", "property", "family values" -- can together or severally serve to transform raw or crafty interests, or targets of personal grievances into organized political factions or anti-factions. The factional ideologies can frequently be adapted (picture the Falwell's) to serve a particular class, or other powerful economic interest. The public's vulnerability to these pitches is due in no small part to the tiny proportion of the population that has genuine training and education in scientific subjects and methodologies. Fascism -- rule by force on behalf of the most powerful billionaire factions -- is an example of the billionaire's mentality when attempting to opportunistically manipulate factional ideologies among races, nationalities, and other identities, while profiting from vast social challenges and conflicts. Trump's infection on the heels of his Big Lies about the virus is a good illustration of the ultimate futility of such efforts. But that futility will only add extra curses on the immense damage.

It is certain that the cure must include universal health, a new division of wealth and public private balances of power, a full reckoning with the curse of slavery's legacy of racism, of full equality and social participation for women, and a renewed national identity that embraces internationalism in a multinational, multiracial society. Climate change places severe time limits on the urgency of meeting these challenges, since its own logic and the logic of political inaction is inexorable. Science knows.
Socialism, too, is historically born out of a need to address massive external shocks to a system inherently unable, or too enfeebled, to defend society in its old forms. But socialism arises from working classes, not billionaires. (beware the "fake" socialisms, like "national socialism" of the Nazis, that are just propaganda covers for billionaire rule.) It too seeks coordinated, decisive leadership from public authority to address a crisis in society. The United States has no shortage of revolutionary models in its history that model executive power -- economic and military force -- in action in a progressive historical direction: Washington's army in the establishment of national security for the formation of an independent, partially democratic republic; and Lincoln's assumption of extra-constitutional executive powers in the war against slavery. Karl Marx wrote very little about "socialism", or "communism", and what he did write, he characterized as necessarily partial and speculative, from the standpoint of circa (1870). But he aspired, always, to achieve a scientific understanding of the emergent capitalist economic system, and its life-cycle. He came to economics from philosophy, and in particular, with a desire to turn philosophy away from "standing on its head" to "feet firmly planted on solid ground". Economic and social science is like physics in that it exposes material explanations for observed and studied phenomena, and ideologies, too. It differs from physics in that the "data" in the analysis of society is always at arms length from laboratory reproducibility. For accuracy it relies upon statistical and probability analysis, which depends, as data science has proven, on the amount of data and the smartness of algorithms increasingly implemented by machines themselves!

The premise of Chinese socialism is that socialists and communists can scientifically manage both capitalist market and non market relations better than capitalists. The Russian experiment shows that the outcomes are not guaranteed, and that raising the supremacy of science, and expertise over corruptions, are keys to success. Nonetheless, the concept, sometimes known as Commanding Heights, originated from Vladimir Lenin, but was abandoned by his successors in Russia. Half a century later, however, the biography of Chinese communist leader Deng Xiaoping is a powerful testimony to Lenin's insight, and the complexity of mastering it in a very different national environment than where it originated. Among other things, the Chinese implementation demonstrates that the national histories, character and cultures of each nation uniquely stamp the political character of their "socialism". But this principle --- that socialialists can manage capitalism better than capitalists -- appears to thrive, if it can be mastered. The current crisis is as close we are likely to get of a historical test of this thesis. The Nordic "socialisms", although not Marxist led, are also doing better at recovery, than the US and the rest of Europe The test is being taken by all nations. Our history foretells that this will be a hard one for us, as Americans.

Friday, October 2, 2020

Jared Bernstein: September 2020 jobs report: Slowing jobs gains and a huge spike in long-term unemployment [feedly]

September 2020 jobs report: Slowing jobs gains and a huge spike in long-term unemployment
http://feedproxy.google.com/~r/JaredBernstein/~3/zjkJ6ruWX_Y/

Payrolls grew by 661,000 last month, well below expectations, and the jobless rate ticked down to 7.9 percent, driven not by job gains, but by people leaving the labor force. Long-term unemployment spiked sharply–in fact, its largest one-month spike on record–and shifts continue from temporary to permanent job losses. In other words, though the labor market continues to improve, it is doing so at a slower pace, and the risk of increasing numbers of job seekers stuck in long-term joblessness is rising.

Payrolls continue to climb back as commerce gradually recovers, but the pace of gains has slowed, as shown in the figure below. Private sector gains last month were stronger, at 877,000, as local education jobs fell sharply, by 231,000. At least part of that loss is due to the impact of Covid on decline job opportunities for bus drivers, school cafeteria workers, and janitors due to much less in-person teaching.

Importantly, this deceleration in job gains (see figure) is consistent with the absence of two absolutely essential policies from the federal government: virus control and fiscal stimulus. The former was never taken seriously by the Trump administration, at tremendous cost to the lives, health, and living standards of millions of Americans. The latter–stimulus–was initially implemented with real urgency, but the fact that such urgency has demonstrably faded is evident in today's report.

Source: BLS

No labor market indicators have regained their pre-crisis peak, as shown in the figure below. It shows the percent of losses regained since payrolls started growing and unemployment started falling. For example, the unemployment rate initially rose from 3.5 percent in February to 14.7 percent in April, an increase of 11.2 percentage points. Since then, it has declined to 7.9 percent in September, meaning it filled up 6.8 points of the 11.2 point hole, or 61 percent.

The first point from the table is that all bars are well below 100 percent. Sizable holes still persist and while it has clearly improved, the job market is still operating with recessionary levels of slack. Blacks in particular reveal lagging progress. The recovery of both their unemployment and employment-to-population rates (EPOPs) are lagging behind the others. This is a serious concern which appears to confirm the strong cyclical component of Black labor market outcomes, meaning they benefit disproportionately from strong labor demand and, in the current situation, take more of the brunt of weaker labor demand.

Other signs of decelerating job opportunities include the increase in permanent, versus temporary, job losers (meaning laid-off workers who should not expect to be called back to work as commerce reopens) and the related spike in long-term unemployment, i.e., those seeking work for at least six months. Back in May, when more jobless workers still thought they were temporarily furloughed, permanent layoffs were only 14 percent of the unemployment. In September, that share was 36 percent.

The 781,000 spike in long-term unemployment in September was historically notable: it is the largest one-month increase in this indicator on record, with data starting in 1948 (note: this record holds as a share of unemployment as well, which spike up from 12 to 19 percent). The risk here is what economists call "hysteresis:" the phenomenon of a group of potential workers relegated to the labor market's sidelines for long periods. Should their skills or even just their basic labor-market attachment fade due to long periods of joblessness, they risk a lasting disconnection from work and wages at great cost to themselves, their families, and the greater economy.

Though it is too early to tell whether these early indicators will morph into a longer-term trend, my work in this area suggests that Black, immigrant, and low-income workers are particularly vulnerable to this outcome. Certainly, the bars for Blacks in the figure above are suggestive of that result, but it is one I will be carefully tracking in coming weeks and months.


 -- via my feedly newsfeed

What the coronavirus recession means for U.S. public-sector employment [feedly]

What the coronavirus recession means for U.S. public-sector employment
https://equitablegrowth.org/what-the-coronavirus-recession-means-for-u-s-public-sector-employment/

According to the latest Employment Situation report released by Bureau of Labor Statistics today, the U.S. economy in September added 661,000 nonfarm payroll jobs, reflecting an important slowdown in employment growth. Also known as the Jobs Report, the release shows that the share of 25- to 54-year-old prime-age workers who have a job fell from 75.3 percent in August to 75.0 percent, and the number of unemployed workers who report being on a permanent layoff increased by 345,000 for a total of 3.8 million workers out of 12.6 million unemployed workers in September. 

This final Jobs Report before the 2020 presidential election calls into question what policies are needed to foster an equitable and sustained economic recovery in the midst of the coronavirus recession. The report also reflects U.S. labor market conditions more than a month after the expiration of the $600 "plus-up" in unemployment benefits funded through the Coronavirus Aid, Relief, and Economic Security, or CARES, Act. The end of this plus-up is forcing workers to return to work during an uncontrolled pandemic with few other options to support themselves and their families.

As such, there continue to be important income, race, and gender disparities evident in the latest Jobs Report, as well as questions about the quality of jobs being added that underlie last month's net job gains.

At 7 percent, White workers' unemployment rate is well-below the 8.9 percent jobless rate for Asian American workers, the 10.3 percent jobless rate for Latinx workers, and the 12.1 percent jobless rate for Black workers. The unemployment rate for women, which was lower than the jobless rate for men just before the onset of the coronavirus recession, stands 0.3 percentage points above it, at 8 percent. Additionally, 865,000 women dropped out of the labor force in September, and therefore are no longer counted among the ranks of the unemployed. Longstanding disparities along the lines of race, ethnicity, and gender continue to be exacerbated amid the tenuous economic recovery.

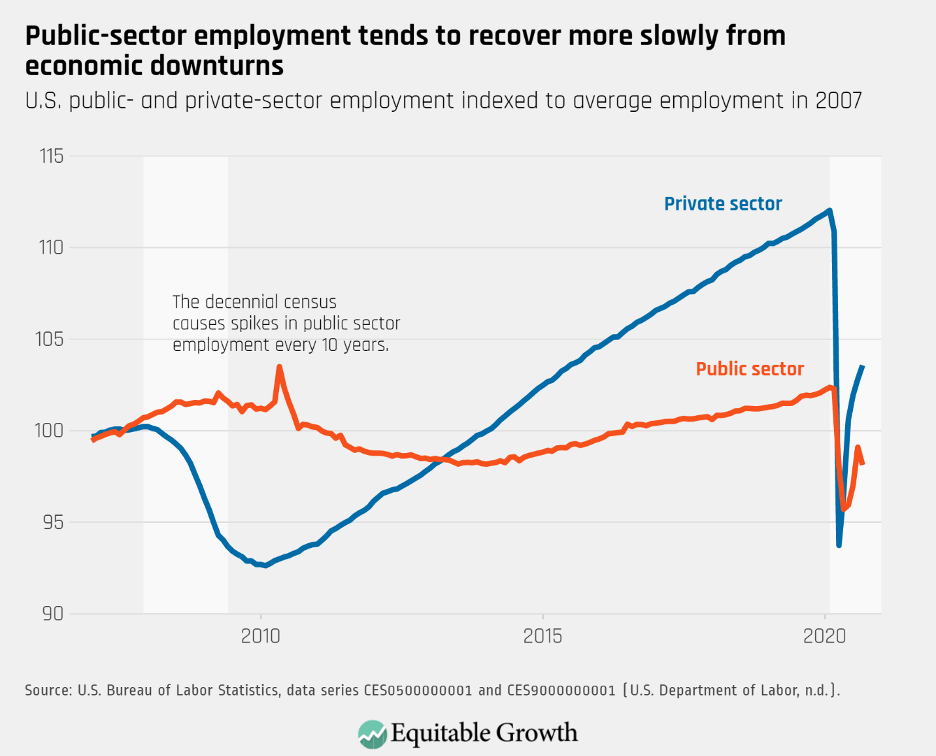
So far, employment losses in the public sector are not as deep as in the private sector, but they are worrying given that government is the only major sector to have experienced net losses last month, shedding 216,000 jobs in September. Additionally, the public sector was exceptionally slow to recover from the previous economic downturn. Even though the private sector also took a harder hit during and immediately after the Great Recession of 2007–2009, jobs were back to their pre-crisis level by March 2014. In contrast, government employment did not fully bounce back until late 2019, excluding a brief spike in 2010 due to hiring for the past decennial Census. (See Figure 1.)

Figure 1

The crisis in the public sector also threatens many good jobs. Government workers tend to be less likely than their private-sector counterparts to experience either job losses or poverty, and have greater access to employee benefits such as healthcare. At 33.6 percent, the union membership rate of government workers is five times greater than for private-sector workers. Since the 1960s, effective enforcement of equal opportunity employment policies and greater political power led to a rise in the share of Black workers holding government jobs, making the public sector an important pathway to economic mobility and security for many marginalized workers.

Over the past few decades, however, public-sector jobs are becoming more insecure and less effective at promoting equitable labor market outcomes—a process that Great Recession of 2007–2009 seems to have accelerated.The past 40 years are marked by a shift from decent to lousy jobs, with both the decline in public-sector job quality and the loss of government jobs through recessions contributing to rising economic inequality. Research by Kimberly Christensen of Sarah Lawrence College, for example, shows that the fiscal crunch faced by state and local governments in the aftermath of the Great Recession was particularly damaging for women workers and workers of color because it shifted employment from good government jobs to much more precarious work in retail, leisure, and poorly paid medical care work.

Even though government jobs used to serve as a buffer against U.S. labor market inequality, their equalizing effect weakened over time. When analyzing racial disparities in the likelihood of being laid off, Elizabeth Wrigley-Field of the University of Minnesota and Nathan Seltzer from the University of Wisconsin-Madison find that Black workers are more likely to involuntarily lose their jobs than White workers, a disparity that has increased since the 1990s. The public sector used to reduce Black workers' disproportionate exposure to layoffs, but it became less protective over the past three decades, the authors find.

The great majority—63 percent—of public-sector workers are employed in local governments, compared to 23 percent in state governments and 14 percent in the federal government. This means local and state government workers—among whom women and Black workers make up a larger share of the labor force than in the federal government—are once again experiencing the deepest job losses because states are required to keep balanced budgets without debt financing.

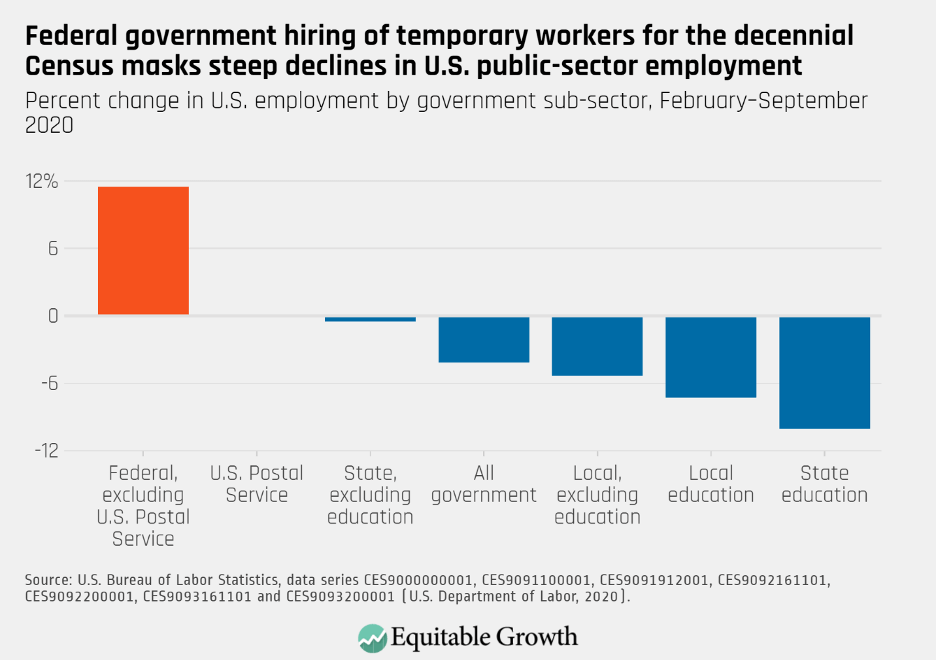
In addition to the downward pressure on state and local employment in recessions, the increase in federal employment over the past 6 months is due to this year's decennial Census staffing. This staffing is now beginning to wind down. (See Figure 2.)

Figure 2

Another slow recovery in the public sector—a sector in which Black workerswomen workers, and union members are overrepresented—would put the brakes on the economic security they and their families need to climb out of the coronavirus recession, deepen existing U.S. labor market disparities, and become a drag on the economic recovery, as consumer spending declines as more quality jobs disappear.As state and local governments struggle with deep revenue and budget shortfalls, greater fiscal support to state and local governments is essential.

In addition to the unique risks facing the public sector, the private sector faces challenges to continuing jobs growth as well. These challenges exist in the public sector, too, particularly jobs such as Kindergarten through 12th grade school teachers, but private-sector service jobs that require face-to-face interaction or require close proximity to one's co-workers during an uncontrolled pandemic means that many of the recent jobs gains remain precarious.

Without sweeping and coordinated public health measures in place and effective treatments and vaccines for COVID-19, the disease caused by the coronavirus, the number of additional jobs gained amid this tenuous economic rebound is fragile, and these jobs remain hazardous. The upshot: This continuing recession is still exacerbating long-term trends of decreasing job quality and rising economic precarity, which are especially harmful to marginalized workers, including Black workers and women workers, and their families, particularly amid a still-lethal pandemic.


 -- via my feedly newsfeed