Wednesday, October 17, 2018

Trumps Stimulus Trumps his Trade Policy

CFR Setser: Wonky, but another deep dive into the winners and losers in his tax cut/ trade war policy

Trump's Stimulus Trumps his Trade Policy

October 11, 2018

It is hard to think of a President more committed—at least rhetorically—to closing the trade balance than President Trump. The usual criticism of his trade policy is that it is overly focused on a single goal—reducing the bilateral, and ultimately the overall, trade deficit, to the exclusion of more traditional goals like liberalization (e.g. expanding trade) or expanding the scope of the traditional rules governing trade. President Trump has made it equally clear he cares about the manufacturing balance.   

Yet the results of the first seven quarters of his presidency show, ironically, the limits on what can be achieved through trade policy alone.

More on:

Trade


U.S. Economy

U.S. Trade Deficit


Donald Trump

To be sure, the impact of Trump's new tariffs (on China) and the new trade deal (with Canada and Mexico) aren't in the data yet. President Trump's trade policy for the first six quarters of his presidency consisted of halting further liberalization (by opting not to participate in the TPP) and a set of fairly narrow, sector specific trade cases (steel, solar, washing machines); the really big shift in policy is only now starting.  

But, well, the trade actions to date haven't come close to achieving the turnaround in manufacturing trade President Trump promised. Imports of manufactures are up significantly. (I forecast out the third quarter based on the first two months of data, if China's September numbers are indicative, I may have been too conservative).

[Graph 1] Cumulative Contribution from Manufac Goods Trade

I used a somewhat unconventional measure to look at changes in the real trade balance. I used the contributions data in the national income and product accounts rather than the trade data directly. And I calculated the contribution each quarter from the national income and product accounts data and then summed the contributions over time. This avoids the difficulties of scaling real trade measures to real GDP (I think) – and takes out the effect of price movement.

This allows me to paint a picture about what is happening to different sectors of the economy—manufacturing for example, petrol, and even services (though there isn't a story in the services data over the past few years)—as well as the overall numbers.*

What jumps out in the data on manufacturing trade? Well, two macroeconomic factors.

One: The dollar's 2014/15 appreciation led export growth to stall, and created a significant drag on the economy at a time when overall demand growth was weak. Falling exports added to the pressure on the manufacturing sector created by the fall in oil and agricultural investment (see Neil Irwin of the New York Times).

Two: Trump's stimulus has, as predicted, supported strong import growth—even in the face of Trump's "America first" trade policy.

Yep, so far Trump's overall policy mix—his combination of stimulative macroeconomic policies and more aggressive trade policy—has delivered a net stimulus of about 1 percent of U.S. GDP to the United States' main manufacturing trade partners. Trump's stimulus—and the still relatively strong dollar—are making German and Chinese exports great (again). In technical terms, the cumulative contribution of trade in core manufactures (capital goods, autos, and consumer goods in the trade data) has been negative 0.9 pp of GDP over the first six quarters of Trump's presidency, and based on the data for the first two months of the third quarter of 2017, the cumulative (negative) contribution will soon be over a percentage point of U.S. GDP.

Germany, Japan, Korea, China and many others certainly don't like Trump's challenge to the existing trade rules. But they all also have—to date—benefited from strong U.S. demand for exports. The recent import surge, when the q3 data is factored in, will have delivered a benefit to them that is roughly comparable in size to the swing associated with the dollar's 2014/15 rise.

We will see what happens when Trump's tariffs on China take place. Import growth could cool—the full tariffs would cover roughly a quarter of U.S. "core" goods imports (imports of consumer goods, capital goods, and autos). However, the net effect of putting tariffs on imports of around 2.5 percent of U.S. GDP depends on how much trade is diverted to other trade partners. And export growth also looks to be slowing on the back of the dollar's strength in the last two quarters, weakness in emerging economies and other countries' retaliation for Trump's trade action. Reducing your imports doesn't improve your trade balance if exports also fall.

At least for now, though, "macro" factors trump "micro" factors. Trump's stimulus has had a far bigger effect on the global economy than Trump's protectionism.

[Graph 2] Contributions from Goods Trade since 2011

Analysts who look at the nominal trade data haven't observed the deterioration in the trade balance that I have highlighted, at least not yet. The current account balance has also stayed relatively constant.

That isn't primarily because of services. Or even because of the income balance, though the surplus generated by the offshore profits of U.S. firms remains large. The main offset to the quite significant widening of the manufacturing deficit over the last four years has been the U.S. oil boom.

Those who argue that the U.S. can never grow through exports (or substituting domestic production for imports) should take close look at the oil sector. Over the last decade, the fall in the real petrol balance (e.g. rising domestic U.S. production relative to U.S. demand) has added close to two percentage points to U.S. growth.   

Final Real Net Petrol Graph 3

The improvement in the real petrol balance over the last six quarters has been about 0.5 pp of GDP (based on cumulative contributions), roughly half the deterioration in the non-oil goods balance.

A payoff from Trump's policy of "energy dominance"? Perhaps. But it is more likely a function of changes in the oil price, and the evolving cost structure of U.S. production. Fracking the Permian basin (in West Texas and New Mexico) has generated an amazing amount of oil, at a fairly low cost. The shale boom started under Obama—not under Trump—and it was initially propelled by a combination of a high global oil price, a weak dollar, and good old-fashioned American ingenuity.

The dominance of macroeconomic factors extends to one other component of the trade balance—tourism (tourism generally accounts for the bulk of the U.S. services surplus with East Asia; many other services, alas, seem to be exported primarily to tax havens***).

U.S. tourism imports (Americans taking vacations abroad) rise when the dollar is strong— and U.S. tourism exports (foreign tourists visiting the U.S.) tend to grow when the dollar is weak (e.g. 2005 to 2014).

Trump's more restrictive immigration policies have added some friction at the border no doubt. But the "stop" in tourism exports actually came in early 2015, six quarters before Trump (and a couple of quarters after the dollar moved).  

[Graph 4] Tourism Exports and the Dollar

One final point: I framed this as an argument that Trump's trade policy hasn't had the expected effect on the trade balance, as the evolution of the trade balance has been driven by macroeconomic factors—the dollar's strength, U.S. demand growth, and foreign demand growth. It equally could be presented as an argument that the overall macroeconomic effect of Trump's coming tariffs will be fairly modest so long as the Fed is free to react to any drag on U.S. activity from the tariffs. The aggregate effect on the economy of even relatively aggressive trade action—as Goldman Sach's economic research team has argued—ends up being fairly small in a standard macroeconomic model, absent a mistake by the Fed or a shock to "confidence." The sectoral effect, of course, remains significant (ask soybean farmers in the Dakotas). And, well, it is also worth remembering that the impact of the tariffs on China would also be expected to induce changes in China's policy mix. If China responds by using fiscal policy to stimulate domestic consumption demand, that's good for the world. But it stabilizes output by loosening monetary policy, that would typically be expected to result in a weaker currency —which would offset some of the impact of the tariff on China while shifting some of the pressure over to China's trade partners.

* Over the grand course of time, the contribution of exports and imports should generally balance out (no country can run a large trade deficit forever, though it is possible to run a modest trade deficit over time so long as the interest rate on a country's external borrowing is modest). A symmetric expansion of trade, if it reflects the healthy development of comparative advantage, raises the overall level of output as both partners specialize in what they do best. Such dynamic gains are by definition not captured in an analysis of the contribution of trade in the national income and product accounts. The national income and product accounts instead draw attention to the impact of trade on demand, and what matters there is the growth of exports relative to imports. Broadly speaking, what the trade data shows is that the U.S. has increasingly specialized in the production of goods and services for the domestic economy, rather than specializing in the production of goods and services for the global market. A drag on demand from trade has a much more negative overall economic impact if it comes at a time when overall demand is weak.

** The q2 data was heavily influenced by both changes in the petrol balance and changes in the food and feeds balance. In fact, the petrol and the "soybean" surge (measured in the food and feed balance) account for the entire increase in U.S. exports in q2. The available data suggests that the surge in soybean exports will reverse itself, but not likely until q4. For my forecast, I assumed 2018 q4 exports fell back to their q4 2017 level. They may be optimistic.

[Graph 6] Real Net Exports

*** I am only partially joking. Ireland is the number one destination for a lot of IPR related service exports, the Caribbean is the number one destination for exports of financial services. See tables 2.2 and 2.3 in the BEA's services trade data.

--
John Case
Harpers Ferry, WV
Sign UP HERE to get the Weekly Program Notes.

The impact of the US-China trade war on East Asia

...for those up to a deep dive into the China trade war dynamics.

The impact of the US-China trade war on East Asia

Massimiliano Calì 15 October 2018

The recent decision of the Trump administration to impose a new round of tariff increases on imports from China has taken the US-China trade dispute to a new level. The new list is subject to a 10 percentage point increase in import tariffs, which would be eventually raised to 25 percentage points at the end of the year. It represents a large expansion in the range of Chinese products included in the first two tranches of US import tariff hikes implemented on 6 July and 23 August. The policy has triggered retaliation. China raised tariffs by 25 percentage points on similar amounts of imports from the US on the same dates that the US tariffs came into force.1   

This protectionist tit-for-tat can have dramatic consequences for the economies of the warring parties, as the experience of the Great Depression illustrates (McDonald et al. 1997, Eichergreen and Irwin 2010). At the same time it can also affect third countries, especially those more economically linked to the US and China. In this column, I provide novel partial equilibrium estimates of the potential trade and investment impacts of the US-China trade dispute, focusing on East Asia.2 Countries in this region are the most exposed to the dispute given their integration with Chinese-led supply chains and the similarity of their export baskets with China. I focus on the impact on these countries of US tariff hikes on Chinese goods.  

Direct trade and investment impacts

I first estimate the expected import response to the tariff increase. To do so I combine HS-8 digit US import data for 2017 from the US Census Bureau of Statistics, HS-6 digit product-level price elasticity of US imports (estimated by Kee et al. 2008) and the published lists of Chinese products subject to the three tranches of US tariffs.3 I assume the price of import to increase proportionately with the tariff, which is then multiplied by the relevant elasticity and the import value to obtain the expected reduction in US import from China.

My calculations suggest that the total US imports from China in the affected products amounted to $234.8 billion in 2017, of which $188.9 billion have been targeted in the last tranche of tariffs (Table 1).4  Based on the data we use, the tariffs would reduce US imports from China by $68.6 billion, equivalent to 13.6% of total US imports from China and 3% of global Chinese merchandise exports. This expected drop in Chinese exports would translate into a reduction in domestic value added by $41.4 billion, a relatively modest 0.3% of Chinese GDP.5 This is an upper bound of the direct impact on Chinese exports, as it does not consider the possible re-direction of these exports towards third markets.

Table 1 Value of US imports from China targeted by the tariff measures

Source: Authors' estimation based on various USTR published documents (see footnote 3 for details) and US import data from US Census Bureau.

The bulk of the affected imports is concentrated in electronic equipment and machinery and their components (Figure 1). Electronic and optical equipment (including TV and sound recording devices) and their components, as well as machinery, boilers and mechanical appliances account for almost half of the expected drop in US imports from China. A significant amount of the import drop is also expected in consumer products, such as furniture, vehicles, leather articles and fish and crustaceans, which may have some direct impact on parts of the US household consumption basket.

Figure 1 Expected drop in US imports from China due to US tariffs hike, by HS-2 digit sector ($ million)

Source: Authors' estimates based on USTR, US Census and Kee et al. (2008)

The upside of the reduction in Chinese exports to the US is the potential diversion of US imports towards non-Chinese suppliers, particularly in East Asia, where export structures present some similarities with China. To get a sense of these potential export opportunities, I identify the Chinese products (at the HS-8 digit level) that are subject to higher tariffs in the US market and which happen to be also exported to the US by other East Asian countries for a value of at least $10 million in 2017. The intuition is that a country which is already exporting a non-negligible amount of the same product to the same market would be more likely to replace an existing exporter in that product-market pair.6

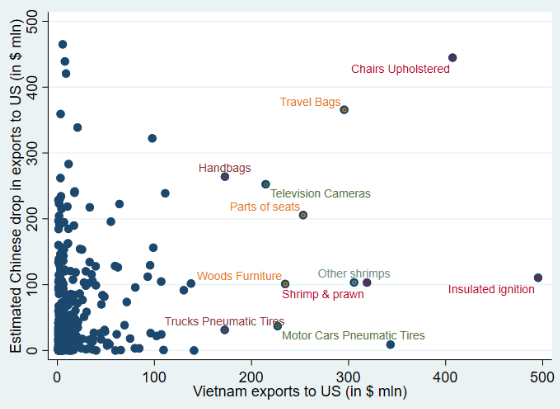
According to this metric, the replacement potential of Chinese exports in the US by East Asian countries – especially emerging economies – is quite significant. Vietnam, the Philippines, and Cambodia are the East Asian countries with the largest replacement potential relative to the size of their economy (Figure 2). The estimated drop in Chinese exports to the US in products which Vietnam already supplies to the  US for at least $10 million is worth 10.9% of Vietnam's GDP, or 4.4% of GDP when considering the associated domestic value added of these exports.7 The largest opportunities lie in those products where both the expected Chinese export drop and the existing Vietnamese exports to the US are large, such as chairs, insulated ignition, shrimp and prawns, travel bags, parts of seats, television cameras, wooden furniture and handbags (Figure 3). A much smaller set of products fulfils these characteristics for Cambodia, including plywood sheets, handbags, travel and sports bags, lighting sets for Christmas trees, dog or cat food, parts of seats and bicycles, reflecting the high concentration of its export basket. Taiwan, Singapore, Malaysia, and Thailand also have non-negligible exports replacement potential. The potential replacement is more limited for Indonesia. The drop of Chinese gross exports in products also exported by Indonesia to the US is worth 1.3% of GDP, with an associated domestic value added of 1.0% of GDP.8

Figure 2 Potential replacement of Chinese exports to the US, by countries (% of GDP)

Source: Authors' estimates based on data from USTR, US Census Bureau, OECD TiVA and Kee et al. (2008)

Figure 3 Main potential products where Vietnam could replace Chinese exports in the US

Source: Authors' estimates based on USTR, US census bureau and Kee et al. (2008)

By raising the cost of serving the US market from China, the trade war could also lead to diversion of investments towards third countries. This diversion would likely concern mainly Chinese investments seeking to by-pass US import tariff hikes. The extent to which investments may relocate towards other countries to serve the US market would partly depend on each country's ability of producing the same set of affected products for the relevant market and perceptions about the duration of the trade war. I measure this ability through the correlation index between the expected drop in US imports from China and US imports from each East Asian country in the HS 8-digit products subject to the tariffs.9 The value of the index is highest for Taiwan, followed by Thailand, Malaysia, Vietnam, and the Philippines (Figure 4). Indonesia and Myanmar have the lowest value of the index. While this ranking tries to capture only one of the several criteria used for investments choices, it is suggestive of the variation in the relative attractiveness across potential destinations for investments based on existing similar export basket as China. 

Figure 4 Degree of similarities of export baskets to the US with China for affected products
(index of correlation at HS-8 digit)

Source: Authors' estimates on the basis of US Bureau Census of Statistics

Indirect trade impact

While China has progressively absorbed large chunks of the value chain in various sectors (Kee and Tang 2016), it still relies on imports of foreign intermediates and final inputs for some of its production. East Asian countries are key suppliers of such intermediates and inputs to China. Hence, the expected drop in Chinese exports to the US may have knock-on effects on these countries via backward linkages. The extent of this impact would depend on what parts of the value chain each country contributes to. This in turn determines what intermediates and raw materials countries provide to China in the production of the products affected by the tariff hike. 

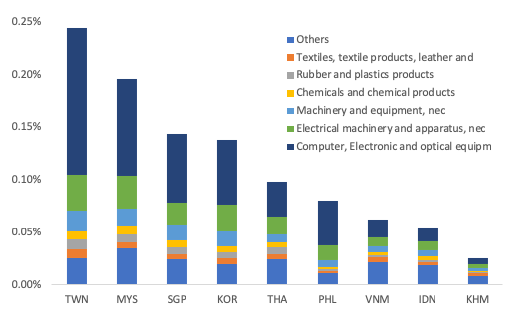
In order to gauge the importance of this channel, I match our estimated drop in Chinese exports at the HS-8 digit level with the country-specific shares of domestic value added in Chinese gross exports to the US in those products (available from OECD TiVA data).10 Taiwan and Malaysia are the East Asian countries that appear most vulnerable to the drop in Chinese exports via the supply chain with an estimated GDP loss of 0.24% and 0.20% respectively (Figure 5). That is mainly due to the countries' provision of inputs for Chinese exports to the US in electronic and optical equipment as well as electrical machinery, which account for two third of this loss. Singapore and South Korea, and Thailand are all expected to lose more than 0.1% of their GDP via this channel, while the effect for Cambodia, Indonesia and Vietnam are relatively muted given the low participation in Chinese-led global value chains. 

Figure 5 Estimated effects of US-China trade war on GDP via supply linkages

Source: Bank staff estimates based on data from USTR, US Census Bureau, OECD TiVA and Kee et al. (2008)

While these negative effects are smaller than the estimated (positive) export replacement potential, the two figures are not necessarily comparable. The latter are upper bound estimates of the potential for replacement. In fact, the true dimension of the replacement effect is likely to be considerably smaller than what is reported in Figure 2 for two reasons: first, each country would compete for the same potential market; second, any such replacement would hinge on the supply response in each country-product pairs, which could be relatively small (and even zero) in many cases. On the other hand, the effects via the supply chain are likely to provide a more precise order of magnitude of the actual losses. 

This type of analysis could help policymakers in East Asia (and beyond) identify the potential winners and losers among domestic producers from the US-China trade war. Governments could help the former replace Chinese exports in the US markets through measures such as facilitating access to imported inputs, which are heavily used by East Asian exporters, and ensuring the availability of finance, including trade finance, required for the additional production and exports. At the same time ,assistance to potential losers to reallocate their production and/or their labour could help minimise the domestic costs of the trade war. 

Author's note: This column does not necessarily reflect the views of the World Bank or of its member countries. The author is grateful to Ndiame Diop and Florian Moelders for useful comments and to Hazmi Ash Sidqi for excellent research assistance.

References

Cadot, O, M D Pierolaand F Rauch(2013), "Success and failure of African exporters", Journal of Development Economics 101: 284-296.

Eichergreen, B and D A Irwin (2010), "The Slide to Protectionism in the Great Depression: Who Succumbed and Why?", The Journal of Economic History 70(4): 871-897.

Kee, H L, A Nicita and M Olarreaga (2008), "Import demand elasticities and trade distortions", Review of Economics and Statistics 90(4): 666-682.

Kee, H L and H Tang (2016), "Domestic Value Added in Exports: Theory and Firm Evidence from China", American Economic Review 106(6): 1402–1436.

McDonald, J A, A P O'Brien and C M Callahan (1997), "Trade Wars: Canada's Reaction to the Smoot-Hawley Tariff", The Journal of Economic History 57(4): 802-826.

Endnotes

[1] Given the large Chinese bilateral trade surplus with the US, the last round of tariffs has been imposed by China on imports from the US worth less than half of the latest list of targeted Chinese exports to the US.

[2] The partial equilibrium analysis allows for highly sectoral disaggregated analysis and it relies on limited data requirement. On the other hand, it does not consider the general equilibrium and the feedback impacts, such as those emanating from the slower growth of China and the US as a result of the tariffs, from the change in international prices of the affected products or from the interactions (and substitutions) between markets.

[3] I estimate a 25 percentage point tariff increase also for the third tranche of US tariff increase. 

[4] Note that this figure is slightly lower than the $200 billion reported by the US government administration in last week's press release.

[5] This figure is obtained by matching the expected export drop with the sector-specific domestic value added in Chinese gross exports to the US derived from the OECD Trade in Value Added database.

[6] Cadot et al. (2013) provide some evidence from African exporters in support of this intuition. The $10 million threshold in existing exports allows to exclude all those products where a country is a marginal supplier to the US, which may make it more challenging to replace Chinese exports in those products. 

[7] To obtain this figure I use the sector-specific domestic value added in Vietnamese gross exports to the US, taken from OECD TiVA data.

[8] The large size of its economy along with the moderate penetration of its products in the US limit the potential replacement impact for Indonesia

[9] The intuition is that export similarity signals the existence in the country of established supply chains as well as the presence of adequate factors to produce the specific products.

[10] This OECD TiVA data is available for 2011 and relies on a much more aggregated level of sectoral breakdown (only 18 macro sectors) than the tariff data. I match the two sectoral classifications using the ISIC Rev. 4 classification as the bridge.

--
John Case
Harpers Ferry, WV
Sign UP HERE to get the Weekly Program Notes.

State, Local Tax Systems Worsening Inequality [feedly]

State, Local Tax Systems Worsening Inequality
https://www.cbpp.org/blog/state-local-tax-systems-worsening-inequality

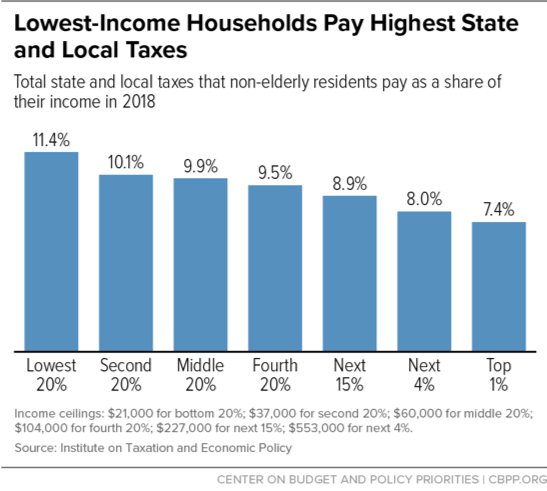
State and local tax systems can be a powerful tool for boosting economic opportunity, creating broadly shared prosperity, and building equitable state economies. But in nearly every state, they're reinforcing and often worsening inequality, as the Institute on Taxation and Economic Policy shows in a new report.


 -- via my feedly newsfeed

Tuesday, October 16, 2018

4,109 More Arkansans Lost Medicaid in October for Not Meeting Rigid Work Requirements [feedly]

4,109 More Arkansans Lost Medicaid in October for Not Meeting Rigid Work Requirements
https://www.cbpp.org/blog/4109-more-arkansans-lost-medicaid-in-october-for-not-meeting-rigid-work-requirements

Some 4,109 Arkansas Medicaid beneficiaries lost coverage on October 1 for not reporting at least 80 hours of work or work-related activities for three months, the state reports. That brings the total to 8,462 beneficiaries who have lost coverage since the state implemented its rigid work requirement.


 -- via my feedly newsfeed

Donald and the Deadly Deniers [feedly]

Donald and the Deadly Deniers
https://www.nytimes.com/2018/10/15/opinion/trump-climate-change-deniers-republican.html

Climate change is a hoax.

Climate change is happening, but it's not man-made.

Climate change is man-made, but doing anything about it would destroy jobs and kill economic growth.

These are the stages of climate denial. Or maybe it's wrong to call them stages, since the deniers never really give up an argument, no matter how thoroughly it has been refuted by evidence. They're better described as cockroach ideas — false claims you may think you've gotten rid of, but keep coming back.

Anyway, the Trump administration and its allies — put on the defensive by yet another deadly climate change-enhanced hurricane and an ominous United Nations report — have been making all of these bad arguments over the past few days. I'd say it was a shocking spectacle, except that it's hard to get shocked these days. But it was a reminder that we're now ruled by people who are willing to endanger civilization for the sake of political expediency, not to mention increased profits for their fossil-fuel friends.

About those cockroaches: Details aside, the very multiplicity of climate-denial arguments — the deniers' story keeps changing, but the bottom line that we should do nothing remains the same — is a sign that the opponents of climate action are arguing in bad faith. They aren't seriously trying to engage with the reality of climate change or the economics of reduced emissions; their goal is to keep polluters free to pollute as long as possible, and they'll grab onto anything serving that goal.   

Still, it's worth pointing out how thoroughly all their arguments have collapsed in recent years.

These days, climate deniers seem to have temporarily backed down a bit on claims that nothing is happening. The old dodge of comparing temperatures to an unusually warm year in 1998 to deny that the planet is getting warmer — which is like comparing days in early July with a warm day in May, and denying that there's such a thing as summer — has been undermined by a string of new temperature records. And massive tropical storms fed by a warming ocean have made the consequences of climate change increasingly visible to the public.

So the new strategy is to downplay what has happened. Climate change models "have not been very successful," declared Larry Kudlow, the top White House economic adviser. Actually, they have: Global warming to date is well in line with past projections. "Something's changing and it'll change back again," asserted Donald Trump on "60 Minutes," based upon, well, nothing.

Having grudgingly conceded that maybe the planet is indeed getting a bit warmer, the climate deniers claim to be unconvinced that greenhouse gases are responsible. "I don't know that it's man-made," said Trump. And while he has sort-of-kind-of backed down on his earlier claims that climate change is a hoax concocted by the Chinese, he's still seeing vast conspiracies on the part of climate scientists, who he says "have a very big political agenda."

Think about that. Decades ago experts predicted, based on fundamental science, that emissions would raise global temperatures. People like Trump scoffed. Now the experts' prediction has come true. And the deniers insist that emissions aren't the culprit, that something else must be driving the change, and it's all a conspiracy. Come on.

Why, it's as if Trump were to suggest that the Saudis had nothing to do with the disappearance of Jamal Khashoggi, who vanished after entering a Saudi embassy — that he was killed by some mysterious third party. Oh, wait.  

Finally, about the cost of climate policy: I've noted in the past how strange it is that conservatives have total faith in the power and flexibility of market economies, but claim that these economies will be completely destroyed if the government creates incentives to reduce greenhouse gas emissions.

Apocalyptic claims about the cost of reducing emissions are especially strange given tremendous technological progress in renewable energy: The costs of wind and solar power have plummeted. Meanwhile, coal-fired power plants have become so uncompetitive that the Trump administration wants to subsidize them at the expense of cleaner energy.

In short, while the arguments of climate deniers were always weak, they've gotten much weaker. Even if you were genuinely persuaded by the deniers five or 10 years ago, subsequent developments should have made you reconsider.

In reality, of course, climate denial has never had much to do with either logic or evidence; as I said, deniers are clearly arguing in bad faith. They don't really believe what they're saying. They're just looking for excuses that will let people like the Koch brothers keep making money. Besides, liberals want to limit emissions, and modern conservatism is largely about owning the libs.

One way to think about what's happening here is that it's the ultimate example of Trumpian corruption. We have good reason to believe that Trump and his associates are selling out America for the sake of personal gain. When it comes to climate, however, they aren't just selling out America; they're selling out the whole world.

Follow The New York Times Opinion section on Facebook and Twitter (@NYTopinion), and sign up for the Opinion Today newsletter.

Paul Krugman has been an Opinion columnist since 2000 and is also a Distinguished Professor at the City University of New York Graduate Center. He won the 2008 Nobel Memorial Prize in Economic Sciences for his work on international trade and economic geography. @PaulKrugman


 -- via my feedly newsfeed

Piketty: Brazil: the First Republic under threat [feedly]

Brazil: the First Republic under threat
http://piketty.blog.lemonde.fr/2018/10/16/brazil-the-first-republic-under-threat/#xtor=RSS-32280322

Brazil: the First Republic under threat

In the United States, it was not until the mid 1960s that the former slaves finally obtained the right to sit in the same buses as whites, to go to the same schools and, at the same time, accede to the right to vote. In Brazil, the right to vote for the poor dates from the 1988 constitution, just a few years before the first multi-racial elections in South Africa in 1994.

The comparison may shock: the population in Brazil is much more mixed than the two other countries. In 2010, in the last census, 48% of the population declared themselves to be 'white', 43% 'mixed', 8% 'black' and 1% 'Asian' or 'natives'. In reality, more than 90% of Brazilians are of mixed origin. The fact remains that social and racial divisions are closely linked. While Brazil is not a country devoid of racism, it is sometimes described as the country of « cordial racism ». This is also a country where democracy is recent and fragile and at the moment is faced with a very serious crisis.

Brazil abolished slavery in 1888, at a time when the slaves still represented 30% of the population in some provinces, particularly in the sugar growing regions in the North East. Apart from the extreme case of slavery, this is a country where labour relations have long been extremely hard, in particular between the landowners and agricultural labourers or landless peasants. On the political level, the 1891 constitution was careful to specify that non-literate people would not have the right to vote, a rule that was also incorporated into the constitutions of 1934 and 1946. This permitted the exclusion of 70% of the adult population from the participation in the electoral process in 1890, and still over 50% in 1950 and 20% in 1980. In practice these were not only former slaves but more generally the poor who were thus excluded from the political scene for a century. In comparison, India had no hesitation in implementing genuine universal suffrage as from 1947, despite the huge social and status divisions inherited from the past and the immense poverty of the country.

In Brazil, despite the political exclusion of the illiterate no proactive education policy was implemented. The reason why inequality has remained so widespread in the country is primarily because the property-owning classes have never really attempted to reverse the heavy historical legacy. The quality of the public services and schools open to the majority has long remained extremely inadequate and is still insufficient today.

It was not until the end of the military dictatorship (1964-1985) and the 1988 constitution that voting rights were extended to all, with no educational stipulations. The first universal suffrage presidential election took place in 1989 and Lula, a former lathe operator, reached the second round and obtained 47% of the votes. His electoral success in 2002 with 61% of the votes in the second ballot, then his re-election in 2006 with the same score, – the candidate who had been ridiculed because of his lack of education and who was said not to be capable of representing the country abroad appropriately, marked the symbolic entry of Brazil into the era of universal suffrage. On the contrary, the election of Bolsonaro would signify a terrible regression and would go beyond the normal changeover following the new victories obtained by the Workers' Party (PT) and Dilma Roussef (56% in 2010, 52% in 2014) with an electorate increasingly divided socially, racially and geographically (see this research by Amory Gethin on the evolution of electoral cleavages in Brasil).

The representative from Rio is a militarist, a macho and homophobic; he is also anti-social and anti-poor, as witness his ultraliberal economic programme. He also rides the wave of nostalgia for the reign of the white man, in a country where the 'whites' have now ceased to be the majority (they still accounted for 54% in the 2000 census). Given the questionable circumstances of the deposition of Roussef in 2016 and the obstruction of Lula in 2018, this election runs the risk of leaving dreadful traces.

When in power the PT put in a credible performance. Thanks to the rise in minimum wage and the new system of family allowances (Bolsa Familia), economic growth was accompanied by an unexpected fall in poverty. The PT also set up schemes for preferential access to the universities for the working classes and the black and mixed populations. But for lack of reform in the electoral system, the PT never succeeded in attacking the structural fiscal backwardness of the country (indirect taxes rise to 30% on electricity bills, whereas top inherited wealth is taxed at 4%). The result is that the reduction in inequality has been made at the expense of the middle classes and not the richest categories (see this  research by Marc Morgan on the evolution of inequalities in Brasil, from which the figures reproduced on this post are extracted).

When the progressive forces have succeeded in reducing inequalities in the 20thcentury, it is because they fought for an ambitious, egalitarian agenda based on political reforms while at the same time implementing fiscal and social reforms. In the United States the 1913 constitution had to be amended to create a federal income and inheritance tax, which became the most progressive of its kind in history and enabled the financing of the New Deal. In the United Kingdom, the veto of the House of Lords had to be ended, and in France that of the Senate, failing which the social reforms in 1945 would never have seen the light of day. Today, the progressive forces refuse any sort of ambitious discussion on the democratisation of American, European or Brazilian institutions. However, it is not by leaving the monopoly of breaking with the past to the nativists or the reactionaries that equality and democracy will be saved.


 -- via my feedly newsfeed

Monday, October 15, 2018

What does “full employment” mean in the era of anchored inflation expectations? [feedly]

This a wonky approach,. but the concept of sustainable "full employment" is an important one for policy for any economy still trading to any significant degree in commodities. Some socialists may bypass this as irrelevant for a command economy. ONly -- that last phrase is turns out to be founded on a fiction: commodities cannot be dismissed by command wherever scarcity in the ants of life prevails


What does "full employment" mean in the era of anchored inflation expectations?
http://jaredbernsteinblog.com/what-does-full-employment-mean-in-the-era-of-anchored-inflation-expectations/


There's a new analysis out by a group of economists from the Goldman Sachs economic research team that raises the question of what the concept of full employment means in an era when the central bank extends significant and successful efforts to anchor inflationary expectations.

The paper (which lives behind a paywall) uses four distinct techniques to to derive different estimates of the natural rate of unemployment, aka u*, aka the lowest unemployment rate consistent with stable inflation. The results range from 4 to 4.8 percent, which, as their figure below shows, fit well within other commonly sourced versions, including CBO (4.6 percent) and the Fed (4.5 percent). Note also their forecast for the jobless rate to get to 3 percent (!) by the end of next year. As they say in the old country: "from their lips to Keynes' ears."

Source: GS Research

For those who are interested, I've pasted in their table at the end of this post which briefly describes their four methods and results, but anyone who still subscribes to Phillips Curve notions of full employment might well ask: "why, if the current unemployment rate is below all these estimates of the natural rate, is there so little acceleration in core inflation?" Here is their conclusion (my italics):

"The actual unemployment rate is already below all of these estimates, and we expect it to fall all the way to 3% in early 2020.  But…such a scenario is not as dramatic as it sounds: with well-anchored inflation expectations, a labor market overshoot is likely to result in above-target inflation, but not persistently accelerating inflation.  This is an important difference with the late 1960s, when labor market overheating led to runaway inflation."

Now, one of my constant refrains these days is that the Fed's 2 percent is an average target, not a ceiling. Given the many years of downside misses on the inflation target, we're long overdue for a period of "above-target inflation." So, if these analysts are correct, as I suspect they are, then this overshoot is a feature, not a bug.

If that's true—if an unemployment rate significantly below the Fed's natural rate estimate means we get something we very much want (super tight labor markets) as opposed to something we very much do not (spiraling inflation)—then, conditional on inflationary expectations remaining well-anchored, being above full employment is precisely where we should aspire to be.

This is an awfully different economic model. In this model, go ahead and bang out estimates of the natural rate if you must, but recognize that (u-u*)<0 (actual unemployment below your estimate) is not a signal to hit the growth brakes. In this model, your real job is to watch the indicators of inflation expectations and realizations. And if, as is currently the case, they seem well-contained, then there's no reason to overreact.

One interesting aspect of this conclusion is that those of us who have criticized the Fed's anchoring as being a drag on demand relative to more flexible inflation or level targeting (I'm talking to you, Beckworth) might consider that at least under this framework, solid anchoring enables stronger demand and lower unemployment than would otherwise prevail.

However, for those who benefit the most from such low unemployment to realize such gains, the members of the FOMC would have to recognize these dynamics. I actually think Chair Powell does, and he's not alone, but there are others who look at that 3 percent at the end of the figure above and think, "not on my watch!"

Source: GS Research


 -- via my feedly newsfeed