Saturday, July 21, 2018

Trade agreements and global production

Trade agreements and global production

Edith Laget, Alberto Osnago, Nadia Rocha, Michele Ruta 14 July 2018


Europe and North America are entangled in discussions to reverse or renegotiate existing trade agreements (Brexit, NAFTA), but other regions of the world are moving in the opposite direction. Examples include the Comprehensive and Progressive Agreement for a Trans-Pacific Partnership (CPTPP), the Regional Comprehensive Economic Partnership (RCEP) between China, ASEAN countries and other regional partners, and the African Continental Free Trade Area (AfCFTA). 

An important question is how these agreements, made and unmade, will shape future trade and economic relations. Recent studies have investigated the effect of trade agreements on trade flows (Baier et al. 2017, Mattoo et al. 2017). In our research (Laget et al. 2018), we use new data on the content of trade agreements to assess their effects on countries' participation in global value chains (GVCs).1

Preferential trade agreements (PTAs) have become deeper over time, often going beyond traditional trade policy to encompass areas such as investment, competition, and intellectual property rights protection. To estimate the relationship between cross-border production linkages and the depth of trade agreements, we use a structural gravity model at the aggregate and sectoral levels. PTA depth measures are based on the new World Bank dataset on the content of PTAs, which covers 260 agreements signed by around 180 countries between 1958 and 2015 (Hofmann et al. 2018). This is the entire realm of PTAs in force and notified to the WTO as of December 2015. 

Cross-border production linkages are measured in two ways: 

  • We use value-added trade measures from Wang et al. (2012) based on the World Input Output data set (WIOD). 
  • We use data from UNCOMTRADE on bilateral trade in parts and components. This records gross trade flows, which can be subject to double-counting, but it has the advantage of being available for the full set of countries and years covered by the new data set on PTAs.

Deep trade agreements promote global value chain participation

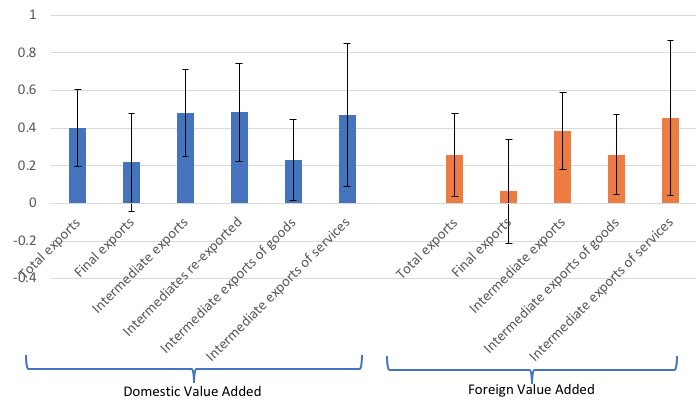
Using value added trade data, we find that deep PTAs increase the domestic value-added content of exports, mainly through global value chains. Figure 1 shows that adding a provision to a PTA boosts domestic value added of intermediate goods and services exports (in other words, forward GVC linkages) by 0.48%, while an additional provision in a PTA increases foreign value added of intermediate goods and services exports (backward GVC linkages) by 0.38%. We also find evidence that deep trade agreements improve forward linkages particularly for more complex GVCs, that is, GVCs for which exported intermediates cross borders two times or more. We do not find a significant impact of deep trade agreements on domestic and foreign value added of final goods and services exports. We make separate estimations for services and goods to show that the impact of deep trade agreements is usually higher for value-added trade in services than value-added trade in goods. 

Figure 1 Effect of deep trade agreements on GVC integration
Source: Laget et al. (2018).
Notes: The estimator is PPML. All specifications include bilateral fixed effects and country-time fixed effects. The 90% confidence intervals are constructed using robust standard errors, clustered by country-pair.

Deep trade agreements help countries integrate in high-value added industries

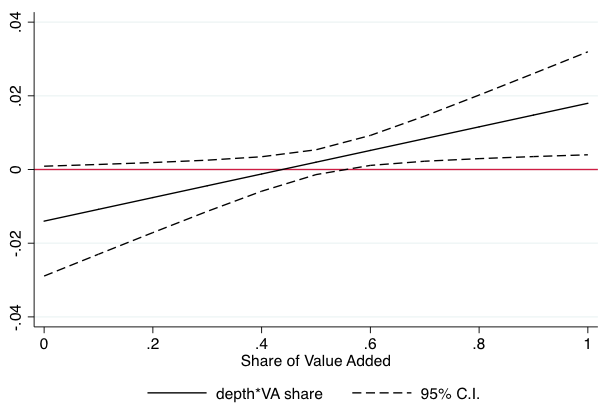
We also analyse whether the impact of deep trade agreements on GVC integration is heterogeneous across industries. Specifically, we estimate a set of sectoral regressions, including an interaction term between the depth of an agreement and the share of value added that a sector has in overall production. The results suggest that deep trade agreements are particularly relevant for GVC integration in high value-added industries (Figure 2). Not surprisingly, these industries are usually services sectors, which are characterised by non-tangible activities such as research and development or retail services that have high value added. 

Figure 2 Marginal effect of additional provision in terms of average share of value added
Source: Laget et al. (2018).

Trade agreements matter to different countries for different reasons 

Finally, we focus on the larger sample of country data available for trade in parts and components to empirically explore whether the impact of different provisions is heterogeneous across countries with different levels of development. We split the provisions covered in PTAs into two categories, depending on their relationship with WTO rules (Horn et al. 2010). 

'WTO plus' provisions fall under the current mandate of the WTO (for example, tariffs and customs) and are already subject to some form of commitment in WTO agreements. 'WTO extra' provisions, on the contrary, refer to policy obligations outside the current mandate of the WTO (for example, investment, competition). The estimates suggest that WTO extra provisions are particularly important for GVC-related trade between North and South countries. On the other hand, WTO plus provisions are still relevant for trade among developing countries (South-South agreements). 

Deep agreements

Since the early 1990s, governments have signed progressively deeper trade agreements, and firms have fragmented production internationally. Our research finds that the deepening of the trade arrangements has been a key factor in the rise of global value chains. It has also helped countries to integrate in industries with higher values of production. These results indicate that the reshaping of international trade policy relationships we are observing today may have far-reaching consequences for the organisation of production in the future. 

References

Baier, S, Y Yotov, T Zylkin (2017), "One size does not fit all: On the heterogeneous impact of free trade agreements", VoxEU, 28 April. 

Dhingra, S, R Freeman, E Mavroeidi (2018), "Beyond tariff reductions: The effect of deep provisions on gross and value-added trade", VoxEU, 30 March. 

Hofmann, C, A Osnago, M Ruta (2018), "The Content of Preferential Trade Agreements", forthcoming, World Trade Review.

Horn, H, P C Mavroidis, and A Sapir (2010), "Beyond the WTO? An Anatomy of EU and US Preferential Trade Agreements", The World Economy 33: 1565-1588.

Laget, E, A Osnago, N Rocha, M Ruta, (2018), "Deep Trade Agreements and Global Value Chains", World Bank policy research working paper 8491.

Mattoo, A, A Mulabdic, M Ruta (2017), "Deep Trade Agreements As Public Goods", VoxEU, 12 October. 

Mulabdic, A, A Osnago, M Ruta (2017), "Trading off a 'soft' and 'hard' Brexit", VoxEU, 23 January.

Endnotes

[1] See also the related works by Mulabdic et al. (2017) and Swati et al. (2018) that discuss how Brexit will affect UK value chains under different post-Brexit trade arrangements.


--
John Case
Harpers Ferry, WV
Sign UP HERE to get the Weekly Program Notes.

Friday, July 20, 2018

qhfrtfwky Hello jcase@amfam.com

hzfze
cdrwnbl We sell E-mail databases from $10 per country. qhhj
qiglezx
ejbyvebwt $450 for the whole WORLD. [ryaop]
bguzfspi
wactnsm For marketing, advertising, newsletters. [fiucvu]
drhujlrn
npcwau Our contacts: andrey100077@gmail.com vpzkat
mgcyvoa
rjizr

Russia is dumping US Treasuries. Will China be next?


----
Russia is dumping US Treasuries. Will China be next? // Asia Times
http://www.atimes.com/article/russia-is-dumping-us-treasuries-will-china-be-next/amp/

Moscow is offloading dollar assets at a record pace amid questions about how Beijing will respond to escalating trade war

The post Russia is dumping US Treasuries. Will China be next? appeared first on Asia Times.


----

Read in my feedly.com

Tuesday, July 17, 2018

Recovery Radio:Recovery Radio: Recovery Ready Communities

John Case has sent you a link to a blog:


Blog: Recovery Radio
Post: Recovery Radio: Recovery Ready Communities
Link: http://recovery.enlightenradio.org/2018/07/recovery-radio-recovery-ready.html

--
Powered by Blogger
https://www.blogger.com/

Monday, July 16, 2018

Recovery Radio:Recovery radio -- Medically assisted Treatment

John Case has sent you a link to a blog:


Blog: Recovery Radio
Post: Recovery radio -- Medically assisted Treatment
Link: http://recovery.enlightenradio.org/2018/07/recovery-radio-medically-assisted.html

--
Powered by Blogger
https://www.blogger.com/

The Real Driver of Health Care Spending


Edward M Murphy 

via Portside

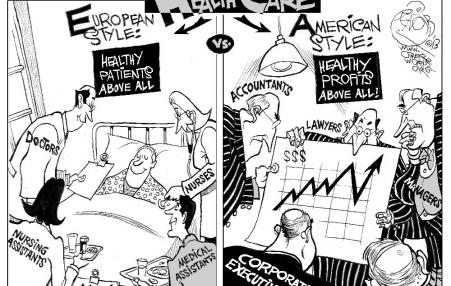
An inefficiency gap is boosting costs — and profits

, Khalil Bendib / Other Words


THE HEALTH CARE DEBATES that occurred in Washington over the past year were largely irrelevant to what's happening in the health care marketplace. Republicans couldn't repeal the Affordable Care Act but they made some changes that weakened it. Those changes will increase insurance premiums in the individual market but they do nothing to address the most significant trends that are evolving across the system. To understand the important trends, one must look elsewhere.

In March, three researchers from the Harvard T. H. Chan School of Public Health published a study in JAMA analyzing the well-known reality that the United States spends dramatically more on health care than other wealthy countries. They compared the US, where health care consumes 17.8 per cent of gross domestic product, to 10 comparable nations where the mean expenditure is 11.5 percent. Despite spending much less, the other countries provide health insurance to their entire populations and have outcomes equal to or better than ours. The researchers found that this inefficiency gap is primarily driven by two characteristics of the US system: the high cost of pharmaceuticals and inordinate administrative expenses.

For example, annual per capita pharmaceutical expenditure in the US is $1,443 as compared to an average of $749 in the 10 other countries. Our administrative costs consume 8 percent of total spending as compared to a range of 1 to 3 percent elsewhere. No one else is close on either of these measures.

The high administrative spending derives in large part from the fact that 55 percent of the people in the US are covered by private health insurers who embed their own billing requirements, expenses, and profit into the system. The next highest country in this regard is Germany, where 10.8 percent of the population is covered by private insurers. In many countries, there are no such middlemen.

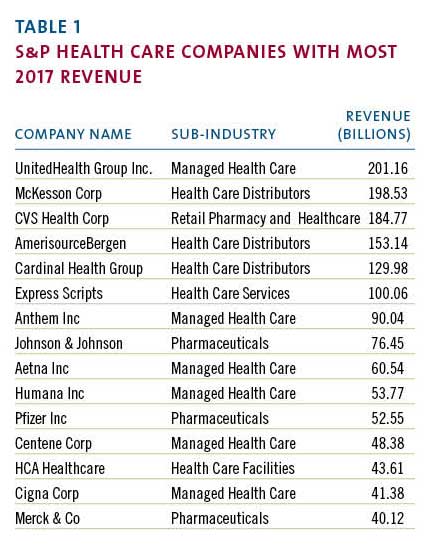
Coincidentally, when the JAMA study was published, the large publicly traded health care companies that dominate the US market had just finished disclosing their 2017 financial results. Examining those results provides additional insight into the economic forces that make our system so expensive and inefficient. The scale of the money involved is sometimes hard to grasp. The largest health care corporations, those included in the S&P 500, had almost $2 trillion in revenue last year. (Table 1)

Most of these enormous companies are engaged in one of two businesses: they're either selling drugs or they're selling health insurance. The excess costs reported by the Harvard researchers serve mainly to support the revenue of the companies in those fields.

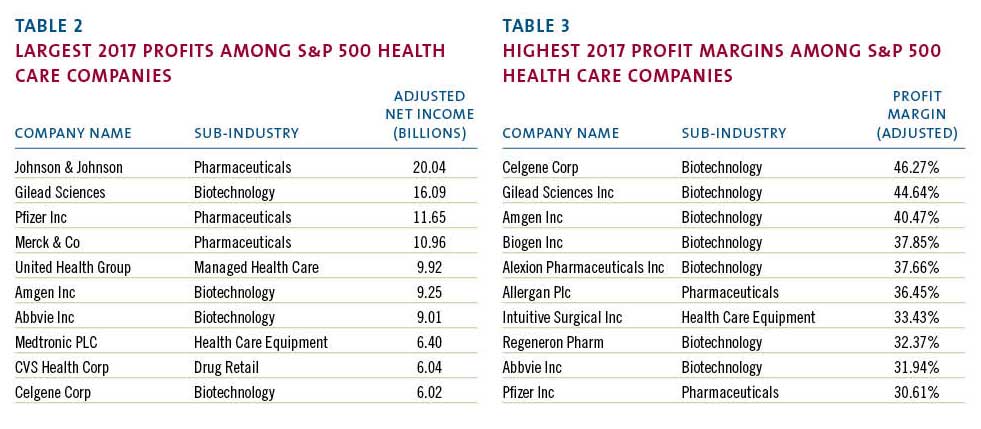
The 2017 reporting of corporate profits was complicated by the passage of the new tax bill. But most companies also reported "adjusted net income," which shows their normalized profits after accounting for the one-time impact of the tax law. The chart below (Table 2) uses the adjusted numbers to show the largest annual profits among S&P health care companies.

Health insurers such as United Health and retailers such as CVS have enormous revenue and impressive profits but, when profit is measured as a percentage of revenue, they can't compete with biotech and pharma. The highest relative profitability, using the same reported adjusted results, is in the chart below. (Table 3)

These profit margins show that there are many situations where between a third and a half of every dollar spent on a prescription drug falls to the bottom line of the of the company that made it. This profit derives in large part from the enormous difference in drug prices in the US versus other countries where such prices are more effectively controlled.

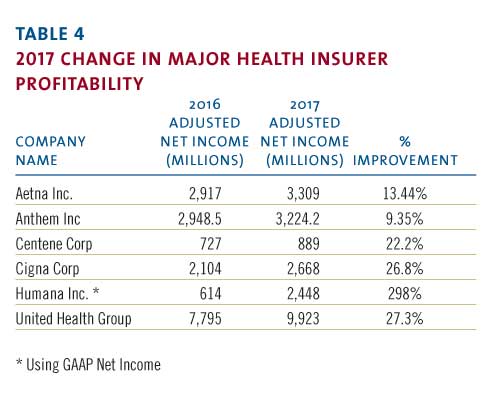
The high administrative cost of the US system stems from the large portion of the market dominated by insurance companies looking to maximize their profits.  Notwithstanding many news stories about turmoil in the insurance markets, 2017 was a banner year for the largest health insurers. The big players all had significant increases in annual profitability in 2017.

Note that Humana did not report "adjusted" numbers even though its profit was swollen by unusual events. A major distortion was a huge break-up fee the company received from a failed merger. That accounted for approximately $630 million in after-tax profit. Even discounting that, it was a very good year.

The revenue and profitability of these corporations support the proposition that high pharmaceutical prices and insurance-related administrative costs account for much of the extraordinary expense of our system. US health policy, or the absence thereof, has enabled these businesses annually to drive costs up for the benefit of their bottom line. That effect will continue. Not surprisingly, the big health care companies are developing new strategies to enhance their businesses and drive their profits going forward.

The term now heard often among health care giants is "vertical integration," which means combining upstream suppliers with downstream buyers to control the flow of business. If this strategy persists, health care delivery will evolve significantly although it is unlikely to become less expensive. The most prominent current example of  vertical integration is the planned $68 billion acquisition of Aetna by CVS.

How would these companies work together? A Wall Street analyst recently described the vision as a way to "identify high risk patients and preemptively get them into a Minute Clinic." Thus, your health insurer could send you to a local store for diagnosis, treatment, drugs, and anything else you might need from the shelves. This will keep even more of the health care dollar under their control.

Similarly, Cigna is in the process of acquiring Express Scripts, a huge pharmacy benefits manager, for $54 billion, another attempt to bring more services under one roof. The combined company would have annual revenue of $142 billion and, presumably, enough leverage with drug companies to improve profits although not necessarily to lower costs to patients. United Health, a leader of vertical integration, previously bought a pharmacy benefit manager but co-pays and deductibles for its patients have continued to climb. United has aggressively acquired physician practices in recent years and is now in the process of buying DaVita Medical Group, which operates nearly 300 clinics and outpatient surgical centers.

More striking are reports of a potential but unsigned merger of Walmart and Humana, a combined company that would have revenue of $550 billion. Walmart is a large operator of retail pharmacies inside its stores and the logic is similar to the Aetna-CVS deal. Humana, a huge insurer, is separately in the process of acquiring a large home health business from Kindred so this could represent yet another level of vertical integration.

If this course continues, the health care system will evolve quickly, giving fewer and larger companies even more market leverage. Integration of this kind benefits the large corporations that initiate it but there is no evidence it will lead to lower costs, improved access, or enhanced quality. These changes are driven by highly focused corporate financial interests and are occurring without reference to public policy. That's because there is no coherent public policy to guide these changes.

On May 11, President Trump made a long-awaited speech to reveal what he described as "the most sweeping action in history to lower the price of prescription drugs for the American people." His typically firebrand language struck at "drug makers, insurance companies, distributors, pharmacy benefit managers, and many others" who contributed to "this incredible abuse." His attack seemed to target the large public companies that have benefited from the abuse. Unsurprisingly, his speech did not include specifics. His staff then released tepid policy details, which immediately generated a significant upward spike in the biotech stock index as well as the stock prices of other large health care companies. For all the presidential bombast, investors saw Trump's policy for what it is: indifference to the current path and no threat to high prices.

It is not in the interest of huge profit-making corporations to restrain the overall cost of the US health care system. In fact, their interest is served by driving health care expenditures higher. When combined with the spending analysis provided by researchers, the financial data disclosed by public corporations point to a path that the country must follow to make our system more coherent and less costly. Any progress will require driving down pharmaceutical pricing and reducing administrative costs imposed by middlemen. We are not doing that yet but, ultimately, we must.

Edward M. Murphy worked in state government from 1979-1995, serving as the commissioner of the Department of Youth Services, commissioner of the Department of Mental Health, and executive director of the Health and Educational Facilities Authority. He recently retired as CEO and chairman of one of the country's largest providers of services to people with disabilities. The author is grateful for the assistance of Zachary Curtis in gathering financial information for this article. Curtis graduated in May from the business school at Bridgewater State University where Murphy is a trustee


--
John Case
Harpers Ferry, WV
Sign UP HERE to get the Weekly Program Notes.

Saturday, July 14, 2018

THE ECONOMIC CONSEQUENCES OF TRUMP’S TRADE WAR

ERKELEY – US President Donald Trump's phony, blowhard's trade war just got real.

THE ECONOMIC CONSEQUENCES OF TRUMP'S TRADE WAR

Jul 12, 2018  asks why the effect of escalating protectionism on investment and financial markets has been so limited.

10Add to Bookmarks

The steel and aluminum tariffs that the Trump administration imposed at the beginning of June were important mainly for their symbolic value, not for their real economic impact. While the tariffs signified that the United States was no longer playing by the rules of the world trading system, they targeted just $45 billion of imports, less than 0.25% of GDP in an $18.5 trillion US economy.

On July 6, however, an additional 25% tariff on $34 billion of Chinese exports went into effect, and China retaliated against an equivalent volume of US exports. An angry Trump has ordered the US trade representative to draw up a list of additional Chinese goods, worth more than $400 billion, that could be taxed, and China again vowed to retaliate. Trump has also threatened to impose tariffs on $350 billion worth of imported motor vehicles and parts. If he does, the European Union and others could retaliate against an equal amount of US exports.

We are now talking about real money: nearly $1 trillion of US imports and an equivalent amount of US export sales and foreign investments.

The mystery is why the economic and financial fallout from this escalation has been so limited. The US economy is humming along. The Purchasing Managers' Index was up again in June. Wall Street has wobbled, but there has been nothing resembling its sharp negative reaction to the Smoot-Hawley Tariff of 1930. Emerging markets have suffered capital outflows and currency weakness, but this is more a consequence of Federal Reserve interest-rate hikes than of any announcements emanating from the White House.

There are three possible explanations. First, purchasing managers and stock market investors may be betting that sanity will yet prevail. They may be hoping that Trump's threats are just bluster, or that the objections of the US Chamber of Commerce and other business groups will ultimately register.1

Second, the markets may be betting that Trump is right when he says that trade wars are easy to win. Other countries that depend on exports to the US may conclude that it is in their interest to back down. In early July, the European Commission was reportedly contemplating a tariff-cutting deal to address Trump's complaint that the EU taxes American cars at four times the rate the US taxes European sedans.But this ignores the fact that Trump's tariff talk is wildly popular with his base. One recent poll found that 66% of Republican voters backed Trump's threatened tariffs against China. Trump ran in 2016 on a protectionist vow that he would no longer allow other countries to "take advantage" of the US. His voters expect him to deliver on that promise, and he knows it.

But China shows no willingness to buckle under US pressure. Canada, that politest of countries, is similarly unwilling to be bullied; it has retaliated with 25% tariffs on $12 billion of US goods. And the EU would contemplate concessions only if the US offers some in return – such as eliminating its prohibitive tariffs on imported light pickup trucks and vans – and only if other exporters like Japan and South Korea go along.

Third, it could be that the macroeconomic effects of even the full panoply of US tariffs, together with foreign retaliation, are relatively small. Leading models of the US economy, in particular, imply that a 10% increase in the cost of imported goods will lead to a one-time increase in inflation of at most 0.7%.

This is simply the law of iterated fractions at work. Imports are 15% of US GDP. Multiply 0.15 by 0.10 (the hypothesized tariff rate), and you get 1.5%. Allow for some substitution away from more expensive imported goods, and the number drops below 1%. And if growth slows because of the higher cost of imported intermediate inputs, the Fed can offset this by raising interest rates more slowly. Foreign central banks can do likewise.

Still, one worries, because the standard economic models are notoriously bad at capturing the macroeconomic effects of uncertainty, which trade wars create with a vengeance. Investment plans are made in advance, so it may take, say, a year for the impact of that uncertainty to materialize – as was the case in the United Kingdom following the 2016 Brexit referendum. Taxing intermediate inputs will hurt efficiency, while shifting resources away from dynamic high-tech sectors in favor of old-line manufacturing will depress productivity growth, with further negative implications for investment. And these are outcomes that the Fed cannot easily offset.

So, for those who observe that the economic and financial fallout from Trump's trade war has been surprisingly small, the best response is: just wait


--
John Case
Harpers Ferry, WV
Sign UP HERE to get the Weekly Program Notes.