Yet More Scary Graphs of Manufacturing: Midwest Edition
In every single state in the Great Lakes region, save Michigan, manufacturing employment has either peaked or (charitably) gone on a growth hiatus.
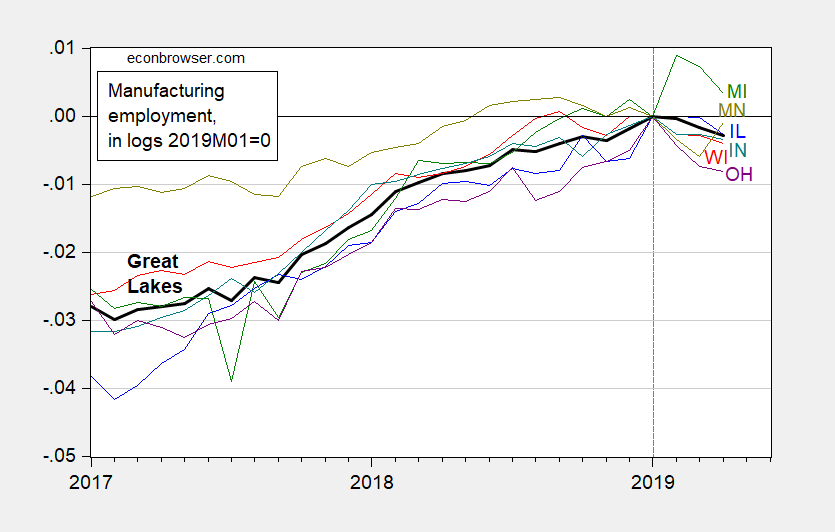
Figure 1: Manufacturing employment by state, in logs, 2019M01=0. Source: BLS, and author's calculations.
While national manufacturing is still rising (albeit very slowly, essentially flat), it remains less than 0.1% above January levels. And manufacturing employment continues to grow in California (interestingly, a state — California — by the metrics of the Arthur Laffer-Stephen Moore-John Williams – ALEC economic outlook ranking should be doing very badly is still growing).
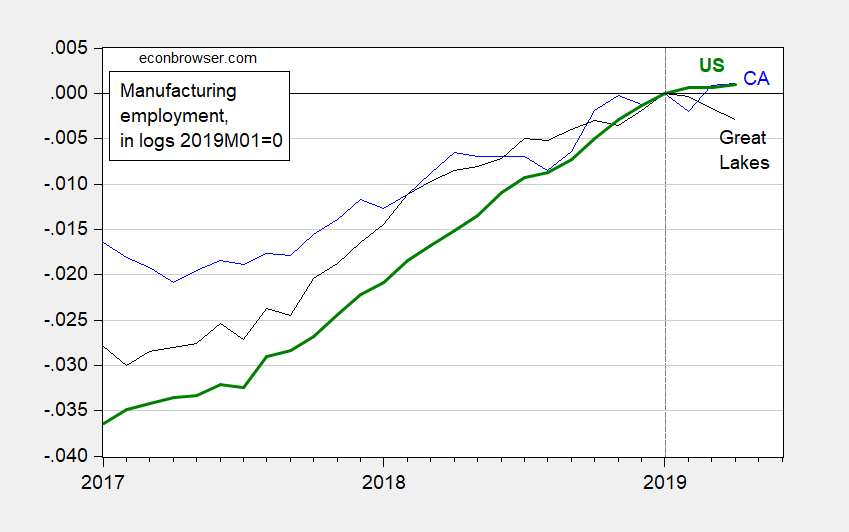
Figure 2: Manufacturing employment by state, in logs, 2019M01=0. Source: BLS, and author's calculations.
Post navigation
Internal IRS Memo on Whether IRS Can Refuse Congressional Subpoena of a Tax ReturnInversion (Again)!43 thoughts on "Yet More Scary Graphs of Manufacturing: Midwest Edition"
John Case
Harpers Ferry, WV
Harpers Ferry, WV
The Enlighten Radio Player Stream,
Sign UP HERE to get the Weekly Program Notes.
Check out Socialist Economics, the Enlighten Radio website

Dear Folks,
A brief response to PGL and others. Lots of people read more than newspapers. If this administration is favoring Russia, good by good, (and yes, I am not discriminating between production by a firm headquartered here which produces in Germany and a firm which produces here, because they can be moved as foreign direct investment, which is already happening to some extent), it is also favoring other states besides the Midwest. OFII can be disputed about FDI figures, but see
https://siteselection.com/issues/2019/mar/south-carolina-the-souths-magnet-for-foreign-direct-investment.cfm
and in particular:
"In fact, international companies operating in states like Florida, Iowa, Michigan, North Carolina and Ohio have grown their manufacturing workforce by more than 20 percent over that period."
and
"10 States with the Fastest FDI Employment Growth Rate Over the Past Five Years: Utah (45.7 percent), Florida (43.8 percent), Tennessee (41.3 percent), Oregon (41.0 percent), Michigan (39.7 percent), Kentucky (37.1 percent), Mississippi (36.3 percent), South Dakota (36.0 percent), Missouri (35.0 percent) and Arizona (34.8 percent). The national average is 24.4 percent.
Leading American Manufacturing: International companies were responsible for 62 percent of U.S. manufacturing job growth, contributing 377,200 of the 606,000 net manufacturing job gains made from 2011 to 2016 (latest available data). The 10 states with the fastest FDI manufacturing growth rate include: Rhode Island, South Dakota, Oregon, Michigan, Kentucky, Nebraska, Iowa, Tennessee, Utah and Minnesota."
Are they analyzing the latest data? No. And you can look at the same figures and see employment growth over 2008-2016 and see Ohio and Michigan, depending on what metric you use, as above. But the primary states where manufacturing growth is taking place, with exceptions, are not in the Midwest.