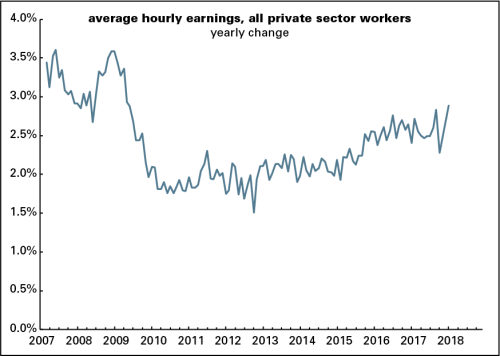
Here's a graph of the yearly growth in AHE.

You may notice that this series begins in March 2007. That's because the Bureau of Labor Statistics (BLS) only started reporting hourly earnings for "all workers" in March 2006. It has been reporting monthly AHE stats for "nonsupervisory" or "production" workers since 1964. Nonsupervisory workers—defined by the BLS as "those who are not owners or who are not primarily employed to direct, supervise, or plan the work of others"—are about 82% of the private sector workforce, a share that has hardly changed over the last 53 years.
Most Wall Street analysts have been focusing on the all worker series, because it's broader, and because many of them have a hard time thinking about more than one thing at a time. And if you're looking to alarmed about something, you can find a rising trend in the graph above. Yearly wage growth (not adjusted for inflation) hit a post-recession low of 1.5% in October 2012; in January 2018, it rose to 2.9%, the highest in almost nine years. Yes, the number is noisy, but there's no mistaking the rising trend.
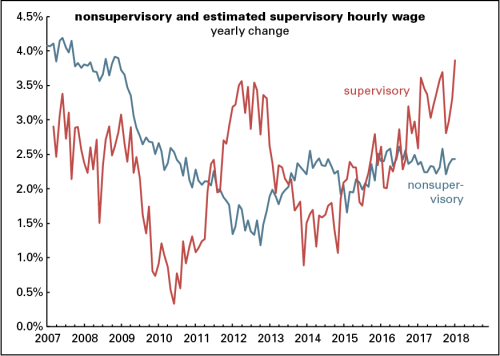
But those who've been panicking about a wage explosion haven't bothered to look at the nonsupervisory series. That has shown no rising trend at all over the last two years. AHE for nonsupervisory workers were up 2.4% for the year ending in January—just as they were in December, and less than September 2017's 2.6%. In January 2016, the gain was 2.4%. In other words, for more than four out of five private sector workers, there's been no acceleration in wage growth—which, by the way, is barely ahead of inflation.

The series does bounce around a lot, and it's quite possible that some of the January spike will be reversed in February. But the central point is this: the alarming acceleration in wages is not a mass phenomenon. It's for the $95,000 a year set, not the $45,000 crew.*
________________________________
*Yearly earnings are based on 2,000 hours a year times the relevant hourly wage.
Harpers Ferry, WV

No comments:
Post a Comment