Thursday, February 18, 2021

China Decoupling Would Cost U.S. Economy Billions, Chamber Says [feedly]

China Decoupling Would Cost U.S. Economy Billions, Chamber Says
https://www.bloomberg.com/news/articles/2021-02-17/china-decoupling-would-cost-u-s-economy-billions-chamber-says

Supply Lines is a daily newsletter that tracks Covid-19's impact on trade. Sign up here, and subscribe to our Covid-19 podcast for the latest news and analysis on the pandemic.

American companies would lose hundreds of billions of dollars if they slashed investment in China or the nations increased tariffs, the U.S. Chamber of Commerce said in a report highlighting the cost of a full decoupling of the world's largest economies.

What's moving markets
Start your day with the 5 Things newsletter.
By submitting my information, I agree to the Privacy Policy and Terms of Service and to receive offers and promotions from Bloomberg.

American gross domestic product would see a one-time loss of as much as $500 billion should U.S. companies reduce foreign direct investment in China by half, the Washington-based business lobbying group said in a report on Wednesday. Applying a 25% tariff on all two-way trade would trim U.S. GDP by $190 billion annually by 2025, the group said in a joint study with Rhodium Group, a New York data and analytics firm.

Read More: How China Won Trump's 'Good and Easy to Win' Trade War

The analysis highlights the costs of different policies as the Biden administration weighs the best strategy for facing challenges posed by China. The chamber said that the U.S. should work with allies to confront China on its state-led economic model and national security concerns rather than acting unilaterally, and without undermining U.S. productivity and innovation.

A "balanced and rational approach" to commercial relations with China is in the interests of both the U.S. and the American business community, the chamber said. At the same time, the group said that it's in favor of a "rules-based" economic order and against Chinese practices that are unfair to American companies.

Well Below Target

China's 2020 imports from the U.S. nowhere near the agreed target

Source: Bloomberg calculations based on official Chinese data

The U.S. and China fought a trade war under President Donald Trump that continues to see tariffs applied on about $335 billion of Chinese goods annually, according to the calculations by Chad Bown at the Peterson Institute for International Economics. That's despite a phase-one agreement reached in 2020, where China promised to purchase more American products. Beijing missed its 2020 trade-deal targets as the global pandemic upended shipping and supply chains.

Under the pact, the Asian nation pledged to buy an extra $200 billion in U.S. agriculture, energy and manufactured products over the 2017 level in the two years through the end of 2021.

The deal also didn't fully address some of the biggest grievances of American companies, such as China's theft of intellectual property, forced technology transfer and subsidies for domestic industries.

Read More: China Fails to Meet U.S. Trade Deal Target in 2020 Amid Pandemic

In addition to reduced goods exports, the study estimated that if future Chinese and tourism and education spending were reduced by half from pre-pandemic levels, the U.S. would lose $15 billion to $30 billion per year in services trade exports. A decoupling would hurt spending on research and development in the U.S. that supports China operations, though this impact is harder to quantify, the chamber said.

The chamber's report also studied the potential decoupling impact on four industries. It found that losing access to China's semiconductor market would cause $54 billion to $124 billion in lost output and put 100,000 U.S. jobs at risk. The imposition of tariffs could result in as much as $38 billion in output losses and nearly 100,000 jobs in the chemicals industry.

Losing access to China's market for U.S. aircraft and commercial aviation services could cost $51 billion annually in output, or $875 billion cumulatively by 2038. Lost market share in medical devices would result in $23.6 billion in annual revenue, the chamber said.


 -- via my feedly newsfeed
Tuesday, February 16, 2021

Deflation, inflation or stagflation? [feedly]

Deflation, inflation or stagflation?
https://thenextrecession.wordpress.com/2021/02/14/deflation-inflation-or-stagflation/

During the year of the COVID, global consumer and producer prices inflation dropped. In some manufacturing-based economies, there was even a fall in price levels (deflation) eg the Euro area, Japan and China).

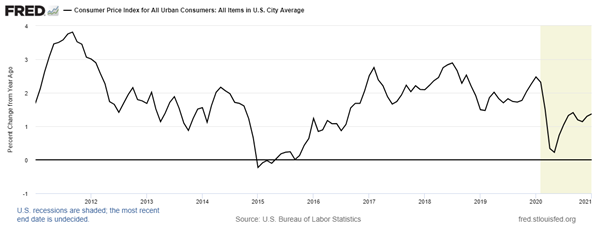
US inflation rate (annual %)

"Effective demand" as Keynesians like to call it, plummeted, with business investment and household consumption dropping sharply.  Savings rates rose to high levels (both corporate savings relative to investment and household savings).

Household savings rates (% of income) – OECD

Country20132014201520162017201820192020
United Kingdom3.13.64.92.20.06.16.519.4
United States6.67.67.97.07.27.87.516.1
Euro area (16 countries)5.65.75.75.75.66.46.714.3

Many companies went bust and many lower income households either lost their jobs or faced reductions in wages.  Higher income households maintained their wage levels, but they were unable to travel or spend on leisure and entertainment.

But now, as the rollout of vaccines accelerates across the advanced economies and governments and central banks continue to inject credit money and direct funding for business and households, the wide expectation is that the major economies will make a fast recovery in investment, spending and employment – at least by the second half of 2021.

Now the concern is that, instead of a continued slump, there is a risk of 'overheating' in the major economies, causing an inflation of prices generated by 'too much' government spending and continued 'loose' monetary policy.

The UK's Financial Times echoed the voices of leading mainstream American Keynesian economists that "a strong recovery and sizeable stimulus raise the possibility of the US 'overheating'".  Former treasury secretary Larry Summers and former IMF chief economist Oliver Blanchard both warned that the passing by the US Congress of the proposed $1.9tn spending package, on top of last year's $900bn stimulus, risked inflation.

Summers argued that the size of the spending package, about 9 per cent of pre-pandemic national income, would be much larger than the estimate of the shortfall in economic output from its 'potential' by the Congressional Budget Office (CBO). That, combined with loose monetary policy, the accumulated savings of consumers who have been unable to spend and already-falling unemployment could contribute to mounting inflationary pressure.  'Pent-up demand' would explode, leading to 1970s-type inflation.  "There is a chance that macroeconomic stimulus on a scale closer to World War II levels than normal recession levels will set off inflationary pressures of a kind we have not seen in a generation," said Summers.

Summers' view must be taken with the proverbial pinch of salt, considering that in April last year, he argued that the COVID pandemic would be merely a short sharp decline, somewhat like tourist areas (Cape Cod in his case) closing down for the winter, and the US economy would come roaring back in the summer.  Two things blew that forecast out of the Atlantic: first, the winter wave of COVID (actually in the case of the US, because of lax lockdowns etc, the spring wave just continued); and second, hundreds of thousands of small businesses (and some larger ones) went bust and so business was not able to return to normal after the 'winter break'.

Summers' argument is also based on some very dubious economic categories.  He measured the fiscal and monetary stimulus being applied by Congress and the Fed in 2021 against the "potential output" of the economy.  This is a supposed measure of the maximum capacity of investment and spending that an economy could achieve with 'full employment' without inflation.  The category is so full of holes, that economists come up with different measures of 'potential output', which anyway seems to be a moveable feast depending on productivity and employment growth and likely investment in new capacity.

Larry Summers reckons the Biden relief package will inject around $150 billion per month, while CBO says the monthly gap between actual and potential GDP is now around $50 billion and will decline to $20 billion a month by year-end (because the CBO assumes the COVID-19 virus and all its variants will be under control).

Former New York Fed President Bill Dudley backed up Summers in arguing that Four More Reasons to Worry About US Inflation.  First, economic slumps brought on by pandemics tend to end faster than those caused by financial crises.  This is Summers' Cape Cod argument revived.  And second, "thanks to rescue packages and a strong stock market, household finances are in far better shape now than they were after the 2008 crisis."  You might ask whether a rocketing stock market benefits the 93% of Americans who have no stock investments (or large pension funds).  And while the better-paid may have increased savings to spend, that is not the case for lower to middle income earners. Dudley also claimed that companies have "plenty of cash to spend and access to more at low interest rates".  Again, he seems to concentrate on the large techs and finance firms that are hoovering up government money and stock market gains.  Meanwhile there are hundreds of thousands of smaller companies which are on their knees and in no position to launch a big investment plan even if they can get loans at low rates.  The number of these zombie companies are growing by the day.

It's true as Dudley says that 'inflation expectations' are rising and that can be a good indicator of future inflation – if households think prices are going to rise, they tend to start spending in advance and so stimulate price rises – and vice versa.  And it's also true that, given the sharp fall in price inflation at the start of the pandemic lockdowns last year, any recovery in prices now will show up as a statistical year on year rise. But as you can see from this graph below inflation expectations are hardly at a level of "of a kind we have not seen in a generation" (Summers).

The other worry of the 'inflationists' is that the US Fed will generate an inflationary spiral through its 'lax' monetary policies.  The Fed continues to plough humungous amounts of credit money into the banks and corporations and also has weakened its inflation target of 2% a year to a 2% average inflation over some undefined period. Thus, the Fed will not hike interest rates or cut back on 'quantitative easing' even if the annual inflation rate heads over 2%.

Fed chair Jay Powell made it clear in a recent speech to the Economic Club of New York (business people and economists) that the Fed had no intention of reining in its monetary easing.  Powell even gave a date – no tightening of policy before 2023.  This has upset the anti-inflation theorists.  Gillian Tett in the FT put it: "the Fed has now taken this so-called "forward guidance" to a new level that seems dangerous.  He should puncture assumptions that cheap money is here indefinitely, or that Fed policy is a one-way bet. Otherwise his attempts to ward off the ghosts of 2013 will eventually unleash a new monster in the form of a bigger market tantrum, far more damaging than last time — especially if investors have been lulled into thinking the Fed will never jump."

The FT itself went on: "The Fed's pledge to leave policy on hold until 2022, however, risks undermining its credibility: it cannot promise to be irresponsible. … it must watch out for any sign that inflation expectations are rising and respond to the data rather than tie itself to the mast."  Dudley echoed this view.  "If the Fed does not tighten when inflation appears, it might have to reverse course quickly if it starts getting out of hand. That, in turn, could set off market fireworks."

But are the inflationists' warnings valid?  First, they are really based on a quick and significant 'Cape Cod' economic recovery.  But the pandemic is not over yet and the vaccines have not been rolled out to any level to suppress the virus sufficiently yet.  What if the new variants that are beginning to circulate are resistant to existing vaccines so that a new 'wave' emerges?  A summer recovery could be delayed indefinitely.

Moreover, these inflation forecasts are based on two important theoretical errors, in my view.  The first is that the huge injections of credit money by the Fed and other central banks that we have seen since the global financial crash in 2008-9 have not led to an inflation of consumer prices in any major economy even during the period of recovery from 2010 onwards – on the contrary (see the US inflation graph above), US inflation rates have been no more than 2% a year and they have been even lower in the Eurozone and Japan, where credit injections have also been huge.

Instead, what has happened has been a surge in the prices of financial assets.  Banks and financial institutions, flooded with the generosity of the Fed and other central banks, have not lent these funds onwards (either because the big companies did not need to borrow or the small ones were to risky to lend to).  Instead, corporations and banks have speculated in the stock and bond markets, and even borrowed more (through corporate bond issuance) given low interest rates, paying out increased shareholder dividends and buying back their own shares to boost prices. And now with the expectation of economic recovery, investors poured a record $58bn into stock funds, slashing their cash holdings and also piled $13.1bn into global bond funds while pulling $10.6bn from their cash piles.

So Fed and central bank money has not caused in inflation in the 'real economy' which continued to crawl along at 2% a year or lower in real GDP growth, while the 'fictitious' economy exploded.  It is there that inflation has taken place.

This is where the 'Austrian school' of economics comes in.  They see this wild expansion of credit leading to 'malinvestment' in the real economy and eventually to a credit crunch that hits the productive sectors of the 'pure' market economy.  This view is expressed by that bastion of conservative economics, the Wall Street Journal.  So while the Keynesians worry about overheating and inflation in true 1970s style, the Austrians worry about a credit/debt implosion.

In contrast, the exponents of Modern Monetary Theory (MMT) are quite happy about the Fed injections and the government stimulus programs.  Modern Monetary Theory exponent Stephanie Kelton, author of The Deficit Myth, when asked whether she was worried about the stimulus bill causing inflation, said: "Do I think the proposed $1.9 trillion puts us at risk of demand-pull inflation? No. But at least we are centering inflation risk and not talking about running out of money. The terms of the debate have shifted."

But neither the Keynesians, the Austrians nor the MMT exponents have it right theoretically, in my view.  Yes, the Austrians are right that the expansions of credit money are driving up debt levels to proportions that threaten disaster if they should collapse. Yes, the MMT exponents are right that government spending per se, even if financed by central bank 'printing' of money will not cause inflation, per se.  But what both schools ignore is what is happening to the productive sectors of the economy.  If they do not recover then, fiscal stimulus won't work and monetary stimulus will be ineffective too.

Take the proposed $1.9 trillion stimulus package.  Even assuming the whole package is passed by Congress (increasingly unlikely) and then implemented, the stimulus is spread over years not months.  Moreover, the paychecks to households will more likely end up being used to pay down debt, bump up savings and cover rent arrears and health care bills.  There won't be much left to go travelling, eat in restaurants and buy 'discretionary' items.

Moreover, as I have argued in many previous posts, the Keynesian view that government spending delivers a strong 'multiplier' effect on economic growth and employment is just not borne out by the evidence.  Sure, government handouts to households and investment in infrastructure may generate a short boost to the economy.  But raising government investment from 3% of GDP to 4% of GDP over five years or so cannot be decisive if business sector investment (about 15-20% of GDP) continues to stagnate. Indeed, as government debt grows to new highs (in the case of the US, to over 110% of GDP) even if interest rates stay low, interest costs to GDP for governments will rise and eat into funds available for productive spending.  And with corporate debt also at record highs, there is no room for debt heavy corporations to cope with any reversal in low interest rates.

The problem is not inflationary 'overheating'; it is whether the US economy can ever recover sufficiently to get close to 'full employment'.  The official US unemployment rate may be 'only' 6.7% but even the statistical authorities and the Fed admit that it's probably more like 11-12% and even worse if you include the 2% of the labour force that has left the labour market altogether.

The problem is the profitability of the capitalist sector of the US economy.  If that does not rise back to pre-pandemic levels at least (and that was near an all-time low), then investment will not return sufficiently to restore jobs, wages and spending levels.

Last year, G Carchedi and I developed a new Marxist approach to inflation.  We have yet to publish our full analysis with evidence.  But the gist of our theory is that inflation in modern capitalist economies has a tendency to fall because wages decline as a share of total value-added; and profits are squeezed by a rising organic composition of capital (ie more investment in machinery and technology relative to employees).  This tendency can be countered by the monetary authorities boosting money supply so that money price of goods and services rise even though there is a tendency for the growth in the value of goods and services to fall.

During the year of the COVID, corporate profitability and profits fell sharply (excluding government bailouts and with the exception of big tech, big finance and now big pharma).  Wage bills also fell (or to be more exact, wages paid to the many fell while some saw wages rise).  These results were deflationary.  But the central banks pumped in the money.  US M2 money supply was up 40% in 2020.  So US inflation, after dropping nearly to zero in the first half of 2020, moved back up to 1.5% by year end. Now if we assume that both profits and wages will improve by 5-10% this year and Fed injections continue to rise, then our model suggests that US inflation of goods and services will rise, perhaps to about 3% by end 2021 – pretty much where consumer expectations are going (see graph above).

That's hardly 'generation high' inflation.  And the view of Jay Powell and new Treasury Secretary Janet Yellen is "I can tell you we have the tools to deal with that (inflation) risk if it materializes."  Well, the US monetary and fiscal authorities may think they can control inflation (although the evidence is clear that they did not in the 1970s and have not controlled 'disinflation' in the last ten years).  But they can do little to get the US economy onto a sustained strong pace of growth in GDP, investment and employment.  So the US economy over the next few years is more likely to suffer from stagflation, than from inflationary 'overheating'.


 -- via my feedly newsfeed

What Gets Counted When Measuring US Tax Progressivity [feedly]

What Gets Counted When Measuring US Tax Progressivity
https://conversableeconomist.blogspot.com/2021/02/what-gets-counted-when-measuring-us-tax.html

The "progressivity"  of a tax refers to whether those with higher incomes pay a higher share of income in taxes than those with lower incomes. The federal income tax is progressive in this sense. 

However, other federal taxes like the payroll taxes that support Social Security are regressive, rather than progressive, because it applies only to income up to a limit (set at $142,800 in 2021). The justification is that Social Security taxes combine both a degree of redistribution but also a sense of contributing to one's own future Social Security benefits. But to take it one step further, one justification for the Earned Income Tax Credit for lower-earning families and individuals serves in part to offset the Social Security payroll taxes paid by this group. 

So with all this taken into account, how progressive is the federal income tax and how has the degree of progressivity shifted in recent decades. David Splinter tackles these questions in "U.S. Tax Progressivity and Redistribution" (National Tax Journal, December 2020, 73:4, 1005–1024).

It's worth emphasizing that any measure of tax progressivity is based on an underlying set of assumptions about what is counted as "income" or as "taxes." Let me give some examples: 

The Earned Income Tax Credit is "refundable." Traditional tax credits can reduce the taxes you owe down to zero, but a "refundable" credit means that you can qualify for a payment from the government above and beyond any taxes you owe: indeed, the purposes of this tax credit is to provide additional income and an additional incentive to work for low-income workers. This tax credit cost about $70 billion in 2019.   But for purposes of categorization, here's a question: Should these payments from the federal government to low-income individuals be treated as part of the progressivity of the tax code? Or should they be treated as a federal spending program? Of course, treating them as part of the tax code tends to make the tax code look more progressive. 

Here's another example: When workers pay taxes for Social Security and Medicare, employers also pay a matching amount. However, a body of research strongly suggests that the amount paid by employers leads to lower wages for workers; in effect, workers "pay" the employer share of the payroll tax in the form of lower take-home pay, even if employers sign the check. (After all, employers care about the total cost of hiring a worker. They don't care whether that money is paid directly to the worker or whether some of it must be paid to the government.) So when looking at the taxes workers pay, should the employer share of the payroll tax be included? 

Here's another example: Many of us have retirement accounts, where our employer signs the checks for the contributions to those accounts and the total in the account in invested in a way that provides a return over time. Do the employer contributions to retirement get counted as part of annual income? What about any returns earned over time? 

Or here's another return: Say that I own a successful business. There are a variety of ways I can benefit from owning the business other than the salary I receive: for example, the business might buy me a life insurance policy, or pay for a car or other travel expenses, or make donations to charities on my behalf. Are these counted into income? 

There are many questions like these, and as a result, measurements of average taxes paid for each income group will vary. Here's a selection of six recent estimates, as collected by Splinter: 

Again, these are just federal tax rates, not including state and local taxes. Notice both that the estimates vary, but also that they are broadly similar. 

One way to boil down the progressivity of the federal tax code into a single number is to use the Kakwani index. The diagram illustrates how it works. The horizontal axis is a cumulative measure of all individuals; the vertical axis is a cumulative measure of either income received or taxes paid by society as a whole. The dashed 45-degree line shows what complete equality would look like: that is, along that line, the bottom 20 percent of individuals get 20 percent of income and pay 20 percent of taxes, the bottom 40 percent get 40 percent of income and pay 40% of taxes, and so on. 

The idea is to compare the real-world distribution of income and taxes to this hypothetical line of perfect equality. The lighter solid line shows the distribution of income. Roughly speaking, the bottom 50% of individuals received about 20% of total income in 2016 The area from the lighter gray line to the 45-degree perfect equality line measures what is called the "Gini index"--a standard measure of the inequality of the income distribution. 

The dark line carries out a similar calculation for share of taxes paid. For example, the figure shows that the bottom 50% of the income distribution paid roughly 10% of total federal taxes in 2016. If the distribution of taxes paid exactly matched the distribution of income, the tax code would be proportional to income. Because the tax line falls below this income line, this shows that overall, federal taxes are progressive. The area between the income line and the tax line is the Kakwani index for measuring the amount of progressivity. 

How has the Kawkani index shifted over recent decades?  Splinter writes:

Between 1979 and 1986, the Kakwani index decreased 34 percent (from 0.14 to 0.10) ... Between 1986 and 2016, the Kakwani index increased 120 percent (from 0.10 to 0.21) ... For the entire period between 1979 and 2016, the Kakwani index increased 46 percent (from 0.14 to 0.21) ...
In short, progressivity of federal taxes fell early in the Reagan administration, rose fairly steadily up to about 2009, and then was more-or-less flat through 2016. 

Splinter is using the Congressional Budget Office estimates of income and taxes in making these calculations. CBO estimates are mainstream, but of course that doesn't make them beyond question. In particular, a key assumption here is that payments made by the Earned Income Tax Credit are treated as part of tax system, rather than as a spending program, and that explains a lot of why the progressivity of the tax code increased by this measure. As Splinter writes: 

U.S. federal taxes have become more progressive since 1979, largely due to more generous tax credits for lower income individuals. Though top statutory rates fell substantially, this affected few taxpayers and was offset by decreased use of tax shelters, such that high-income average tax rates have been relatively stable. ... Over the longer run, earlier decreases suggest a U-shaped tax progressivity curve since WWII, with the minimum occurring in 1986.
For more arguments and details about how to measure income and wealth, a useful starting point is a post from a couple of months ago on "What Should be Included in Income Inequality?" (December 23, 2020). 

 -- via my feedly newsfeed

Biden Assurances on Jobs Sting Like Insults in Mines, Oil Patch [feedly]

If the new jobs, or other compensation, is subjunctive, meaning a woulda coulda shoulda reward, labor unity will fail. If that unity fails, so will progress and democracy. That's what a class analysis tells me. Maybe its wrong. I don't think so.

Biden Assurances on Jobs Sting Like Insults in Mines, Oil Patch
https://www.bloomberg.com/news/features/2021-02-16/miners-and-oil-workers-hear-insults-in-biden-talk-of-better-jobs

The Biden administration has gotten off to a rough start trying to reassure coal miners and oil workers whose jobs are threatened by the president's fight against climate change.

Vice President Kamala Harris drew derision on social media after she told a West Virginia television station that people could be put to work reclaiming abandoned "land mines." A day earlier, climate envoy John Kerry said during a White House briefing that displaced laborers face "better choices" making solar panels and installing wind turbines. 

Such comments have backfired with oil workers twisting pipe in Texas and miners harvesting coal in Appalachia.

"Sure, we're going to make solar panels in these mountains," Joyce Evans scoffed from her home in Pineville, Kentucky.

relates to Biden Assurances on Jobs Sting Like Insults in Mines, Oil Patch
Joyce Evans says she's skeptical of the promises from Washington.
Photographer: Scotty Perry/Bloomberg

Evans, who ran her own coal yard until 2000 and still works at the site near the convergence of Tennessee, Virginia and Kentucky, says she's skeptical of the promises from Washington and disturbed by the new administration's early climate moves.

The frustration underscores the stakes for hundreds of thousands of workers whose jobs are imperiled by President Joe Biden's fight against climate change and the economy's embrace of renewable energy. And it highlights the political challenge for Biden as he tries to enlist Americans in a battle for cleaner energy -- including voters in swing states rich in fossil fuels.

Many of them, including West Virginia and Pennsylvania, were once reliably Democratic, but Republicans -- led by former President Donald Trump four years ago -- have successfully appealed to blue-collar workers there with promises to support their jobs and their fossil-driven economies.

"It just shows the arrogance of politicians," said Mike Party, 65, the chief executive of Beryl Oil and Gas in Midland, Texas, whose 43-year career in the oil and gas industry started with a summer job. "When they sit there and say you should just go find another career, how do you not take that personally?"

BERYL OIL AND GAS MIDLAND TEXAS MICHAEL PARTY
Mike Party at his office in Midland, Texas.
Photographer: Matthew Busch/Bloomberg

Biden casts his moves to combat climate change as an economic opportunity, with the promise to spur jobs installing solar panels, building wind turbines and weatherizing homes. "We're never going to forget the men and women who dug the coal and built the nation," Biden vowed as he announced a slew of climate initiatives last month. "We're going to do right by them -- make sure they have opportunities to keep building the nation and their own communities" while "getting paid well for it."

A White House  spokesman said that Biden's climate plan would make transformative investments in infrastructure and tackle the climate crisis while creating millions of good union jobs. The administration will take additional actions to fulfill these commitments in the weeks and months ahead, the spokesman said, asking not to be identified. 

The president created a government working group dedicated to the issue and ordered it to come up with a plan for driving the economic revitalization of communities affected by the decline of fossil fuels. The initiative dovetails with a campaign by environmentalists and Appalachian leaders for a just transition that combines policies, training programs and investments to ensure communities and workers aren't left behind in the shift away from fossil fuels.

Brandon Dennison, chief executive of Coalfield Development, a group focused on revitalizing central Appalachia, said workers don't want to be viewed as collateral damage or blamed for climate change.

"Most conversations about climate change have treated coal workers as an afterthought," with insulting suggestions they can be retrained or just move, Dennison said. "The reality is many job-training programs haven't worked that well. And, by and large, we don't want to move and doing so would cost too much anyway."

Dennison said both politicians and environmental advocates need to change the way they view -- and talk about -- affected fossil fuel workers, who don't want to be treated as "a charity case."

Kerry's comments at the Jan. 27 White House briefing on climate unfairly suggest it's easy to find a new job -- or that oil workers would be willing to move far from their current homes to find them, said Jerry, who supervises the construction of offshore rigs, pipelines and components at a fabrication yard in southern Louisiana. Jerry asked that his last name not be used, citing concerns his frank talk could harm his employer.

President Biden Outlines His Administration's Climate Plan
climate envoy John Kerry said during a White House briefing that displaced laborers face "better choices" making solar panels and installing wind turbines.
Photographer: Stefani Reynolds/Bloomberg

"What are our choices? They keep saying we have choices, but what are they?" Jerry said through a thick Louisiana accent. "Are we just supposed to lift our whole livelihood and move because they want to buy oil from outside the United States?"

Jerry, who has been fabricating fittings and parts for offshore facilities for 25 years, said the work comes with a good wage and retirement benefits, enabling him to pay tuition for one child in college and two others in private school.

"It's not as easy as just going to get another job. You have a family to support," he said. "When you're used to making 25, 35 dollars an hour and have to take a pay cut to 10 to 12 what does that do to the food on your table? What does that mean to your kids?"

Kerry's comments have drawn particular ire because of a report that he flew in a private jet to Iceland two years ago to accept an award for his work against global warming.

"When John Kerry and Biden say those kind of things, they have just written off most of the country," Earl Sebring, whose two-person exploration company drills for oil in the prolific Permian Basin spanning west Texas and eastern New Mexico. "It's easy for John Kerry to say, when he's getting off his private jet, things like 'they will have better choices.' That's fine for someone who has never worked a day in his life, but the entire Permian Basin is based on oil and gas."

The focus on Kerry's use of a private plane is a distraction, according to the climate envoy's allies.

"As a private citizen, John Kerry took responsible steps to reduce and manage his carbon footprint," including using solar power and electric vehicles said David Wade, who was chief of staff during Kerry's tenure as secretary of state. "And on the very rare occasion when he flies a private flight, he buys carbon offsets."

Biden climate adviser Gina McCarthy tried to address the concern over jobs at the Jan. 27 White House briefing at which Kerry spoke.

"We're not going to ask people to go from the middle of Ohio or Pennsylvania and ship out to the coast to have solar jobs," McCarthy said. "Solar jobs will be everywhere, but we need to put people to work in their own communities."

That message may have been undermined the next day by a slip of the tongue when Harris touted new opportunities for skilled coal workers during an interview with West Virginia's WSAZ. New jobs could include plugging oil wells and "reclaiming abandoned land mines," Harris said.

Gaffes and tone-deaf remarks on the issue carry political risk. Hillary Clinton learned this firsthand in 2016, when the former Democratic presidential nominee volunteered, "We're going to put a lot of coal miners and coal companies out of business" -- a candid, if poorly phrased, assessment of the industry's economic decline that haunted her on the campaign trail.

By contrast, her Republican opponent, former President Donald Trump, set out to woo votes from coal country. He pantomimed digging coal on stage and told hard-hat-wearing workers at one rally to "Get ready, because you are going to be working your asses off."

Ultimately, Trump's campaign promises didn't lead to an industry resurgence. The U.S. had about 47,400 mining jobs as of January 2020, before the Covid pandemic crushed more of them -- about 7% fewer than when Trump was inaugurated in January 2016.

That's a far cry from the 863,000 miners that were using pickaxes, shovels and blast powder to carve coal from mostly subterranean seams in 1923, the heyday for the industry's employment in the U.S. But as the industry grew more automated, longwall machines and conveyors run by just a few workers replaced hand tools and the multitudes of miners once needed to wield them. Now, increased efficiency along with dropping power sector demand for coal means the industry is in decline regardless of federal policy.

Workers faced with shrinking opportunity have legitimate concerns, said Peter Hille, president of the Mountain Association that promotes more diverse and resilient economic development in eastern Kentucky communities long tied to coal. "Experience has taught them to be skeptical of the promises of politicians," Hille said.

Richard Chase, a retired miner in Wheeling, West Virginia, knows coal is in decline.

"Sooner or later, coal is going to be done," Chase said. "It's a dirty power source."

But if that happens "all at once you're going to be putting a lot of guys out of work," Chase said. "Those guys have to be trained to do something else."

Chase worked for decades in a series of mines in West Virginia and across the border in Pennsylvania. The work involved long days and plenty of them -- "you could work nine days straight" -- but it earned enough money to feed a family, put children through college and retire at 55, Chase said.

"If it weren't for that place, I probably wouldn't be where I'm at now -- retired, and still I can still get anything I want," Chase said. "I loved that job."


 -- via my feedly newsfeed