Thursday, July 30, 2020

Congress has failed to extend additional unemployment benefits as millions of workers across the country file new UI claims [feedly]

Congress has failed to extend additional unemployment benefits as millions of workers across the country file new UI claims
https://www.epi.org/blog/congress-has-failed-to-extend-additional-unemployment-benefits-as-millions-of-workers-across-the-country-file-new-ui-claims/

The U.S. Department of Labor (DOL) released the most recent unemployment insurance (UI) claims data last Thursday, showing that another 2.3 million people filed for UI benefits during the week ending July 18. Huge swaths of workers in every state are relying on UI for food, rent, and basic necessities. There are 14 million more unemployed workers than jobs. In the face of this economic crisis, Congress has let the extra $600 in weekly UI benefits expire, and now Senate Republicans are proposing reducing the increase to $200, which would cause such a huge drop in spending that it would cost 3.4 million jobs. These benefit cuts will directly harm the workers and their families who need these benefits to weather the pandemic and will cause further economic harm over the next year.

Figure A shows the share of workers in each state who either made it through at least the first round of state UI processing (these are known as "continued" claims) or filed initial UI claims in the following weeks. The map includes separate totals for regular UI and Pandemic Unemployment Assistance (PUA), the new program for workers who aren't eligible for regular UI, such as gig workers.

The map also includes an estimated "grand total," which includes other programs such as Pandemic Emergency Unemployment Compensation (PEUC) and Short-Time Compensation (STC). The vast majority of states are reporting that more than one in 10 workers are claiming UI. Thirteen states and the District of Columbia report that more than one in five of their pre-pandemic labor force is now claiming UI under any of these programs. The components of this total are listed in Table 1.1

Three states had more than 1 million workers either receiving regular UI benefits or waiting for their claim to be approved: California (3.0 million), New York (1.6 million), and Texas (1.4 million). Seven additional states had more than half a million workers receiving or awaiting benefits.

While the largest U.S. states unsurprisingly have the highest numbers of UI claimants, some smaller states have larger shares of the workforce filing for unemployment. Figure A also displays the numbers of workers in each state who are receiving or waiting for regular UI benefits as a share of the pre-pandemic labor force in February 2020. In six states and the District of Columbia, more than one in seven workers are receiving regular UI benefits or waiting on their claim to be approved: Hawaii (20.8%), Nevada (20.7%), the District of Columbia (17.9%), New York (17.1%), Louisiana (15.9%), Georgia (15.8%), and California (15.5%).

Eight states reported that more than one in ten workers are currently claiming PUA, underscoring the importance of extending benefits to those who would otherwise not have been eligible: Michigan (21.2%), Maryland (16.4%), Hawaii (14.0%), California (13.0%), New York (12.3%), Massachusetts (12.1%), Nevada (11.7%), and Rhode Island (11.4%). Pennsylvania reported that 3.8 million workers have claimed PUA, but that would constitute nearly 60% of the state's workforce, so this is almost definitely misreporting. Arizona did not report any continuing PUA claims for the week ending July 4, which is also likely misreporting since they had reported 2.3 million for the prior week.
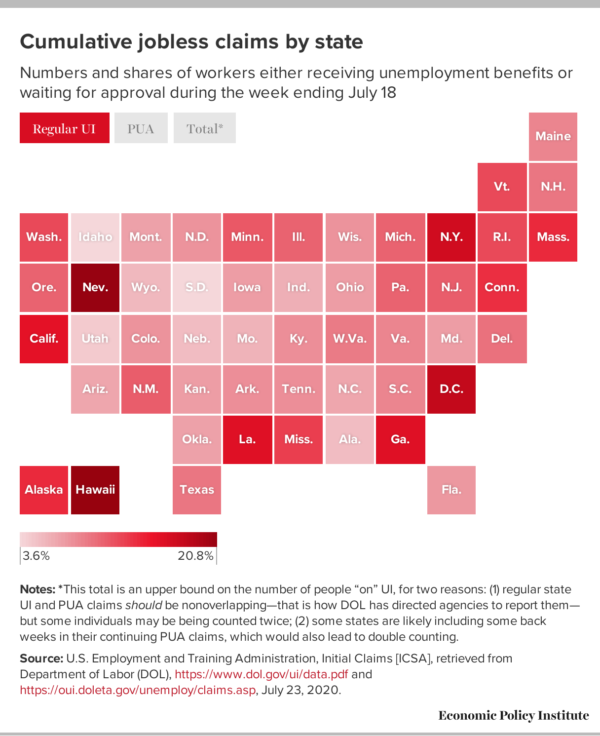
Figure A

As we look at the aggregate measures of economic harm, it is also important to remember that this recession is deepening racial inequalities. Black communities are suffering more from this pandemic—both physically and economically—as a result of, and in addition to, systemic racism and violence. Both Black and Hispanic workers are more likely than white workers to be worried about exposure to the coronavirus at work and bringing it home to their families. These communities, and Black women in particular, should be centered in policy solutions. Cutting off the $600 UI benefit will deepen existing racial inequalities, since Black and Hispanic workers have higher unemployment rates than white workers.

In addition to extending the additional weekly $600 benefit that they have allowed to expire, which will help workers in the immediate term and support millions of jobs, Congress should provide substantial aid to state and local governments. Without this aid, a prolonged depression is inevitable, especially if state and local governments make the same budget and employment cuts that slowed the recovery after the Great Recession. More than five million workers would likely lose their jobs by the end of 2021, harming women and Black workers in particular since they are disproportionately likely to work for state and local governments.

We should despair for the millions who have lost their jobs and for their families, and our top priority as a country should be protecting the health and safety of workers and our broader communities by paying workers to stay home when possible, whether that means working from home some or all of the time, using paid leave, or claiming UI benefits. When workers are providing absolutely essential services, they must have access to adequate personal protective equipment (PPE) and paid sick leave. The current spike in coronavirus cases across the country—and subsequent re-shuttering of certain businesses—show the devastating costs of reopening the economy prematurely.
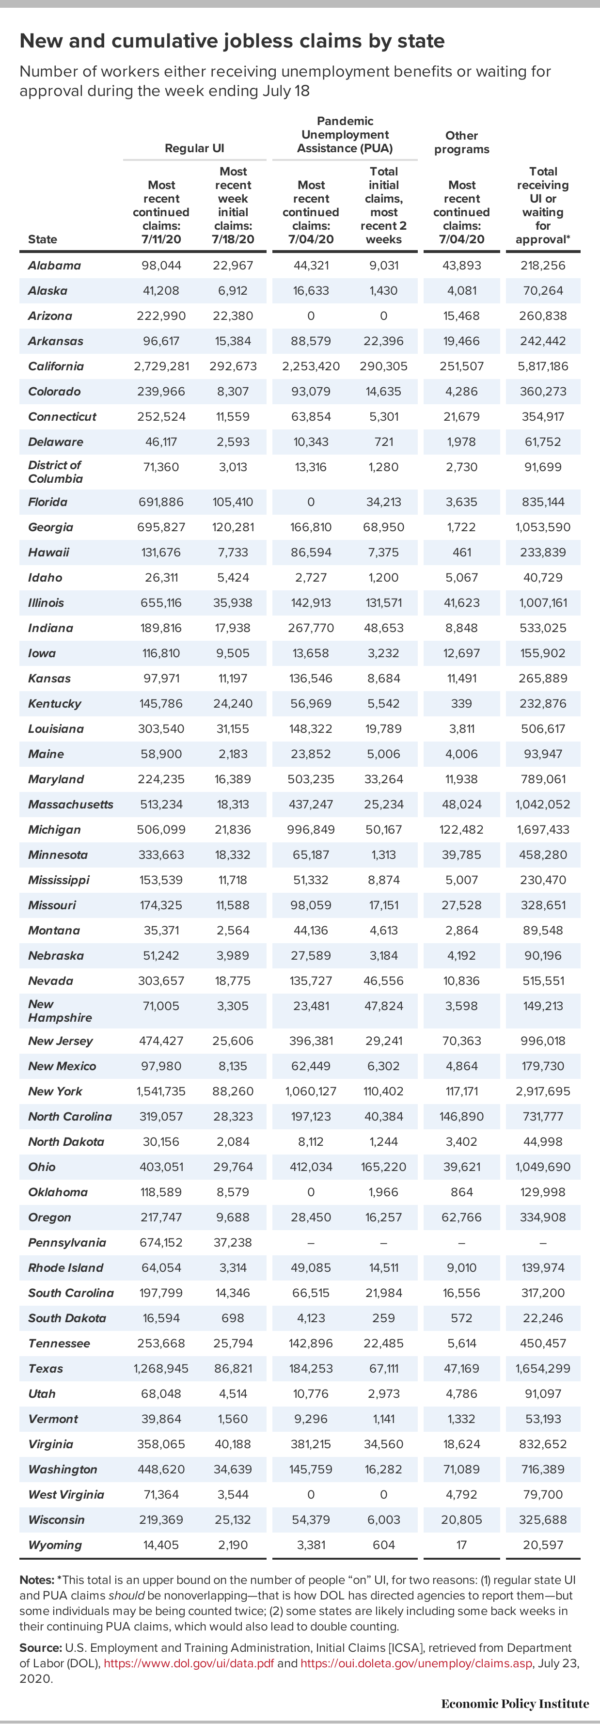
Table 1

Enjoyed this post? Sign up for the Economic Policy Institute's newsletter so you never miss our research and insights on ways to make the economy work better for everyone.


Notes

1.  That total is really more of an upper bound, and you should exercise caution when interpreting it for three reasons: (1) It includes initial claims, which represent people who have not yet made it through the first round of processing; (2) Some individuals may be being counted twice. Regular state UI and PUA claims should not be overlapping—that is how DOL has directed state agencies to report them—but some states may be misreporting; (3) Some states are likely including some back weeks in their continuing PUA claims, which would also lead to double counting (the discussion around Figure 3 in this paper covers this issue well). Those limitations are the reason that we have so far hesitated to publish this estimate of total claims by state. DOL has worked to overcome misreporting issues and has had enough success that we are now comfortable enough to report the totals here. However, it is clear that there is still some misreporting. Unless otherwise noted, all numbers are as reported by DOL. In this post, I drop the reported PUA (and total) claims for Pennsylvania from the figure and table, since they reported more than 3 million PUA claims to DOL (more than half of their labor force!) despite their Office of Unemployment Compensation reporting that they have only received 1.5 million PUA claims.


 -- via my feedly newsfeed

Tuesday, July 28, 2020

Without Boost in Next COVID-19 Relief Bill, Puerto Rico Faces Deep Food Aid Cuts [feedly]

Without Boost in Next COVID-19 Relief Bill, Puerto Rico Faces Deep Food Aid Cuts
https://www.cbpp.org/blog/without-boost-in-next-covid-19-relief-bill-puerto-rico-faces-deep-food-aid-cuts

Nearly 1.5 million Puerto Rico residents, including more than 300,000 children, are facing deep cuts in food assistance in August, but the new Senate Republican economic relief plan doesn't include more food aid for Puerto Rico. While the House-passed Heroes Act includes a modest increase in nutrition funding for Puerto Rico, it falls short of Governor Wanda Vázquez Garced's request. Without sufficient additional food aid, more than a million U.S. citizens in Puerto Rico will face these food assistance losses while also grappling with COVID-19 and its severe economic impact.


a
 -- via my feedly newsfeed

Spanish Unemployment Rises Above 15%, With Worse to Come [feedly]

Spanish Unemployment Rises Above 15%, With Worse to Come
https://www.bloomberg.com/news/articles/2020-07-28/spanish-unemployment-rises-above-15-with-worse-to-come

Spain's unemployment rate rose in the second quarter, a harbinger of the bleak months ahead for one of Europe's most troubled labor markets.

The increase in jobless reflects the fallout from the strictest part of the country's lockdown to deal with the coronavirus. The full economic damage will be revealed on Friday, when data is expected to show that output contracted by more than 16% in the three months through June.

Jobless Hit

Spain's unemployment rate is going to spike again this year

Source: INE, Bloomberg surveys

While the economy has gradually been opening up, the fragile recovery is facing major hurdles. Outbreaks of the virus in some regions have led to a clampdown on many activities, and the outlook continues to worsen for the economically vital tourism sector. U.K. Prime Minister Boris Johnson has ordered those returning from Spain to be quarantined for 14 days, a major blow to an industry that relies greatly on British travelers.

ADVERTISING

The second-quarter data showed that the number of jobless in the euro-area's fourth-largest economy increased by 55,000 to 3.37 million workers. That lifted the unemployment rate to 15.33% from 14.4%. Youth unemployment jumped more than 6 percentage points to almost 40%.

Spain already had one of the developed world's highest unemployment rates before the crisis because of entrenched structural problems in the labor market. The economic crisis has reversed some of the recent improvements, and worse may be to come.

The country's central bank expects the rate to spike as high as 24% this year in a worst-case-scenario, and the institution's economists don't see it falling below 17% for at least two years.

The economy may shrink more than 10% this year, according to some forecasts, compared with about 8% for the euro area as a whole.

The latest jobless figures underplay the massive damage to the labor market that's already occurred. The statistics office said they doesn't reflect the high number of workers -- almost 1.1 million -- who became inactive. During Spain's strict confinement, many workers were unable to actively look for work, so aren't technically defined as unemployed.

The government rolled out an extensive furlough program to try to limit the damage. There were around 1.75 million workers on it as of July 1, Social Security Minister Jose Luis Escriva said in an interview with Bloomberg News earlier this month. Those furloughed workers are not counted in the jobless figures since they are temporarily suspended.

But recent flare ups in cases of Covid-19 in economically-important regions such as Catalonia have dimmed the outlook for furloughed workers. Tens of thousands of small businesses across the country aren't expected to survive until the end of the year.


 -- via my feedly newsfeed

Recovery Radio: Black Lives Matter

Tuesdays, 9 AM www.enlightenradio.org
LIVE on the Socialist Economics Facebook page.
Host James Boyd


S.M.A.R.T. Recovery in a Nutshell – SMART Recovery – Addiction Support

Special Guest:  Takesha Ann Martinez


Sunday, July 26, 2020

Sleepwalking into depression: The economic response to COVID-19 in the United States [feedly]

Sleepwalking into depression: The economic response to COVID-19 in the United States
https://equitablegrowth.org/sleepwalking-into-depression-the-economic-response-to-covid-19-in-the-united-states/

Almost five months into our country's response to the coronavirus pandemic and ensuing recession, policymakers seem to have lost the urgency that characterized the initial days of dramatic, bipartisan action. In March, four pieces of coronavirus legislation were passed and signed into law. But over the following 2 months, very little in the way of meaningful new policy action occurred. What's worse, some congressional leaders, squinting at recent data through rose-colored glasses, are ready to declare "mission accomplished," letting the previous legislation expire and taking no further action.

Are they right? Well, the stock market is now about even for the year. Unemployment declined by 1.4 percentage points in May, and 2.2 percentage points in June. Retail sales increased by 17.7 percent in May, the largest increase ever. And deaths per day from COVID-19, the disease spread by the novel coronavirus, have fallen by half. With the vast majority of stimulus checks delivered and cashed, and with the extra payments for the unemployed set to expire at the end of July, might the U.S. economy be able to muddle along without further support?

The short answer is no—not by a long shot. The few green shoots of improved economic data belie the fact that the health and economic crises are far from over. In fact, we are in danger of sleepwalking into economic depression.

What real-time data are telling us

A careful review of the data reveals gaping wounds caused by the coronavirus pandemic: large declines in market incomes, consumer spending, and employment, all barely propped up by the temporary government stimulus payments. To prevent economic collapse, it is urgent that policymakers take further action. Congress must continue to support unemployed workers' incomes, send additional stimulus payments to families to keep them financially afloat and increase spending, and give aid to local and state governments so they don't have to lay off workers.

But, most importantly, policymakers at the state and federal levels must do more to control the spread of the coronavirus, which is now growing at the rate of 70,000 cases a day.

The April Personal Consumption and Income report from the U.S. Bureau of Economic Analysis showed a historic collapse of consumption expenditures, with total spending down 13.6 percent. The decline came despite a record increase in personal income of 10.8 percent, due to the massive inflow of federal stimulus and Unemployment Insurance payments. Without these transfer payments, personal income would have declined 6.3 percent in April and spending would have collapsed even further. For every dollar of stimulus, households increased spending by 25 cents to 35 cents, according to recent estimates, while previous research shows that every dollar of Unemployment Insurance benefits leads to 27 cents of spending.

Thanks in large part to pandemic-related income support, spending recovered somewhat in May, rising 8.2 percent, but it is still down 9.8 percent from the same period in 2019. The most recent official data, the June Retail Sales report, shows that spending on retail goods has largely recovered to its level from last year, while spending on restaurants remain depressed, down 26 percent from its period last year.

While government data give the most accurate picture of the aggregate economic situation, alternative real-time data are crucially important in understanding the scale of the economic crisis and determining the appropriate government response. In a recent paper, I use real-time payment data from Earnest Research, a company that analyzes spending data from credit and debit cards, to study the latest on how consumer spending is responding to the pandemic.

My analysis based on these data examines measures of real-time retail and restaurant spending growth, comparing weeks in 2020 with the corresponding weeks in 2019. The higher-frequency data show that the spending drop came at the end of March and beginning of April, followed by a partial recovery at the end of April. The revival stalled somewhat in May, but continued again in June, with spending in some weeks actually above 2019 levels. In July, however, there are initial signs that with Covid-19 cases spiking again, spending is declining, with retail spending down 7 percent for the week ending July 15. (See Figure 1.)

Figure 1

Restaurant spending saw a sharper decline and slower recovery: As of July 15, it was still down more than 15 percent. Aggregate service spending saw the largest decline in spending, more than 50 percent, and was still down more than 40 percent as of July 15.

The decline in consumer demand raises the specter that even if businesses are able to reopen after lockdowns end, there will not be enough demand to sustain them. A recent survey of small business owners found their biggest concern is that sales will not be high enough to justify their reopening. Layoffs—initially concentrated in sectors directly affected by the pandemic, such as restaurants and hotels—have metastasized to white-collar sectors, such as professional services, finance, and real estate.

Unemployment remains at a staggering level, with the latest jobs report showing 18 million Americans unemployed. The unemployment rate in June 2020, 11.1 percent, is the highest it's been since the Great Depression in the 1930s, except for the previous two months. The good news in the report was that this elevated level is down 3.6 percentage points from April, driven mainly by workers who were on temporary layoffs being recalled to their jobs. The largest gains were in the leisure, hospitality, and retail trade sectors. Unemployment among Black workers declined by only 1.3 percent between April and June, about a third of the magnitude of White workers. And the data contained other worrying signs: The number of workers who have permanently lost their jobs increased to almost 3 million.

There are two additional factors that cause the headline number to understate the impact of the pandemic on employment. First, the report counts as employed an extra 2 million people who were "not at work for other reasons" and does not include the 4.6 million who have left the labor force since February. The 2 million were misclassified in error and should rightfully be counted as part of the true unemployment rate. Second, usually workers who leave the labor force are not included in totals of unemployment, but this pandemic presents a special case. Labor force participation fell substantially between February and May; a decline this large suggests that some of the people leaving the labor force may have done so temporarily due to the difficulties of looking for a job. Adjusting for these factors would increase the June unemployment rate to 13 percent.

Another worrying sign in the jobs data is government employment. State government employment declined by 247,00 between March and June, local government employment fell by a staggering 1.2 million, and federal government employment has been flat. As the coronavirus pandemic knocks a massive hole in their budgets, governments are laying off workers by the thousands. Lower consumer spending means lower tax revenue, and new coronavirus-related expenses means higher government spending. As a result, state and local governments are tightening their budgets at the worst possible moment for the economy. These government cuts have disparate impacts on Black Americans, who make up 12 percent of the labor force but 18 percent of government jobs.

The overall picture of the economy, then, is seriously troubling. Consumers are struggling, with incomes propped up by massive government stimulus and unemployment benefits. Some businesses are recalling furloughed workers but are concerned about a lack of demand. And governments are cutting employment and essential services due to unanticipated expenses and rapid declines in revenues. These fundamental issues will not resolve themselves on their own. The government acted with surprising alacrity in passing the Coronavirus Aid, Relief, and Economic Security, or CARES, Act in March, but further action is needed.

Policy proposals to head off a depression

First and foremost, the extra $600 per week Unemployment Insurance payments, slated to expire on July 31, should be extended and based on automatic triggers tied to an eventual economic recovery. The benefits are not only a lifeline to the 20 million workers who have been laid off but also the thin thread by which consumer spending is hanging. The drop in income and spending from the expiration of this benefit would be catastrophic for an economy in which market income is falling and spending has collapsed. Congress must extend the benefits and not put an expiration date on them, keeping them elevated until triggered off by unemployment returning to normal.

But even this is not enough. Given the collapse in consumer spending, it is clear that more demand support is needed than additional Unemployment Insurance payments. While the $1,200 stimulus payment in the CARES Act was a good start, there is no reason for this to be a one-off benefit. Monthly payments—$1,000 would be a good start—should be made until unemployment returns to normal and/or consumer spending improves.

State and local budget deficits through 2021 might approach $1 trillion. Without additional aid, the shedding of government workers across the country will continue. This is not a short-term issue that can be solved with a one-time stimulus bill. Once again, what is needed is monthly aid to state and local governments that continues until the unemployment rate returns to normal and states' fiscal health improves.

While each of these policies can help to deal with the symptoms of the economic collapse, the fundamental cause remains the continuing spread of the novel coronavirus and the lethality of COVID-19 uncontained. Many of the layoffs are in the restaurant, travel, and retail sector, whose customers will not come back in sufficient numbers until it is safe to do so. Even with states beginning to reopen, 78 percent of Americans say they would be uncomfortable eating at a restaurant, and 67 percent are not comfortable shopping at a retail clothing store. While the outbreak may have left the front pages of some newspapers, it continues unabated. Around 500 Americans per day are dying from COVID-19, with 70,000 new cases reported each day.

Several of the hardest-hit European countries, such as Italy and Spain, have succeeded in suppressing new cases to the low hundreds per day. They did so by following the only tried-and-true plan that has worked against the coronavirus: a comprehensive program of tracking and tracing, with massive testing and effective tracing and quarantining of those exposed to the virus. Compared with the four economic stimulus plans Congress has already passed, the cost of these public health measures is moderate. Congress has already spent more than $1 trillion on relief and recovery measures—and more will be necessary—but the cost of following the proven path these other nations have taken would run in the relatively modest tens of billions of dollars, and could save additional trillions of dollars in consequently unneeded stimulus costs down the road. 

There is much to be done. The federal government, state governments, and local governments must refocus and redouble their efforts to suppress the virus. A plan by Sens. Michael Bennet (D-CO) and Kirsten Gillibrand (D-NY) would create a national test-and-trace program that would hire hundreds of thousands of people who would help carry out testing, contact tracing, and eventually vaccinating to fight the coronavirus, at the cost of $55 billion. The Medical Supply Transparency and Delivery Act of Sens. Tammy Baldwin (D-WI) and Chris Murphy (D-CT) would finally rationalize the medical supply chain, utilizing the Defense Production Act to ensure the production of critical medical supplies.

At the state and local levels, the burgeoning test-and-trace programs that have been introduced can be scaled up and expanded with increased federal resources. The CARES act allocates some funding for contact tracing, but billions of dollars in additional funding is needed.

Recovery from the coronavirus pandemic and the coronavirus recession is neither close nor assured. This mission has not been accomplished. The federal government needs to act and spend aggressively to support families, workers, and states and localities, and restore consumer demand. Acting swiftly and certainly can mean the difference between a lengthy, weak recovery with unnecessary suffering by those who already suffer from economic and racial inequality, and a strong recovery that leads to stable, broad-based growth and a more equitable economy.


 -- via my feedly newsfeed

Saturday, July 25, 2020

Tim Taylor: An Update Concerning the Economics of Lighthouses [feedly]

A beautiful drill down on the history of "public goods" theory, and the role of technology in making them more powerful, cheaper, and unprofitable!

An Update Concerning the Economics of Lighthouses

https://conversableeconomist.blogspot.com/2020/07/updates-for-economics-of-lighthouses.html

Lighthouses have been a canonical example for economists--but what that example is intended to illustrate has shifted dramatically over time. 

The lighthouse example was original used by economists as an example of a situation where government provision of a good was necessary, because lighthouses could not easily impose charges on ships passing at sea, and so a private firm could not earn a profit by investing to build a lighthouse. This example dates back at least to John Stuart Mill's 1848 Principles of Political Economy. In Book V, Chapter XI, "Of the Grounds and Limits of the Laisser-faire or Non-Interference Principle," Mill writes: 
[I]t is a proper office of government to build and maintain lighthouses, establish buoys, &c. for the security of navigation: for since it is impossible that the ships at sea which are benefited by a lighthouse, should be made to pay a toll on the occasion of its use, no one would build lighthouses from motives of personal interest, unless indemnified and rewarded from a compulsory levy made by the state.
The lighthouse example was then cited by a succession of prominent authors as an example where government action was needed because markets could not function, including repeated mentions in Paul Samuelson's classic introductory textbook that defined economics pedagogy for most of the second half of the 20th century (and arguably since then, too). 

But Ronald Coase reversed this argument in his classic essay "The Lighthouse in Economics" (Journal of Law and Economics, October 1974, 17:2, pp. 357-376). He discussed the use of the lighthouse example by Mill, Samuelson, and others. But Coase then pointed out that however much these earlier arguments appealed to intuition, as a matter of actual historical fact, many British lighthouses in the 17th and 18th centuries were in fact built and run by private companies. 

The common process was that private investors would petition the Crown for a "patent" to build a lighthouse in a certain location. The petition was signed by local ship-builders and ship-owners, who pledged that they were willing to help pay for the lighthouse. "The King presumably used these grants of patents on occasion as a means of rewarding those who had served him. Later, the right to operate a lighthouse and to levy tolls was granted to individuals by Acts of Parliament." Ships that arrived in nearby ports where then charged tolls. In other cases, Trinity House--an institution dating back to the medieval guilds which had authority to regulate pilotage and shipping--would apply for a lighthouse "patent," and then lease the patent to a private individual who would provide the money for building the lighthouse and receive the funds. 

All markets rely on enforcing contracts and property rights. Coase argued that in the case of British lighthouses of this earlier time period: 
The role of the government was limited to the establishment and enforcement of property rights in the lighthouse. ... [E]conomists wishing to point to a service which is best provided by the government should use an example which has a more solid backing.
Of course, one might quarrel that when it comes to the distinction between the role of government and markets in lighthouses, Coase is splitting hairs. This is a case where government is granting a right to set  up what is in effect a local monopoly, and where government often also played a role (through customs agents) in collecting tolls in the ports. This is clearly not a multi-competitor free market in action.  But on the other side, Coase did show that the earlier argument that government itself needed to provide lighthouses was oversimplified. The British government back in the 17th and 18th century was not choosing sites for the private lighthouses, nor was it financing their construction. Moreover, the lighthouses were private property: those who owned lighthouses could sell them, or bequeath them to their heirs. In modern terminology, Coase is saying that a public-private partnership, in which the private partner is responsible for investment but is also able to make a profit, is not the same thing as outright government provision. 

There have been ongoing arguments since the 1974 Coase essay concerning how to think about the public and private roles. But there has been less discussion of how the changing role of technology might reshape the lines between public and private. Theresa Levitt argues that Coase was correct to point out the role of the private sector in lighthouses of the 17th and 18th centuries. However, she argues that changes in lens technology, greatly altering the cost and power of lighthouses, was an economic change leading back to the old wisdom that government provision of lighthouses was necessary. Her essay is "When Lighthouses became Public Goods: The Role of Technological Change" (Technology and Culture, January 2020, 61:1, pp. 144-172). She writes: 
The crucial technological change was in the illumination apparatus, with the introduction of mirrors in the 1780s and Fresnel lenses in the 1820s. This was not only a change in technical performance, as each development increased the brightness by more than an order of magnitude. It also brought about the sort of social and institutional transformations that historians of technology have identified as a technological system. As lighthouses became reliably visible at safe distances for sea-coast lighting the first time, their purpose and function changed, as well as their costs and financing. The lighthouse system of the seventeenth century discussed by Coase was fundamentally different from that of John Stuart Mill and Paul Samuelson, with different expectations, expenses, and implications for excludability. While a market could support the lights that existed before 1780, which were primarily effective at close range, it could not support the transformed system that emerged in the wake of improved illumination. Nor could the market provide for the technological improvements, with no private owners of lighthouses investing in Fresnel lenses, one of the key improvements. Only after England introduced greater state intervention did the lights improve.
The private lighthouses of the 17th and 18th centuries mostly burned candles or coal, and could be seen for no more than about five miles. But in the late 18th century and into the 19th century, there was a wave of innovation involving oil lamps for illumination and lenses to focus the light out to sea. But Levitt argues that the breakthrough innovation was the Fresnel lens in 1820. France had abolished private lighthouses in 1792, and instead used a government Lighthouse Commission. This government commission hired August Fresnel to design and install this new light, which was essentially visible all the way to the horizon. Levitt describes the next step: 
The French Lighthouse Commission placed Fresnel in charge of a massive overhaul of the French lighthouse system known as the Carte des phares. ... Instead of focusing on port entrances alone, the plan was now to form a rational network which would illuminate the entire coast, so that whenever a ship went out of sight of one lighthouse, it would already be entering into sight of another. ... Fresnel divided the lights into different orders based on their size, with the largest, first-order lights warning of a ship's first approach to the coast, second-order lights aiding in the navigation of tricky passages, and the smaller "feux de port" marking port entrances. ...

One of the key attributes of the system was that it would allow mariners to distinguish between the lights, and thus know their precise location at all times. Fresnel proposed three distinct light signatures: a rotating light of eight bulls-eye panels that flashed every minute, a rotating light of sixteen panels that flashed every thirty seconds and a fixed light that gave out a continuous beam . The rotating lenses were mounted on columns that were turned first by an escapement mechanism, then by chariot wheels, and finally on a mercury bath (an idea conceived by Fresnel but not put into practice until the 1890s). The parabolic apparatus could also be rotated to produce a distinct flashing light. But Fresnel went one step further: carefully arranging the various lights so that no two similar ones were alike, and, with the visibility of lights overlapping, a sailor would be able to identify their location with precision. Jules Michelet commemorated the completion of the project in 1854 with the phrase, "For the sailor who steers by the stars, it was as if another heaven had descended to earth."
Levitt makes a case that when John Stuart Mill was writing about lighthouses back in 1848, he was well aware of these changes. It turns out that one of Mill's childhood teaches was a British leader in efforts for upgrading Britain's lighthouses, which for a long time lagged behind those of France. The US soon adopted the French approach. 
The United States had leapfrogged over Britain as well after adopting the French model of lighthouse provisioning. The colonies built ten lighthouses under British rule ...  The federal government appropriated them in 1789 in the first application of the Commerce Clause. Substantial investment in infrastructure only came in the 1850s, however, when a coalition of sailors, scientists, and engineers demanded the creation of a lighthouse board modeled on the French Lighthouse Committee. This board effected a massive, tax-funded program of new building and updated technology, and by the end of 1859 the United States had more than twice as many lighthouses as the British, virtually all of them equipped them with Fresnel lenses.
Thus, the history of lighthouses suggests a lesson that for focused and local projects with static technology, a public-private partnership can work well. But for development and investment in a new technology which will be applied to an interconnected national network where it is difficult to charge end-users for value received, government may usefully play a larger role. Levitt writes: 
This fact can also help us understand the lighthouse's transformation into a public good. When lights simply marked harbors, one could charge every ship that entered the harbor. But when a light marked some empty, desolate stretch of coast, it was not so easy to charge whoever happened to pass by. Rather than being "plucked from the air," Mill's position accurately reflected the new situation. ... A more detailed study of lighthouse administration supports the status of the lighthouse as a public good: the private market failed to either develop or invest in the technology necessary to establish the effective sea-coast lights now associated with the term "lighthouse."

 -- via my feedly newsfeed

Q2 GDP Forecasts: Probably Around 35% Annual Rate Decline [feedly]

Q2 GDP Forecasts: Probably Around 35% Annual Rate Decline
http://feedproxy.google.com/~r/CalculatedRisk/~3/NUsuPnCtCl0/q2-gdp-forecasts-probably-around-35_24.html

Important: GDP is reported at a seasonally adjusted annual rate (SAAR). So a 35% Q2 decline is around 10% decline from Q1 (SA).

From Merrill Lynch: 
The advance 2Q GDP estimate comes out next Thursday and will reveal the depth of the recession. Real activity likely collapsed -36% qoq saar, translating into a peak-to-trough decline of -11.7%. ... We forecast a contraction of -5.7% in 2020, followed by a 3.4% rebound 2021. [July 24 estimate]
emphasis added
From the NY Fed Nowcasting Report
The New York Fed Staff Nowcast stands at -14.3% for 2020:Q2 and 13.3% for 2020:Q3. [July 24 estimate]
And from the Altanta Fed: GDPNow
The GDPNow model estimate for real GDP growth (seasonally adjusted annual rate) in the second quarter of 2020 is -34.7 percent on July 17, down from -34.5 percent on July 16. [July 17 estimate]

 -- via my feedly newsfeed