Thursday, April 23, 2020

Weekly Initial Unemployment Claims decrease to 4,427,000 [feedly]

Weekly Initial Unemployment Claims decrease to 4,427,000
http://www.calculatedriskblog.com/2020/04/weekly-initial-unemployment-claims_23.html

The DOL reported:
In the week ending April 18, the advance figure for seasonally adjusted initial claims was 4,427,000, a decrease of 810,000 from the previous week's revised level. The previous week's level was revised down by 8,000 from 5,245,000 to 5,237,000. The 4-week moving average was 5,786,500, an increase of 280,000 from the previous week's revised average. The previous week's average was revised down by 2,000 from 5,508,500 to 5,506,500. 
emphasis added
The previous week was revised down.

The following graph shows the 4-week moving average of weekly claims since 1971.

Click on graph for larger image.

The dashed line on the graph is the current 4-week average. The four-week average of weekly unemployment claims increased to 5,786,500.

This was higher than the consensus forecast.

The second graph shows seasonally adjust continued claims since 1967 (lags initial by one week while increasing sharply).

At the worst of the Great Recession, continued claims peaked at 6.635 million, but then steadily declined.

Continued claims have already increased to a new record high of 15.976 million (SA) and will increase further over the next few weeks - and likely stay at that high level until the crisis abates.  

 -- via my feedly newsfeed

Trump’s corporate first agenda has weakened worker protections needed to combat the coronavirus [feedly]

Trump's corporate first agenda has weakened worker protections needed to combat the coronavirus
https://www.epi.org/blog/trumps-corporate-first-agenda-has-weakened-worker-protections-needed-to-combat-the-coronavirus/

Using the COVID-19 pandemic as cover, the Trump administration is reportedly preparing to take executive action to repeal and suspend federal regulations. This should not be a surprise—one of Trump's first actions after taking office was to issue an executive order requiring federal agencies to identify at least two existing regulations to "repeal" when proposing a new regulation. Now seizing on the public health crisis and its economic impact as an excuse, the Trump administration is framing this renewed push to deregulate as a necessary policy response to promote economic growth, focusing on repealing and suspending regulations that impact businesses.

Deregulation has long been a central component of the corporate-interest agenda and the Trump administration has certainly obliged. While the coronavirus was not under anyone's control, President Trump's failure to establish strong worker protections during his first term, through laws and regulations, has helped create the crisis millions of essential workers now confront every day on the job. The following are examples of how the Trump administration's corporate-driven agenda has weakened worker protections needed to combat the coronavirus.

President Trump blocked the Workplace Injury and Illness record-keeping rule, which would have clarified an employer's obligation under the Occupational Safety and Health Act to maintain accurate records of workplace injuries and illnesses. As a result, OSHA does not require employers to keep accurate records that could be used to identify unsafe, potentially life-threatening working conditions.

President Trump blocked the Fair Pay and Safe Workplaces rule, which would have helped ensure that taxpayer dollars were not awarded to contractors who violate basic labor and employment laws. Without this regulatory safeguard, more than 300,000 workers have been the victims of wage-related labor violations while working under federal contracts in the last decade.

President Trump blocked a rule limiting the circumstances under which individuals filing for unemployment benefits may be subjected to drug testing. As a result, unemployed workers continue to face barriers when seeking unemployment insurance (UI) benefits, including the more than 20 million workers who have filed for UI benefits during this crisis.

Deregulation is often pursued under the guise that regulations are economically burdensome. However, even under the Trump administration, the Office of Management and Budget (OMB) reportedthat the benefits of regulations outweigh the costs. Furthermore, failing to regulate or delaying worker protection rules risks workers' health and safety. For example, the Trump administration delayed the implementation of an OSHA rule that limited workers' exposure to silica dust, which has been linked to lung cancer. By delaying the rule, the Trump administration increased the likelihood of more workers being exposed to silica dust and developing silicosis. Impacted workers and their families are left to bear the costs associated with illness.

Regulations implement policy initiatives. Simply repealing or suspending regulations without considering the policy implications is irresponsible. Using a global pandemic as an excuse to deliver on longstanding corporate priorities to repeal, suspend, and delay the rules that protect workers is shameful. At a time when workers are routinely risking their lives to perform essential services for our nation, they deserve stronger workplace protections, not a loosening of existing standards.

It is true that crises present unique opportunity for the advancement of a policy agenda. This moment could be used to implement policies that help ensure workers' health and safety, or to instead satisfy longstanding corporate interests. Given its track record, it is unsurprising that the Trump administration is responding to the current public health crisis by looking for ways to deregulate worker protection rules and promote corporate interests, even implementing a liability waiver for employers that would shield them from legal responsibility when workers contract the coronavirus on the job.

This moment does mark an opportunity to reshape a system that has long served corporate interests at the expense of working people. Unfortunately, the Trump administration is choosing once again to pursue a corporate first agenda.


 -- via my feedly newsfeed

Tuesday, April 21, 2020

Do we Really Know that Chinese COVID-19 Statistics are being Manipulated? [feedly]

Do we Really Know that Chinese COVID-19 Statistics are being Manipulated?
https://www.globalpolicyjournal.com/blog/18/04/2020/do-we-really-know-chinese-covid-19-statistics-are-being-manipulated


In all likelihood Chinese statistics on the pandemic's spread are no worse – and no better -- than figures from Western democracies, suggest Roberto Aragão and Lukas Linsi.

For several weeks now global sports have been in lockdown. Stepping into the breach, a new pastime seems to have taken hold of news-hungry home-confined citizens: the following of coronavirus statistics. Facilitated by the attractive and user-friendly visualization of country-by-country infection and death rates in portals such as Johns Hopkins' "Covid-19 map", it has given rise to a novel, rather macabre, sort of international competition. Questions like "in which country did most people get infected today?", or "are we still ahead of our neighbouring countries in terms of deaths?" have become hot topics at virtual cocktail parties and 'Skypéros'. But this new sport is not only problematic on moral grounds. It also constitutes a largely meaningless exercise for mundane statistical reasons. The truth is that, for the most part, Covid-19 statistics are not informative indicators. And in particular they are not suited for cross-country comparisons.

The key figure of interest among followers of Covid-19 statistics is a country's "case fatality rate": the number of deaths in a country (the numerator) divided by the number of infections (the denominator). The resulting 'league table' ranks countries from the lowest rates – the places where governments and health authorities, so the story goes, have responded best to the crisis – to the highest. The problem is that both the numerator and denominator are biased in different directions in different countries. As a result, fatality rates are likely to be highly misleading when taken at face value.

Why is that so? Let's start with the numerator. Counting the number of deaths due to Covid-19 infections is more complicated than it may sound. Establishing the cause of someone's death can be hard, especially for patients suffering from several health problems simultaneously as well as for people who die outside of hospitals with little or no medical supervision. Because of such issues, authorities in different countries can count deaths differently. For instance, Covid-19 mortality statistics from some countries only include patients who passed away at a hospital, while others also include patients who deceased at home. Some countries only register a death as being caused by Covid-19 if the patient actually tested positive for the virus, whereas others do so if a patient showed Covid-19-like symptoms without having been tested for the disease. Likewise, in cases of multiple simultaneous medical conditions, some places indicate Covid-19 as the cause of death even if it may be due to a combination of factorsothers don't.

Moving from the nominator to the denominator, measurement problems become even more pronounced. This has to do with persisting uncertainties about the epidemiological character of the disease as well as well-known deficiencies in testing capabilities that most countries face. As of today, the number of asymptomatic cases (i.e. patients carrying the disease without showing symptoms) remains one of the great mysteries that epidemiologists trying to understand the rapid spread of the virus are trying to untangle. According to some studies the figure may be around 5 percent of total cases; according to others it may be as high as 80 percent. This means, in essence, that at present total actual infection rates (including symptomatic and asymptomatic) cannot be known with any certainty.

But we are not only uncertain about the extent of asymptomatic cases. Detection rates for symptomatic cases also vary dramatically across countries. This is primarily due to vast differences in countries' testing strategies and capacities. A few small countries that test a lot (like Iceland) may be able to identify a good share of cases for which patients show symptoms. But in most countries detection rates are believed to be much lower. Even in a country with extensive testing like Germany the rate may lie well below 50 percent, while in developed countries with little testing, such as the Netherlands, the rate may be as low as 5 percent. So how many symptomatic infections may there be if say 10,000 cases have been detected in a country? The true figure may lie somewhere between 10,000-20,000 in a country carrying out extensive testing such as Germany, but anywhere between 10,000 and 200,000 in a country with little testing such as the Netherlands. In developing countries with less well-resourced health systems the true figure may be much higher still. If we take such issues into account, it seems clear that standardizing death rates by the number of detected cases and comparing them across countries makes little sense.

Cross-national differences in measurement practices are not unique to Covid-19 statistics. They are an intrinsic problem of most social indicators. In earlier research we have examined these same issues for highly established macroeconomic statistics with a proud history. Even there, we found that -- despite efforts by international organizations to harmonize statistics stretching back more than seven decades – significant cross-country discrepancies persist. In other words: even if Covid-19 statistics become somewhat better in the months and years to come as testing capacities improve, these problems will not disappear. Comparing them across countries is not meaningful today, and will remain fraught with difficulties in the future as well.

At a deeper level, the case of Covid-19 statistics is useful to illustrate an important general point about the politics of numbers: statistics are not mere reflectors of objective truths. They are socially and politically constructed concepts that are inherently ambiguous. As we have emphasized in our earlier research, recognizing the "softness" of numbers is crucial to better understand the politics of statistics. Not least, it pushes us to engage more critically with claims about "right" and "wrong" numbers – and, of particular importance in light of contemporary debates, claims about the manipulation of certain figures.

Debates about the manipulation of Chinese statistics

While everyone picks their own favourite when tracking Covid-19 statistics, most people in the Western world – ranging from the US President and the CIA to academics and the liberal press -- seem to be able to agree on at least one point: Chinese statistics on the spread of the virus are subject to political manipulation and hence particularly unreliable. As soon as the news that China added 1,290 deaths to the Wuhan death count hit the news this morning, commentators were quick to vindicate the statistical revision as proof of deliberate under-reporting as part of a general "cover-up" operation by the Chinese government.

Although we have no first-hand insights into the compilation of Covid-19 statistics in China, we have studied attempts by governments to manipulate economic statistics for several years. Based on our research findings, we have doubts about such assertions. As is the case for Covid-19 figures, macroeconomic statistics from China are also frequently singled out as being subject to political manipulation. As we found out, evidence supporting these claims is however not that strong for national-level economic data. While there is some evidence that subnational data from provincial authorities tend to overstate economic performance, the central governmental apparatus is highly aware of these dynamics and the Central Statistical Office uses a variety of methods to check and correct data submitted by subnational authorities, netting out most of these biases. While some studies still do indicate some remaining biases in national-level economic data, these are small in substantive terms, not unlike similar biases uncovered for a wide range of economic statistics observed in macroeconomic statistics from Western democracies. At least one study suggests that national-level economic data from China may even understate actual Chinese economic performance.

While Covid-19 statistics are different from macroeconomic data in some aspects, there are important parallels. Similar to economic statistics, both the theoretical and empirical case for large-scale manipulation is weak. Let's unpack them one by one.

Theoretically, it remains unclear what a rational government in the situation that the Communist Party currently finds itself in would have to gain from obscuring the facts. Deliberately understating the seriousness of the situation would almost certainly foment the outbreak of a second wave of infections and a sharp increase in deaths. Attempts to hide a second outbreak would almost certainly prove futile as bodies pile up -- and very seriously undermine the legitimacy of the government. It seems altogether implausible that a rational government would take such risks simply to boast about its superior crisis management skills for a short while.

Empirically, it is almost certainly true that Chinese data is faulty. But that in itself is no proof of deliberate manipulation. China too grapples with the same serious measurement problems that Western democracies face. But when the Chinese government revises the death count upwards (as it did for Wuhan this morning) analysts are quick to shout "cover up" – irrespective of the fact that health authorities in Western democracies from New YorkItaly, the UK among many others have done exactly the same thing over the past days and weeks without attracting such scrutiny.

To evaluate these intuitions somewhat more systematically, we conducted a 'back-of-the-envelope' calculation of the size of potential under-reporting in China using the open-access infection spread model developed by Nate Silver. For what they're worth, the projections indicate that official Chinese case counts may under-estimate actual infection rates by about 75 percent. Now that is a substantial underestimation. However, it is relatively good in comparison to similar (and more rigorous) calculations made for some European countries by Neil Ferguson's team at Imperial College. Their estimates suggest that – depending on the extent of asymptomatic infections – case counts from European countries may very well be under-reporting actual infection rates by more than 95 percent (and even 99 percent in the UK). So yes, Chinese case counts are likely to be far off, but they are no worse than those from liberal democracies.

The need for a scapegoat

Having studied data manipulation scandals in a variety of settings in depth over the past years, these dynamics are similar to what we have observed in many other instances as well. Most of the time, data manipulation scandals do not arise due to a sudden flagrant intervention with the production of statistics. They typically occur when it is in the interest of the accuser to see a data manipulation scandal dominating the news cycle. Contrary to their pretense to accuracy and objectivity, statistics have non-negligible error margins attached to them and they have various kinds of biases baked into them. But these biases typically only come to the fore in public debates when it is in someone's interest to construct a data manipulation scandal. As we have argued, there are several indications that this time is no different.

We do not wish to whitewash Chinese statistics or the actions of the Chinese government. Chinese Covid-19 statistics are as imperfect as those of any other nation. There are serious questions that need to be asked about the role of the Chinese Communist Party in this crisis. But faulty numbers are far from being the most relevant one. Increasingly prominent claims in Western capitals that Chinese Covid-19 data is manipulated are not well founded. They are aimed at scapegoating more than anything else. Anyone claiming that Chinese numbers are the problem is trying to distract from what really matters: facing and finding ways out of an unprecedented global crisis.


Lukas Linsi is assistant professor of international political economy at the University of Groningen, Netherlands. Roberto Aragão is a PhD candidate at the University of Amsterdam, Netherlands. Both are affiliated to the Fickle Formulas research group.

Image: Markus Spiske via Pexels


 -- via my feedly newsfeed

Health Care Headed for One-Fifth of US Economy [feedly]

Health Care Headed for One-Fifth of US Economy
https://conversableeconomist.blogspot.com/2020/04/health-care-headed-for-one-fifth-of-us.html

I view myself as a fairly jaded consumer of statistics on rising health care costs, but the most recent 10-year projections from the US Centers for Medicare and Medicaid Services widened my eyes. They appear in "National Health Expenditure Projections, 2019–28: Expected Rebound In Prices Drives Rising Spending Growth," by Sean P. Keehan, Gigi A. Cuckler, John A. Poisal, Andrea M. Sisko, Sheila D. Smith, Andrew J. Madison, Kathryn E. Rennie, Jacqueline A. Fiore, and James C. Hardesty, appearing in Health Affairs (April 2020, pp. 704-714, not freely available online).The team writes:
National health spending is projected to increase 5.4 percent per year, on average, for 2019– 28, compared to a growth rate of 4.5 percent over the past three years (2016–18). The acceleration is largely due to expected faster growth in prices for medical goods and services (2.4 percent for 2019–28, compared to 1.3 percent for 2016–18). Growth in gross domestic product (GDP) during the projection period is expected to average 4.3 percent. Because national health spending growth is expected to increase 1.1 percentage points faster, on average, than growth in GDP over the projection period, the health share of GDP is expected to rise from 17.7 percent in 2018 to 19.7 percent in 2028 ...
A few thoughts here:

1) Total US health care spending was 5.0% of GDP in 1960, 8.9% of GDP in 1980, 13.4% of GDP in 2000, 17.7% of GDP in 2018, and now headed for 19.7% of GDP.

2)  I'm not in the business of predicting long-run effects of COVID-19, but it seems unlikely to me that the result will be a smaller rise in health care spending.

3) At this point, it's fairly clear  that the Patient Protection and Accessible Care Act of 2010 didn't have much lasting effect on holding down health care costs.

4) Just for perspective, remember that the US already leads the world in health care spending by a wide margin. This figure shows OECD data on health care spending for 2018 as a share of GDP compared with a selection of countries, with the bar for the US at the far left. The red bar is the average for the 36 OECD countries.

This figure shows per capita health care spending across a selection of countries, with the bar for the US again at the far left. Again, the red bar is the average for the 36 OECD countries.

5) It's not rocket science to figure out some ways to at least hold down the rise in US health care spending. Some of the policies would focus on non-medical interventions, like exercise and diet. Some would focus on helping patients to manage chronic conditions, so that they are less likely to turn into hyper-expensive episodes of hospitalization. There are mainstream estimates that perhaps 25% of health care spending is wasted.

6) There is some evidence that Americans are beginning to put the costs of health care as the top issue of concern for them in US health care policy. The reasons have all been said before, but they bear repeating. When companies compensate employees, the more they spend on employee health insurance, the less they have to spend on take-home pay. A substantial part of government support for the poor is in the form of health insurance (over $8,000 per Medicaid enrollee), not money they can spend on other needs. Health care expenses are a main driver of tight and inflexible government budgets at the state level, and of long-term rising budget deficits at the federal level. Americans are paying a lot more for health care than other countries, but not obtaining better health outcomes than other countries.

None of this is new. But as we head for a US economy that is one-fifth health care, the path we are on is perhaps worth renewed consideration  

 -- via my feedly newsfeed

Greenstein: New COVID-19 Bill Helpful But Inadequate — More Needed for States and Localities, the Most Vulnerable, and the Economy [feedly]

Greenstein: New COVID-19 Bill Helpful But Inadequate — More Needed for States and Localities, the Most Vulnerable, and the Economy
https://www.cbpp.org/press/statements/greenstein-new-covid-19-bill-helpful-but-inadequate-more-needed-for-states-and

CBPP today released a statement from Robert Greenstein, president, on the announcement of a bipartisan deal on a new coronavirus relief package.

While providing needed support to small businesses and hospitals, the new COVID-19 package announced today falls short even as an interim measure, failing to deliver crucial state and local fiscal relief and food assistance.

The White House's refusal to provide more relief to states — whose revenues are plummeting due to the virus' effect on economic activity — will almost certainly lead many states to cut education and other critical services, including even health care, and to lay off teachers and other workers as states struggle to balance their budgets both for the fiscal year ending June 30 and the new fiscal year that starts July 1. The approaching state budget cuts (and possibly tax increases in some areas) will cause the U.S. economy to contract further — making the economic downturn deeper and more protracted, causing many more people to lose their jobs, and magnifying the serious hardship we already see.

GIVEN THE SIGNIFICANT GAPS IN THIS LEGISLATION, IT'S CRITICAL FOR POLICYMAKERS TO BEGIN WORK RIGHT AWAY ON A NEW ROUND OF POLICIES THAT WILL MORE ADEQUATELY MEET THE NATION'S NEEDS.Similarly disappointing is the White House's and congressional Republicans' refusal to include in the new package an increase in the maximum SNAP (food stamp) benefit, as was done in the last recession. This measure, too, would both alleviate hardship and benefit the economy. Both the Congressional Budget Office and Moody's Analytics rank this measure among the most effective stimulative steps the federal government can take in a recession, on a bang-for-the-buck basis.

Given the significant gaps in this legislation, it's critical for policymakers to begin work right away on a new round of policies that will more adequately meet the nation's needs.

Legislation Omits State and Local Aid

States badly need substantial additional fiscal relief to help address the daunting budget crises they face. Local governments need assistance as well. Despite efforts from House Speaker Nancy Pelosi and Senate Minority Leader Chuck Schumer, however, additional aid was blocked from inclusion in the new package.

State budget shortfalls could total more than $500 billion over the next few years, which will dwarf the roughly $65 billion in aid in earlier COVID-19 packages that is readily available to narrow those shortfalls. Without substantially more aid, states — which are required to balance their budgets every year, even in recessions and depressions — will almost certainly lay off teachers and other workers and cut health care, education, and other key services, making the economic downturn more severe.

States' costs are rising rapidly now as they seek to contain the coronavirus, and as businesses lay off workers and incomes fall, forcing many more people to turn to Medicaid and other assistance. At the same time, state revenues are plummeting, knocking state budgets far out of balance. Maryland, for example, projects a 15 percent shortfall for this fiscal year; Michigan projects shortfalls of up to 12 percent. And the shortfalls for the new state fiscal year that starts July 1 in most states will likely be much greater and could well be of a magnitude not seen since the Great Depression, nearly a century ago.

A key way to get fiscal relief to states is by building on an increase Congress previously provided in the federal share of Medicaid costs (FMAP). This increase is a good first step, but it's too small and expires when the official health emergency ends, even though state economies likely will still be ailing well beyond that. This additional, temporary FMAP increase would prevent Medicaid cuts that could cause millions of people to lose coverage or access to critical services during a public health crisis, while also freeing up some state resources to narrow states' budget gaps. Federal policymakers should also increase and extend the Coronavirus Relief Fund and give states the flexibility to use it to cover rising costs in a wide range of programs and to offset the steep revenue losses they face.

Deal Also Lacks Food Assistance for Struggling Families

Despite more than 20 million people becoming unemployed in recent weeks and striking images of thousands of people lined up at food banks around the country, the White House and its allies on Capitol Hill also blocked inclusion of a boost in SNAP benefits in the new package.

Policymakers should address this in the next response measure. Temporarily raising the maximum SNAP benefit would be effective, efficient, and timely. States can deliver an increase in the basic SNAP benefit in a matter of weeks, without new applications or procedures. SNAP benefits are modest, averaging about $1.40 per person per meal, less than what most families need to put adequate food on the table throughout the month. Inadequate benefit levels are particularly problematic during an economic downturn when many families face income losses and joblessness tends to last for considerably longer periods than during stronger economic times. This raises the risk of families — including many with very young children, who are overrepresented among very poor households — facing more serious hardship as a result of the downturn.

Rapid Action Needed on These and Other Fronts

Various policymakers have said they intend to craft a more comprehensive response package at some point after finishing the small business package. The next package should not only address immediate needs and problematic gaps in the earlier relief measures, but also ensure that key provisions to keep the economy from sinking further and to alleviate hardship remain in place until unemployment is no longer high and the economy has significantly recovered. This is essential to ensuring that relief measures don't stop too soon, weakening the economy while leaving families and state and local governments bereft of needed help.

In addition to strengthened state and local fiscal relief and food assistance, priorities for a future package include:

Extending key unemployment insurance and other provisions now set to expire in coming months — well before the need for them will abate — by tying them to economic triggers so they neither expire prematurely nor remain in effect too long;
Mitigating the loss of health insurance and strengthening coverage to ensure that people can access needed health care during the public health crisis;
Addressing the needs of the most vulnerable households in various ways to prevent a spike in evictions, homelessness, food insecurity, and other hardships that are especially dangerous during a pandemic; and
Ensuring that immigrants and their families have access to assistance rather than being excluded from it.

# # # #

The Center on Budget and Policy Priorities is a nonprofit, nonpartisan research organization and policy institute that conducts research and analysis on a range of government policies and programs. It is supported primarily by foundation grants.

TOPICS:
Federal Budget, State Budget and Tax, Economy, Food Assistance

The Center on Budget and Policy Priorities is a nonprofit, nonpartisan research organization and policy institute that conducts research and analysis on a range of government policies and programs. It is supported primarily by foundation grants.


 -- via my feedly newsfeed

Updated state unemployment numbers remain astonishingly high: Six states saw record-high levels of initial unemployment claims last week [feedly]

Updated state unemployment numbers remain astonishingly high: Six states saw record-high levels of initial unemployment claims last week
https://www.epi.org/blog/updated-state-unemployment-numbers-remain-astonishingly-high-six-states-saw-record-high-levels-of-initial-unemployment-claims-last-week/

This morning, the Department of Labor released the latest initial unemployment insurance (UI) claims data, showing that another five million people (not seasonally adjusted) filed for UI last week. In the last four weeks, more than 20 million workers—whose economic security has been upended by the coronavirus crisis and inadequate policy responses—filed for UI.

Last week, Colorado, New York, South Carolina, Connecticut, Mississippi, and West Virginia saw their highest level of initial UI claim filings ever. These six states, along with Florida, Missouri, and North Carolina, saw increases in initial filings compared with the prior week.

Most states had fewer initial UI claims last week than the week prior, but the number of UI claims remained astonishingly high. California and Michigan—the two states with the largest decline since the week before—still had 661,000 and 219,000 claims filed last week, respectively—the third highest week on record for both.

Figure A compares UI claims filed last week with filings in the pre-virus period, showing once again that Southern states are faring particularly poorly. Seven of the 10 states that had the highest percent change last week relative to the pre-virus period are Southern: Georgia, Mississippi, North Carolina, Louisiana, Kentucky, South Carolina, and Alabama.

Figure A

Table 1 shows the data displayed in the map as well as the change in UI claims over the last five weeks relative to the same five-week period a year ago.

These UI claims represent a devastating loss of income and security for workers and their families and also have exacerbated existing inequalities. Women have been overrepresented in the number of job losses so far. The leisure and hospitality sector, which has laid off the most workers, disproportionately employs immigrants and people of color.

The staggering number of claims has also placed an enormous amount of strain on the agencies tasked with administering these benefits. Federal funding is needed to support these agencies and states must leverage existing laws to get aid to workers quickly.

For 9.2 million workers in the last four weeks, losing their job meant also losing their employer-provided health insurance. The federal government should expand Medicare and Medicaid to these workers so that they are able to seek care during the pandemic, should they need it. The United States could also follow the lead of other countries, such as Denmark and the Netherlands, by undertaking other transformative measures to guarantee paychecks to all workers. At a minimum, policymakers must address gaps in the existing coronavirus relief and recovery measures, including insufficient aid to state and local governments, in a fourth package.

Table 1

 -- via my feedly newsfeed

Monday, April 20, 2020

WTO: Projections for World Trade in 2020 [feedly]

WTO: Projections for World Trade in 2020
http://conversableeconomist.blogspot.com/2020/04/the-wto-projections-for-world-trade-in.html

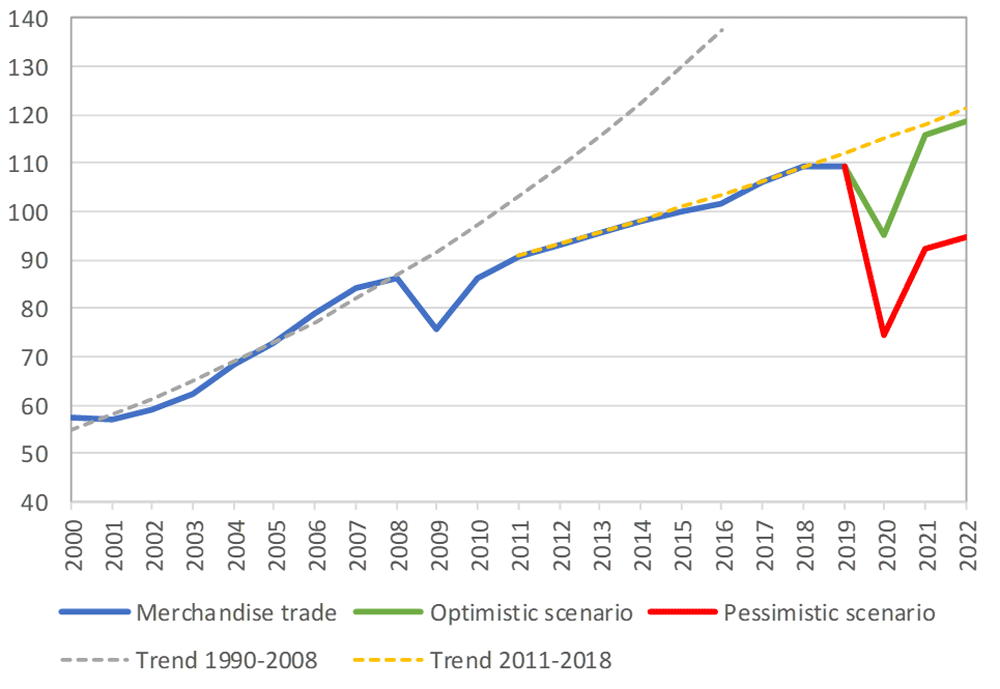
For those who see international trade as a destructive force, the dismal economic news of 2020 comes with as silver lining: as the World Trade Organization puts it, "Trade set to plunge as COVID-19 pandemic upends global economy" (April 8, 2020). The WTO predicts: "World merchandise trade is set to plummet by between 13 and 32% in 2020 due to the COVID-19 pandemic."

The predicted slowdown in trade for 2020 is certainly no surprise, but the WTO report provided some context of patterns of trade since 2000 that seemed worth passing along.

One is that global trade slowed down after about 2008. I suspect that much of this change reflects patterns from China, where exports were growing much faster than GDP from 2001 up to about 2007, but since then have growth more slowly than GDP. The blue dashed lie shows the trendline of global trade if predicting based on 2000-2008. The yellow dashed line shows the flatter trendline  predicting based on on the years 2011-2018. The red and green lines show a range of trade projections for 2020 through 2022. Again, for those who see international trade as a destructive force, the slowdown after about 2008 and the sharp drop expected for 2020 should presumably be worth celebrating.


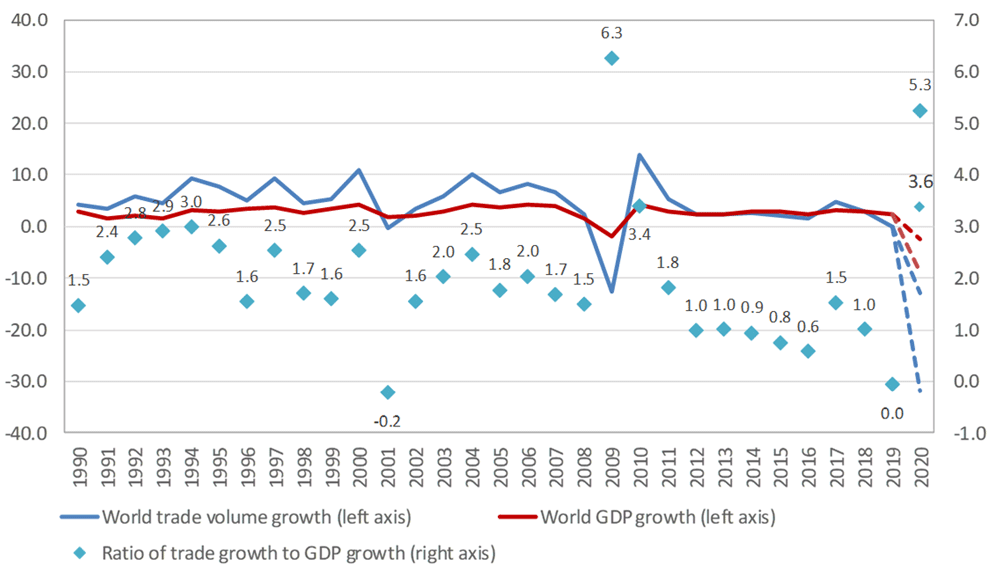
There's a classic argument among economists as to whether trade should be viewed as a cause of economic growth, or whether trade is just a by-product of economic growth (see "Trade: Engine or Handmaiden of Growth?",  January 23, 2017).  I won't revisit those arguments here, but instead just show the pattern. The red line shows the annual rate of world GDP growth; the blue line shows growth in the volume of world trade. The blue diamonds show the ratio between trade growth and world GDP growth in each year.


Through the 1990s and into the 2000s, it was common for the growth rate of trade to be higher than the growth rate of world GDP, so the ratios on the left-hand side of the figure are typically bigger than 1, and sometimes bigger than two. But since about 2011, world GDP has commonly grown at the same speed as trade or somewhat slower, so ratios of 1.0 or less are more common. In 2019, trade growth was about zero, so the ratio was also about zero. For 2020, the ratio will presumably turn negative, because the rate of growth for trade will be considerably more negative than the (also negative) rate of growth for world GDP.

In particular, the WTO forecasts big falls in two subsets of international trade in 2020: the trade linked to global supply chains, and in services trade. The WTO writes:
Value chain disruption was already an issue when COVID‑19 was mostly confined to China. It remains a salient factor now that the disease has become more widespread. Trade is likely to fall more steeply in sectors characterized by complex value chain linkages, particularly in electronics and automotive products. According to the OECD Trade In Value Added (TiVa) database, the share of foreign value added in electronics exports was around 10% for the United States, 25% for China, more than 30% for Korea, greater than 40% for Singapore and more than 50% for Mexico, Malaysia and Vietnam. ...
Services trade may be the component of world trade most directly affected by COVID-19 through the imposition of transport and travel restrictions and the closure of many retail and hospitality establishments. Services are not included in the WTO's merchandise trade forecast, but most trade in goods would be impossible without them (e.g. transport). Unlike goods, there are no inventories of services to be drawn down today and restocked at a later stage. As a result, declines in services trade during the pandemic may be lost forever. Services are also interconnected, with air transport enabling an ecosystem of other cultural, sporting and recreational activities. However, some services may benefit from the crisis. This is true of information technology services, demand for which has boomed as companies try to enable employees to work from home and people socialise remotely.

I see a certain amount of casual jibber-jabber from both ends of the political spectrum about how at least this recession gives the US a chance to separate itself from the rest of the global economy. The disruptions and costs inherent in making such a change should not be taken lightly.  

 -- via my feedly newsfeed