Monday, March 25, 2019

Raising the Curtain: Trade and Empire [feedly]

An interesting tidbit from Brad DeLong's many interests in economic history: 

My take: Trade and imperialism -- is not their ultimate legacy a global society? and thus, internationalism shall finally, and inevitably rise as the true humanism. The goods and  bads are intertwined.

Raising the Curtain: Trade and Empire
Yet Another Outtake from "Slouching Towards Utopia?: An Economic History of the Long Twentieth Century, 1870-2016"  

https://www.bradford-delong.com/2019/03/raising-the-curtain-the-long-twentieth-centurytrade-and-empire-yet-another-outtake-from-slouching-towards-utopia-an-e.html

Raising the Curtain: The Long Twentieth Century—Trade and Empire

The extent to which the navies and trading fleets of the great European sea-borne empires of the sixteenth, seventeenth, and eighteenth centuries shaped the industrial development of western Europe has always been one of the most fiercely-debated and unsettled topics in economic history. That European expansion in the sixteenth, seventeenth, and eighteenth centuries were catastrophes for the regions of west Africa that were the sources of the slave trade; for the Amerindians of the Caribbean; for the Aztecs, Incas, the mound-builders of the Mississippi valley; and for the princes of Bengal and others who found themselves competing with the British East India Company in the succession wars over the spoils of India's Moghul Empire—that is not in dispute.

But how much did pre-industrial trade and plunder affect European development? That is not so clear.

It is clear is that even at the end of the eighteenth and the first half of the nineteenth century trade not in luxuries but in staples had begun to profoundly shape history. For the first time transoceanic trade mattered not just for a ruling elite but for an economy as a whole. The export of cotton from the American South and had mattered. Without the appetite of British and New England factories for cotton and the power to ship ginned cotton to them cheaply, the slaves of the American South in 1860 would have been what they were for George Washington in the 1790s: a quarter of your wealth that you were willing to free, at least upon your death, because it was the right thing to do. By contrast, for Jefferson Davis it wasn't his land but rather his slaves that were three-quarters of his wealth—and so the U.S. Civil War of 1861-5 came.

Early-nineteenth century cotton showed what late-eighteenth century sugar had prefigured. The export of sugar from the Caribbean islands and Latin America (and also tobacco, tea, coffee, chocolate, and so forth) meant that European agriculture did not have to grow nearly as much flax or raise as much wool or produce as many calories. It provided an extra edge to the British economy: as if there was perhaps one additional ghost worker who did not have to be fed or paid alongside every ten.

That, from the perspective of 1870, was what the expanded intercontinental division of labor and the higher productivity that resulted from it had done up to that point.


 -- via my feedly newsfeed

Friday, March 22, 2019

Reentry from Out of the Labor Market [feedly]

A deeper look at what it means to be "in" or "out" of the labor market.

Reentry from Out of the Labor Market
https://conversableeconomist.blogspot.com/2019/03/reentry-from-out-of-labor-market.html

Each year, the White House Council of Economic Advisers published the Economic Report of the President, which can be thought of as a loyalist's view of the current economic situation. For example, if you are interested in a rock-ribbed defense of the Tax Cuts and Jobs Act passed in December 2017 or of the deregulatory policies of the Trump administration looks like, then Chapters 1 and 2 of the 2019 report are for you. Of course, some people will read these chapters with the intention of citing the evidence in support of the Trump administration, while others will be planning to use the chapters for intellectual target practice. The report will prove useful for both purposes.

Here, I'll focus on some pieces of the 2019 Economic Report of the President that focus more on underlying economic patterns, rather than on policy advocacy.  For example, some interesting patterns have emerged in what it means to be "out of the labor market."

Economists have an ongoing problem when looking at unemployment. Some people don't have a job and are actively looking for one. They are counted as "unemployed." Some people don't have a job and aren't looking for one. They are not included in the officially "unemployed," but instead are "out of the labor force." In some cases, those who are not looking for a job are really not looking--like someone who has firmly entered retirement. But in other cases, some of those not looking for a job might still take one, if a job was on offer.

This issue came up a lot in the years after the Great Recession. The official unemployment rate topped out in October 2009 at 10%. But as the unemployment rate gradually declined, the "labor force participation" rate also fell--which means that the share of Americans who were out of the labor force and not looking for a job was rising.You can see this pattern in the blue line below.
There were some natural reasons for the labor force participation rate to start declining after about 2010. In particular, the leading edge of the "baby boom" generation, which started in 1945, turned 65 in 2010, so it had long been expected that labor force participation rates would start falling with their retirements.

Notice that the fall in labor force participation rates levelled off late in 2013. Lower unemployment rates since that time cannot be due to declining labor force participation. Or an alternative way to look at the labor market is to focus on employment-to-population--that is, just ignore the issue of whether those who lack jobs are looking for work (and thus "in the labor force") or not looking for work (and thus "out of the labor force"). At about the same time in 2013 when the drop in the labor force participation rate leveled out, the red line shows that the employment-to-population ratio started rising.

What especially interesting is that many of those taking jobs in the last few years were not being counted as among the "unemployed." Instead, they were in that category of "out of the labor force"--that is, without a job but not looking for work. However, as jobs became more available, they have proved willing to take jobs. Here's a graph showing the share of adults starting work who were previously "out of the labor force" rather than officially "unemployed."
A couple of things are striking about this figure.

1) Going back more than 25 years, it's consistently true that more than half of those starting work were not counted as "unemployed," but instead were "out of the labor force." In other words, the number of officially "unemployed" is not a great measure of the number of people actually willing to work, if a suitable job is available.

2) The ratio is at its  highest level since the start of this data in 1990. Presumably this is because when the official unemployment rate is so low (4% or less since March 2018), firms that want to hire are needing to go after those who the official labor market statistics treated as "not in the labor force."  

 -- via my feedly newsfeed

For ACA’s 9th Anniversary, CBPP Examines Options to Further Expand Coverage [feedly]

For ACA's 9th Anniversary, CBPP Examines Options to Further Expand Coverage
https://www.cbpp.org/blog/for-acas-9th-anniversary-cbpp-examines-options-to-further-expand-coverage


Nine years after President Obama signed the Affordable Care Act (ACA) on March 23, 2010, the uninsured rate remains at a historic low and more than 20 million people have gained coverage — but about 30 million non-elderly people are still uninsured. Several new CBPP analyses examine the uninsured and identify policies to continue expanding coverage and making coverage and health care more affordable.


 -- via my feedly newsfeed

Thursday, March 21, 2019

Tim Taylor: Wealth, Consumption, and Income: Patterns Since 1950 [feedly]

I love the way Tim Taylor describes economic wealth and income trends  as it were a mouse under a napkin that turned out to be a scorpion - the wealth tail!

Wealth, Consumption, and Income: Patterns Since 1950
http://conversableeconomist.blogspot.com/2019/03/wealth-consumption-and-income-patterns.html\\ Many of us who watch the economy are slaves to what's changing in the relatively short-term, but it can be useful to anchor oneself in patterns over longer periods. Here's a graph from the 2019 Economic Report of the Presidentwhich relates wealth and consumption to levels of disposable income over time.
The red line shows that total wealth has typically equal to about six years of total personal income in the US economy: a little lower in the 1970s, and  a little higher in recent years at the peak of the dot-com boom in the late 1990s, the housing boom around 2006, and the present.

The blue line shows that total consumption is typically equal to about .9 of total personal income, although it was up to about .95 before the Great Recession, and still looks a shade higher than was typical from the 1950s through the 1980s.

Total stock market wealth and total housing wealth were each typically roughly equal to disposable income from the 1950s up through the mid-1990s, although stock market wealth was higher in the 1960s and housing wealth was higher in the 1980s. Housing wealth is now at about that same long-run average, roughly equal to disposable income. However, stock market wealth has been nudging up toward being twice as high as total disposable income in the late 1990s, round 2007, and at present .

A figure like this one runs some danger of exaggerating the stability of the economy. Even small  movements in these lines over a year or a few years represent big changes for many households.

What jumps out at me is the rise in long-term stock market wealth relative to income since the late 1990s. That's what is driving total wealth above its long-run average. And it's probably part of what what is causing consumption levels relative to income to be higher as well. That relatively higher level of stock market wealth is propping up a lot of retirement accounts for both current and future retirees--including my own.  

 -- via my feedly newsfeed

Dean Baker: Paying for a Green New Deal with Modern Monetary Theory [feedly]

This continuing debate around MMT theory may seem arcane to some.But it contains an important parable about "growth" and "economics". There are many economic variables (wages, profits, currency, classes of labor and industrial  organization, credit,  et al) that have different histories in each society. Change the mission or governance of a corporation in exchange for granting it limited liability, for example, and many of the variables, and their relationships, are altered too. MMT, or the infinite credit if you print your own money theory, however, has a healthy side, even if it unnerves some economists. I do not think we will be harmed by a governing theory that says: " we need to reverse the austerity direction and  corruption, and move forward as far as we possibly can and like JFK said the sky is the limit". The inflation machine will tell us when we have gone too far. Also, maybe we can think about payments in some spheres being  in non-economic forms -- like fishing, where every day so lived adds a day to your life.

Paying for a Green New Deal with Modern Monetary Theory
http://cepr.net/publications/op-eds-columns/paying-for-a-green-new-deal-with-modern-monetary-theory

Dean Baker
The Hankyoreh, March 17, 2019

See article on original site

Much of the Democratic Party, including almost the entire pack of contenders for the Democratic presidential nomination, has embraced the concept of a Green New Deal (GND). This is an ambitious plan for slashing greenhouse gas emissions, while at the same time creating good-paying jobs, improving education, and reducing inequality.

At this point, the specific policies entailed by these ambitious goals are largely up for grabs, as is the question of how to pay for this agenda. One way of paying for it, borrowing from the economic doctrine know as Modern Monetary Theory (MMT), is that we don't have to.

Modern Monetary Theory argues that a government that prints its own currency is not constrained in its spending by its tax revenue. Some on the left have argued that we can just print whatever money we need to finance a GND. This claim does not make sense.

The logic of MMT's claim is that, since the US government prints its own currency, it is not constrained by revenue from taxes, or what it borrows in credit markets. It can always just print the money it needs to cover its spending.

If the government wants to spend another billion dollars paying workers to build roads or paying contractors for steel, who is going to turn down its money? They will just be happy to get the money, end of story.

The limiting factor is that, at some point, this process can lead to inflation. If an economy has a substantial amount of excess capacity, meaning that there are a large number of unemployed workers and idle factories and other facilities, the additional spending due to printing money will just put some workers and factories to use. There should still be plenty of competitive pressure to limit wage and price increases.

This was quite effectively demonstrated in the recovery from the Great Recession, in which the United States, the eurozone, and Japan have all struggled to increase their rates of inflation. In all three cases, the large-scale printing of money had a modest impact, at best, in raising the rate of inflation. The predictions of runaway inflation made by conservative economists were shown to be completely wrong.

While it's true that countries could print money to boost their economies to recover from the Great Recession, that doesn't mean that the United States could now spend a large amount of money on GND projects, without tax increases and/or offsetting spending cuts. The reason is that we have largely recovered from the Great Recession.

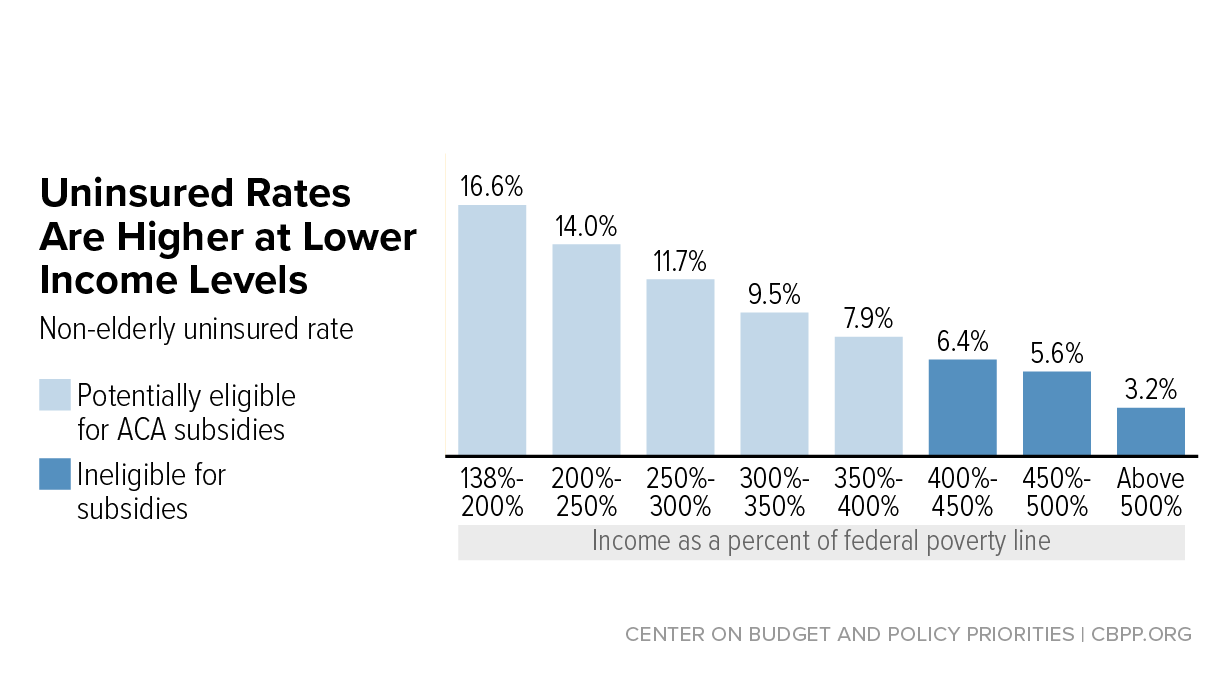
The unemployment rate is now under 4.0 percent, lower than it was before the Great Recession started. While there is some evidence of slack in the labor market by various measures, it has tightened to the point that workers are now seeing pay increases that exceed the rate of inflation.

The average hourly wage increased by 3.2 percent over the last year. That compares to a 2.8 percent rate of increase in the prior year, and a 2.4 percent increase from 2016 to 2017. This tightening of the labor market is great news because it means that millions more workers have jobs and that most workers are now sharing in the gains from growth.

However, it means that we are pretty much at the end of the "just print money" option. If we were to spend an additional $200 billion a year (1.0 percent of GDP) on installing solar panels and windmills, retrofitting buildings, and building electric cars and buses, it would further increase demand in the labor market and almost certainly lead to considerably more rapid wage growth.

While slightly faster wage growth would be fine, this sort of boost to demand is likely to quickly push the rate of wage growth to well over 4.0 percent or even 5.0 percent. Higher wages could come partly out of profits (there was an enormous shift from wages to profits in the Great Recession, which could be reversed), but pretty soon, substantially more rapid wage growth would be passed on in prices.

We would then be getting the story that the conservative economists had always warned about, with printing money leading to inflation. How high inflation goes would depend on how far we go down the just print money route.

All of our models show that inflation is a gradual process, with more rapid price increases leading workers to demand higher wages, which are then passed on in another round of price increases.

It's hard to say with any certainty how fast this inflation would accelerate since we haven't really had much of a problem with inflation since the 1970s, almost 40 years ago. The world is a very different place today, with the US having a much more open economy and unions being far less powerful.

Still, there is little reason to question that the standard economic logic will still apply. If we have a very tight labor market where employers are competing for workers by bidding up wages, this will lead to upward pressure on prices, which will cause workers to demand higher wages to maintain their standard of living.

MMT does not give us a way around this picture. While it was important to point out that we didn't have to worry about deficits in the downturn, telling us that we can just print money as the economy nears full employment does not make sense. If we want to have a big GND, we will have to find some ways to pay for it.

We should perhaps not blame politicians who advocate a GND without telling us how they plan to pay for it. After all, Republican politicians have been getting elected for 40 years by promising big tax cuts without saying how they would pay for them. It is understandable that Democrats might think that they should also be able to promise now and pay later.

But, if they tell us that we don't have to pay for it, they are wrong. The printing press will not do the trick.


 -- via my feedly newsfeed

Tuesday, March 19, 2019

Yanos V: Stagnant Capitalism [feedly]

Stagnant Capitalism
https://www.project-syndicate.org/commentary/capitalism-natural-tendency-toward-stagnation-by-yanis-varoufakis-2019-03

 -- via my feedly newsfeed

ATHENS – When the Great Depression followed the 1929 stock-market crash, almost everyone acknowledged that capitalism was unstable, unreliable, and prone to stagnation. In the decades that followed, however, that perception changed. Capitalism's postwar revival, and especially the post-Cold War rush to financialized globalization, resurrected faith in markets' self-regulating abilities.


Today, a long decade after the 2008 global financial crisis, this touching faith once again lies in tatters as capitalism's natural tendency toward stagnation reasserts itself. The rise of the racist right, the fragmentation of the political center, and mounting geopolitical tensions are mere symptoms of capitalism's miasma.

A balanced capitalist economy requires a magic number, in the form of the prevailing real (inflation-adjusted) interest rate. It is magic because it must kill two very different birds, flying in two very different skies, with a single stone. First, it must balance employers' demand for waged labor with the available labor supply. Second, it must equalize savings and investment. If the prevailing real interest rate fails to balance the labor market, we end up with unemployment, precariousness, wasted human potential, and poverty. If it fails to bring investment up to the level of savings, deflation sets in and feeds back into even lower investment.

It takes a heroic disposition to assume that this magic number exists or that, even if it does, our collective endeavors will result in an actual real interest rate close to it. How do free marketeers convince themselves that there exists a single real interest rate (say, 2%) that would inspire investors to funnel all existing savings into productive investments and spur employers to hire everyone who wishes to work at the prevailing wage?

Faith in capitalism's capacity to generate this magic number stems from a truism. Milton Friedman liked to say that if a commodity is not scarce, then it has no value and its price must be zero. Thus, if its price is not zero, it must be scarce and, therefore, there must be a price at which no units of that commodity will be left unsold. Similarly, if the prevailing wage is not zero, all those who want to work for that wage will find a job.

Applying the same logic to savings, to the extent that money can fund the production of machines that will produce valuable gadgets, there must be a low enough interest rate at which someone will borrow all available savings profitably to build these machines. By definition, concluded Friedman, the real interest rate settles down, quite automatically, to the magic level that eliminates both unemployment and excess savings.

If that were true, capitalism would never stagnate – unless a meddling government or self-seeking trade union damaged its dazzling machinery. Of course, it is not true, for three reasons. First, the magic number does not exist. Second, even if it did, there is no mechanism that would help the real interest rate converge toward it. And, third, capitalism has a natural tendency to usurp markets via the strengthening of what John Kenneth Galbraith called the cartel-like managerial "technostructure."

Europe's current situation demonstrates amply the non-existence of the magical real interest rate. The EU's financial system is holding up to €3 trillion ($3.4 trillion) of savings that refuse to be invested productively, even though the European Central Bank's deposit interest rate is -0.4%. Meanwhile, the European Union's current-account surplus in 2018 amounted to a gargantuan $450 billion. For the euro's exchange rate to weaken enough to eliminate the current-account surplus, while also clearing the savings glut, the ECB's interest rate must fall to at least -5%, a number that would destroy Europe's banks and pension funds in the blink of an eye.

Setting aside the magical interest rate's non-existence, capitalism's natural tendency to stagnation also reflects the failure of money markets to adjust. Free marketeers assume that all prices magically adjust until they reflect commodities' relative scarcity. In reality, they do not. When investors learn that the Federal Reserve or the ECB is thinking of reversing its earlier intention to increase interest rates, they worry that the decision reflects a gloomy outlook regarding overall demand. So, rather than boosting investment, they reduce it.

Instead of investing, they embark on more mergers and acquisitions, which strengthen the technostucture's capacity to fix prices, lower wages, and spend their cash buying up their companies' own shares to boost their bonuses. Consequently, excess savings increase further and prices fail to reflect relative scarcity or, to be more precise, the only scarcity that prices, wages, and interest rates end up reflecting is the scarcity of aggregate demand for goods, labor, and savings.

What is remarkable is how unaffected free marketeers are by the facts. When their dogmas crash on the shoals of reality, they weaponize the epithet "natural." In the 1970s, they predicted that unemployment would disappear if inflation were subdued. When, in the 1980s, unemployment remained stubbornly high despite low inflation, they proclaimed that whatever unemployment rate prevailed must have been "natural."

Similarly, today's free marketeers attribute the failure of inflation to rise, despite wage growth and low unemployment, to a new normal – a new "natural" inflation rate. With their Panglossian blinders, whatever they observe is assumed to be the most natural outcome in the most natural of all possible economic systems.

But capitalism has only one natural tendency: stagnation. Like all tendencies, it is possible to overcome by means of stimuli. One is exuberant financialization, which produces tremendous medium-term growth at the expense of long-term heartache. The other is the more sustainable tonic injected and managed by a surplus-recycling political mechanism, such as during the WWII-era economy or its postwar extension, the Bretton Woods system. But at a time when politics is as broken as financialization, the world has never needed a post-capitalist vision more. Perhaps the greatest contribution of the automation that currently adds to our stagnation woes will be to inspire such a vision.

The Dangerous Absurdity of America’s Trade Wars [feedly]

Sachs has come a long way since co authoring the WashhingtonConsensus.

The Dangerous Absurdity of America's Trade Wars
https://www.project-syndicate.org/commentary/trump-dangerous-absurd-trade-wars-by-jeffrey-d-sachs-2019-03

EW YORK – Don Quixote fought windmills. US President Donald Trump fights trade deficits. Both battles are absurd, but at least Quixote's was tinged with idealism. Trump's is drenched in enraged ignorance.

RENEWING EUROPE

Mar 4, 2019 calls on EU citizens to focus on three goals ahead of the critical European Parliament election in May.

92Add to Bookmarks

Last week, it was announced that the US international deficit on goods and services had widened to $621 billion, despite Trump's promise that tough trade policies vis-à-vis Canada and Mexico, Europe, and China would slash the deficit. Trump believes the US trade deficit reflects unfair practices by America's counterparts. He has vowed to end those unfair practices and negotiate fairer trade agreements with those countries.

Yet America's trade deficit is not an indicator of unfair practices by others, and Trump's negotiations will not reverse its growth. The deficit is, instead, a measure of macroeconomic imbalance, one that Trump's own policies – especially the 2017 tax cut – have exacerbated. Its persistence – indeed, its widening – was wholly predictable by anyone who has gotten to the second week of an undergraduate course on international macroeconomics.

Consider an individual who earns income X and spends Y. If we consider the individual's earnings her "exports" of goods and services, and the spending her "imports" of goods and services, it is immediately clear that she runs a surplus of exports over imports if her income is greater than her spending. A deficit means that she spends more than she earns.

The same is true when one adds incomes and spending across an economy, including both the private and public sectors. An economy runs a surplus on its current account (the broadest measure of its international balance) when gross national income (GNI) exceeds domestic spending, and a deficit when domestic spending exceeds GNI. Economists use the term "domestic absorption" for total spending, summing both domestic consumption and domestic investment spending. The current account may then be defined as the balance of GNI and domestic absorption.

It is important to note that the excess of income over consumption is the same as domestic saving. Therefore, the excess of income over absorption may be stated equivalently as the excess of domestic saving over domestic investment. When an economy saves more than it invests, it runs a current-account surplus; when it saves less than it invests, it runs a current-account deficit.

SUBSCRIBE NOW

For a limited time only, get unlimited access to On Point, The Big Picture, and the PS Archive, plus our annual magazine, for less than $2 a week.

SUBSCRIBE

Notice that trade policy is missing from the entire equation. A deficit on the current account is purely a macroeconomic measure: the shortfall of saving relative to investment. The US external deficit is not in any way, shape, or form an indicator of unfair trade practices by Canada and Mexico, the European Union, or China.

Trump thinks it is because he is ignorant. And his ignorance holds center stage in US public discourse mainly because of the pusillanimity of Trump's advisers (who, admittedly, lose their jobs when they cross him), the Republican Party, and American CEOs (who refuse to reject Trump's nonsense).

The US moved from current-account surpluses to chronic deficits beginning in the 1980s, mainly as the result of a series of tax cuts under Presidents Ronald Reagan, George W. Bush, and Trump. Cuts in taxes not matched by cuts in government consumption reduce government saving. A fall in government saving may be partly offset by a rise in private saving – for example, when businesses and households regard the tax cuts as temporary. Yet such an offset will generally be incomplete. Tax cuts therefore tend to reduce domestic saving, which in turn pushes the current account deeper into deficit.

Data from the Federal Reserve Bank of Saint Louis show that in the 1970s, US government saving averaged -0.1% of GNI, while private saving averaged 22.2% of GNI. Domestic saving was therefore 22.1% of GNI. In the first three quarters of 2018, US government saving was -3.1% of GNI, while private saving was 21.8% of GNI, so that domestic saving was 18.7% of GNI. In turn, the US current-account balance went from a small surplus of 0.2% of GNI in the 1970s to a deficit of 2.4% of GNI in the first three quarters of 2018.

As a result of the 2017 US tax cuts, government saving is likely to fall by around 1% of GNI. Private saving may rise by perhaps half of that, in anticipation of tax increases ahead, with a marginal increase in business investment and declining housing investment producing a modest overall effect. The net result is therefore likely be a rise in the current-account deficit, perhaps of around 0.5% of GNI.

Trump's own signature tax policy is therefore the main explanation of the modest rise in the international imbalance. Again, trade policy is largely irrelevant to the outcome.

Yet trade policy is certainly not irrelevant to the global economy. Far from it. As Trump chases a chimera, the world economy has become more unstable, and relations between the US and most of the rest of the world have palpably worsened. Trump himself is held in disdain in most places, and respect for US leadership has plummeted worldwide

Of course, Trump's trade policies not only seek to improve America's external balance, but also represent a misguided attempt to contain China and even to weaken Europe. This objective reflects a neoconservative worldview in which national security reflects a zero-sum struggle among nation-states. The economic successes of America's competitors are deemed to be threats to American global primacy, and thus to American security.

These views reflect the strands of belligerence and paranoia that have long been a feature of American politics. They are an invitation to unending international conflict, and Trump and his enablers are giving them free rein. Seen in this context, Trump's misconceived trade wars are nearly as predictable as the macroeconomic imbalances they have so spectacularly failed to address.


 -- via my feedly newsfeed