https://www.nakedcapitalism.com/2018/05/real-driver-rising-inequality.html
The Real Driver of Rising Inequality
By Lance Taylor, Arnhold Professor of International Cooperation and Development, New School for Social Research. Originally published at the Institute for New Economic Thinking website
Income distribution and employment are crucial macroeconomic indicators. Profits are key to distribution. Ther share in the value of output has risen steadily since around 1980. Households near the top of the size distribution of income receive business profits through various channels including interest, dividends, capital gains, proprietors' incomes, and even labor compensation—which in US statistics includes profit-related items such as bonuses and stock options. Rising household inequality can be traced directly to higher profits fed by slower growth of real wages than of productivity (Taylor and Ömer, 2018).
The employment rate or the ratio of employment to the working age population, fluctuates around 60%. It hit a post-WWII high of 64% in 1990 at the peak of a business cycle, dropped to 55% in the wake of the Great Recession, and now is nearing 62%.
How do these developments hang together? Rising income inequality and oscillating employment are not the happiest macroeconomic combination. Causes include changing structural relationships including more "duality" between low wage/high employment industries and the rest.
In our paper, my co-author and I first trace these linkages in the data and then examine possible explanations. A key contrast is between business firms' "monopoly" power to push up prices in markets for goods and services against consumers' wages on the one hand, and their ability by various means to drive down wages against prices on the other. The latter strategy may well be more significant.
Output, Employment, and "Productivity"
The ratio of output to employment is a useful accounting tool for sorting out the relationships. "Real" output can be measured as "value-added at factor cost," defined as the total value of a firm or industry's production deflated by an "appropriate" price index minus the value of its intermediate inputs and indirect taxes deflated by another index. This estimation procedure is known as "double deflation." Changes in real output over time are traced with a "chain index." More on the gory details here.
In turn, value-added is the sum of profits and payments to labor (wages, contributions to social insurance, bonuses, etc.). The accounting identity for shares in value-added applies,
(1) Wage share + Profit share = 1.
Dividing real output by employment gives labor "productivity." Mainstream economists fetishize productivity as an indicator of technological advances in production, but that doesn't make a lot of sense. Increases in productivity may in part reflect reorganization of production, more efficient capital goods, or better use of capital. But in practice they may also rise from greater labor exploitation or sharper practices on the part of business.
These factors entangle all the way between macroeconomic and firm level or micro analysis. They can in part be understood at an intermediate or "meso" level of production. To that end, Figure 1 presents levels of productivity observed for 16 sectors since 1990.[1]
Figure 1: Productivity Levels (Sectoral Real VA / Number of Employees)
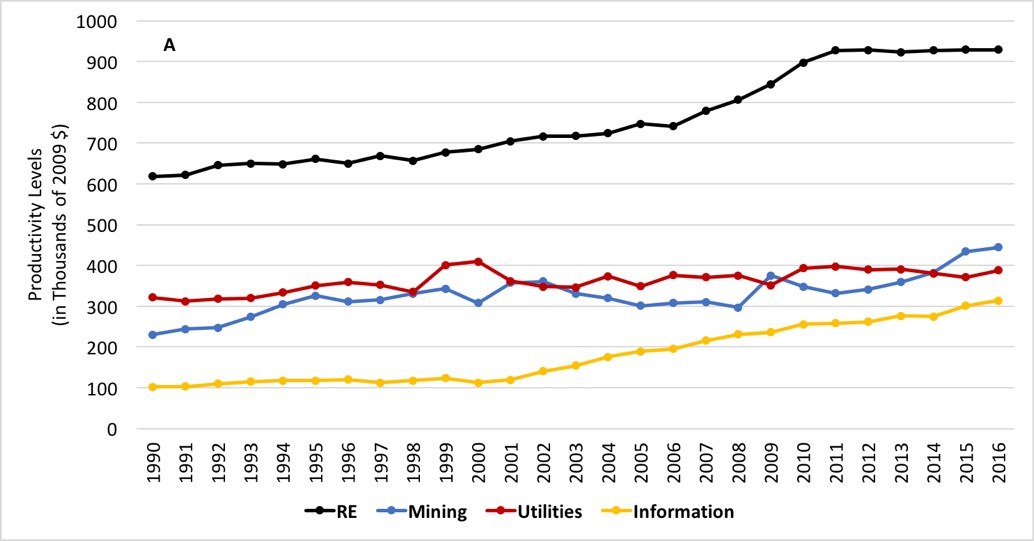
Panel A shows very high productivity industries, with value-added per employee ranging close to a million dollars in real estte rental and leasing. All four sectors have strong monopolistic elements ("natural" as in utilities and mining, or otherwise). Productivity roughly doubled over 26 years in the information sector (a combination of traditional publishing, movies, data processing, etc.) and rose by around 50% in real estate.
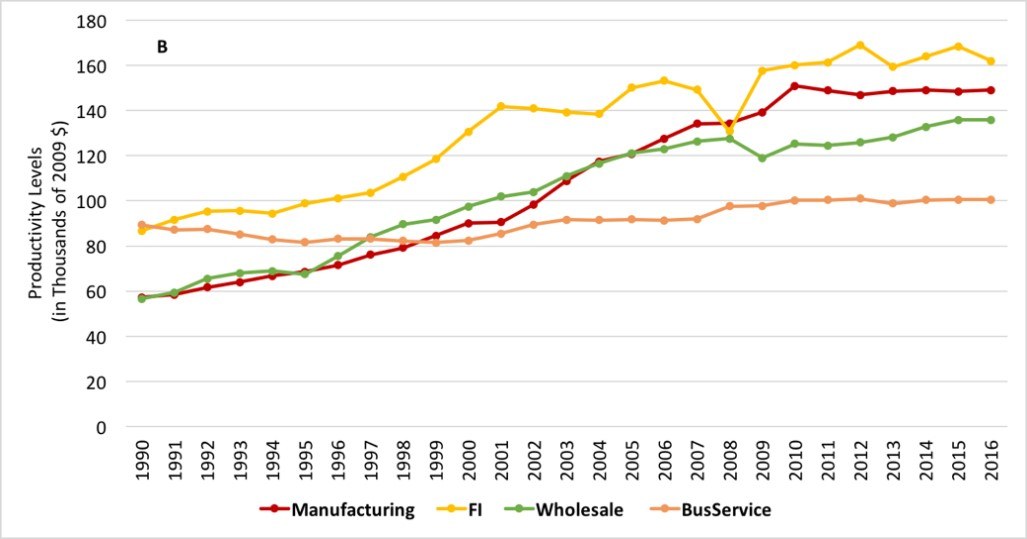
Panel B shows that manufacturing productivity more than doubled, while its real double-deflated output share at 14% is more than twice that of information. Manufacturing's share in real terms fell by about one percentage point over the period while its currentpriceshare dropped from 22% to 14% with other sectoral shares remaining fairly stable. More rapidly rising productivity meant that prices for manufactured products fell in comparison to prices of goods and services provided by other sectors.
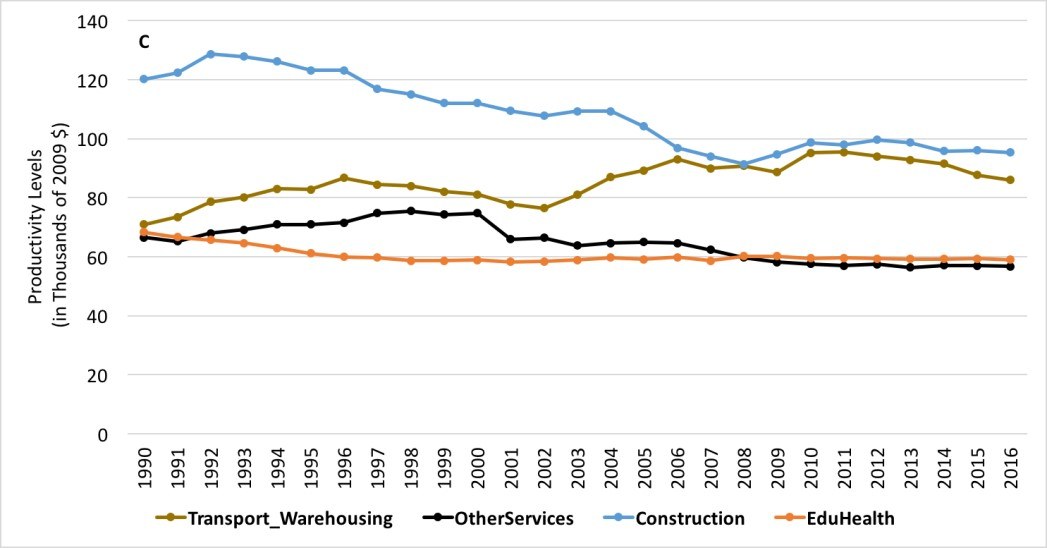
The education and health sector in panel C shows the other side of the coin. In double-deflated terms its output share fell from eleven to ten percent. Yet its market price share rose from seven to ten percent – falling productivity led to rising health care costs to consumers (Lysy, 2015).
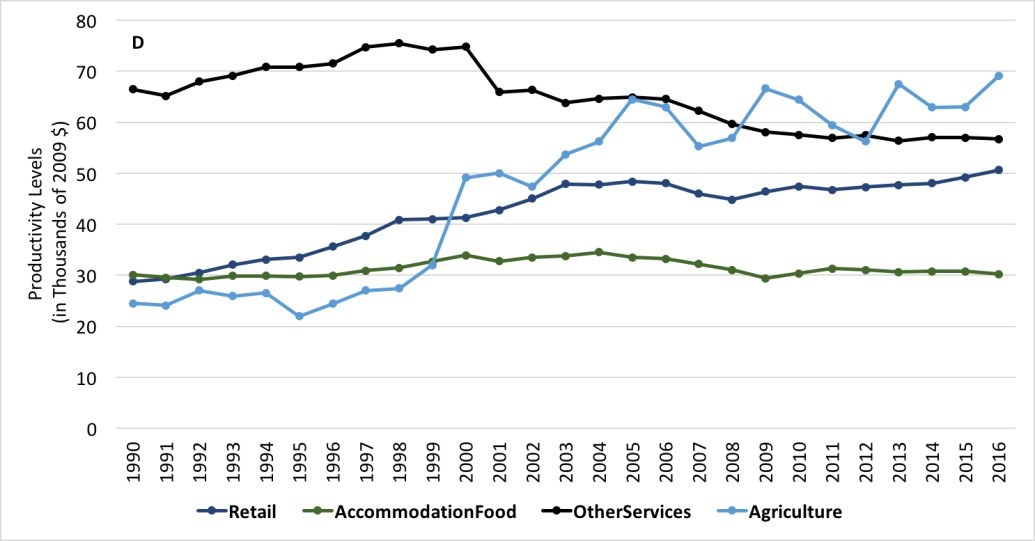
Other sectors in panel B, especially wholesale trade, enjoyed productivity growth. The same is not true for sectors with lower outputs per employee in panels C and D – almost all showed stable or declining productivity. The main exception is agriculture, which accounts for only about one percent of output.
Effects on Employment
Another simple equation states that
(2) Employment = Output ÷ Productivity
This relationship implies that because of rising productivity, manufacturing does notgenerate robust employment increases. Its share in the total fell by almost six points between 1987 and 2016. Employment grew rapidly in education and health, and business services (a mixed bag of enterprises ranging from call centers through collection agencies to credit bureaus, etc. which had sluggish productivity growth).
Now divide both sides of (2) by the (working age) population level, showing that
Employment rate = Output per capita ÷ Productivity.
One can trace the evolution of the components of this equation over time, with the growth of the employment rate as a weighted average of the growth of sectoral outputs per capita minus growth rates of productivity. The weights are sectoral employment shares which sum to one.
Results from this decomposition appear in Figure 2. The green bars show sectors' contributions to employment growth resulting from output increases; the gold bars represent employment losses due to rising productivity. Immediate observations follow.
Figure 2: Employment Decomposition
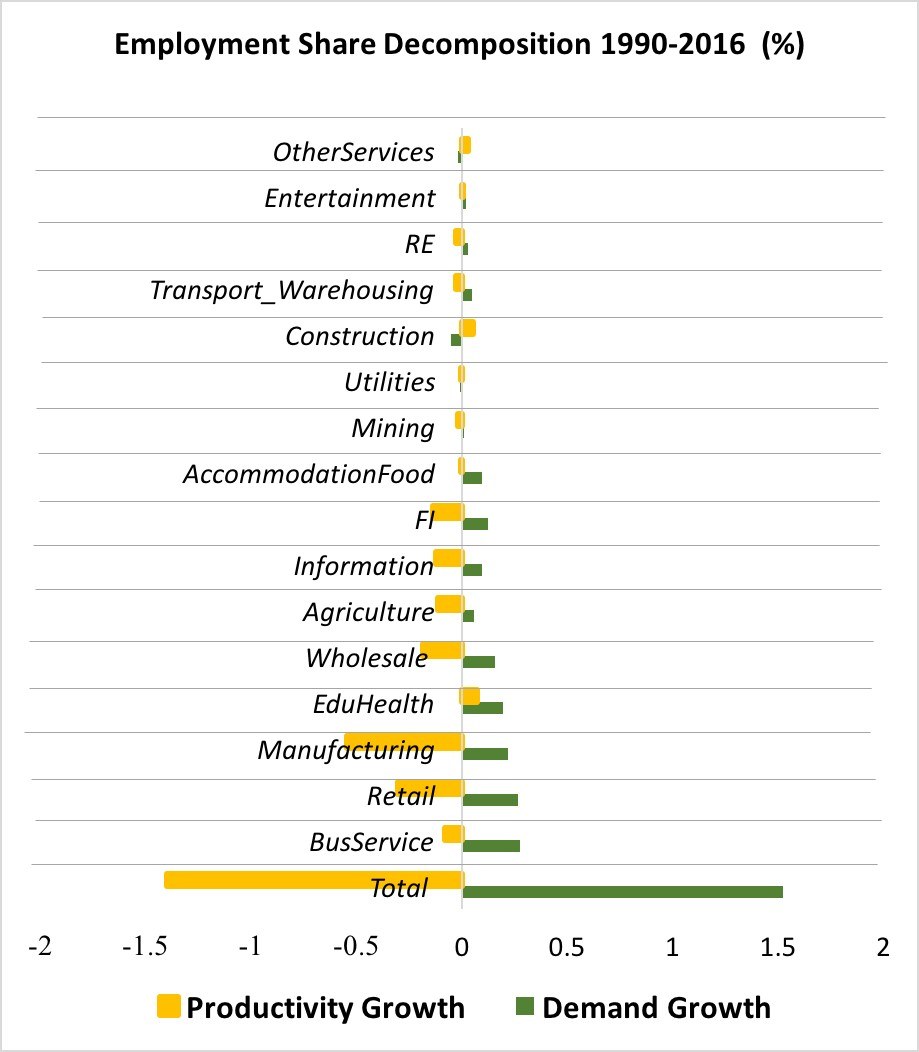
Output growth in manufacturing does create jobs, but the gain is more than offset by productivity increases. Among the sectors with larger employment share movements, similar observations apply to finance and insurance, information, agriculture, and wholesale and retail trade.
Job growth in education and health is supported by demand and (at least according to BEA and BLS data) falling productivity. Slowly rising productivity in business services reduced employment but the impact was more than offset by increasing demand. A similar observation applies to the smaller accommodation and food sector.
Most of the 16 sectors considered here are (to a greater or lesser extent) "non-traded." The main exceptions are manufacturing, finance and insurance, information, mining, and agriculture. As has been widely discussed, import competition and outsourcing have no doubt destroyed jobs in traded goods while contributing to onshore productivity. There is less foreign competition in wholesale and retail trade. Better inventory management and information processing pushed up productivity and generated low wage employment (think McDonald's, Walmart, and Amazon).
Robots (or to use an older label, automation) have no doubt eliminated jobs, in a process that dates back at least to the introduction of power looms in England more than two centuries ago. Immigration had lesser effects. Foreign-born workers make up 17% of total employment, 29% in construction, and 42% in agriculture, all with weak upward trends.
Dual Economy?
An accounting equation for the real "product wage" (or the cost of an employee to a firm) states that
(3) Real wage = Wage share X Productivity .
With some exceptions, sectoral wage shares cluster between 45% and 70%.[2] One implication is that in sectors like business services, education and health, and accommodation and food which had rising demand, negative or slow productivity growth was associated with slow real wage growth. As pointed out by Mendieta-Muñoz et. al. (2018) in analysis similar to the work presented here, for some sectors rising employment combined with lagging wages is characteristic of increasing dualization of the US economy as emphasized by Storm (2017)and Temin (2017).
Finally, as already noted, negative productivity growth in education and health was associated with price increases relative to other sectors. This shift forced a reduction in the real "consumption wage" or the purchasing power of payments to workers. Wages deflated by a consumer price index are not the main focus here, but are surely relevant to overall evaluation of sectoral price and output changes.
Productivity, Wages, and Profits
As we have seen, tension between productivity and demand growth determines employment growth. Similarly, differences in growth rates of productivity and real product wages set profits. Expanding on a decomposition procedure proposed by Syrquin (1986) one can show that the growth rate of the overall profit share can be expressed as a weighted average of each sector's productivity growth minus real wage growth plus a "reallocation" term for the growth rate of the its share of output. The weights in this decomposition are ratios of sectoral wage payments to total profits.[3]
Figure 3 summarizes sectoral contributions to the change in total profits, 1990-2016. The red bars capture the effects of changes in sectors' shares of output, yellow represents effects of wage increases, and green does the same for productivity growth. Share changes net out at the bottom which shows why overall profits expanded – productivity outran real wages.
Figure 3: Profit Share Decomposition
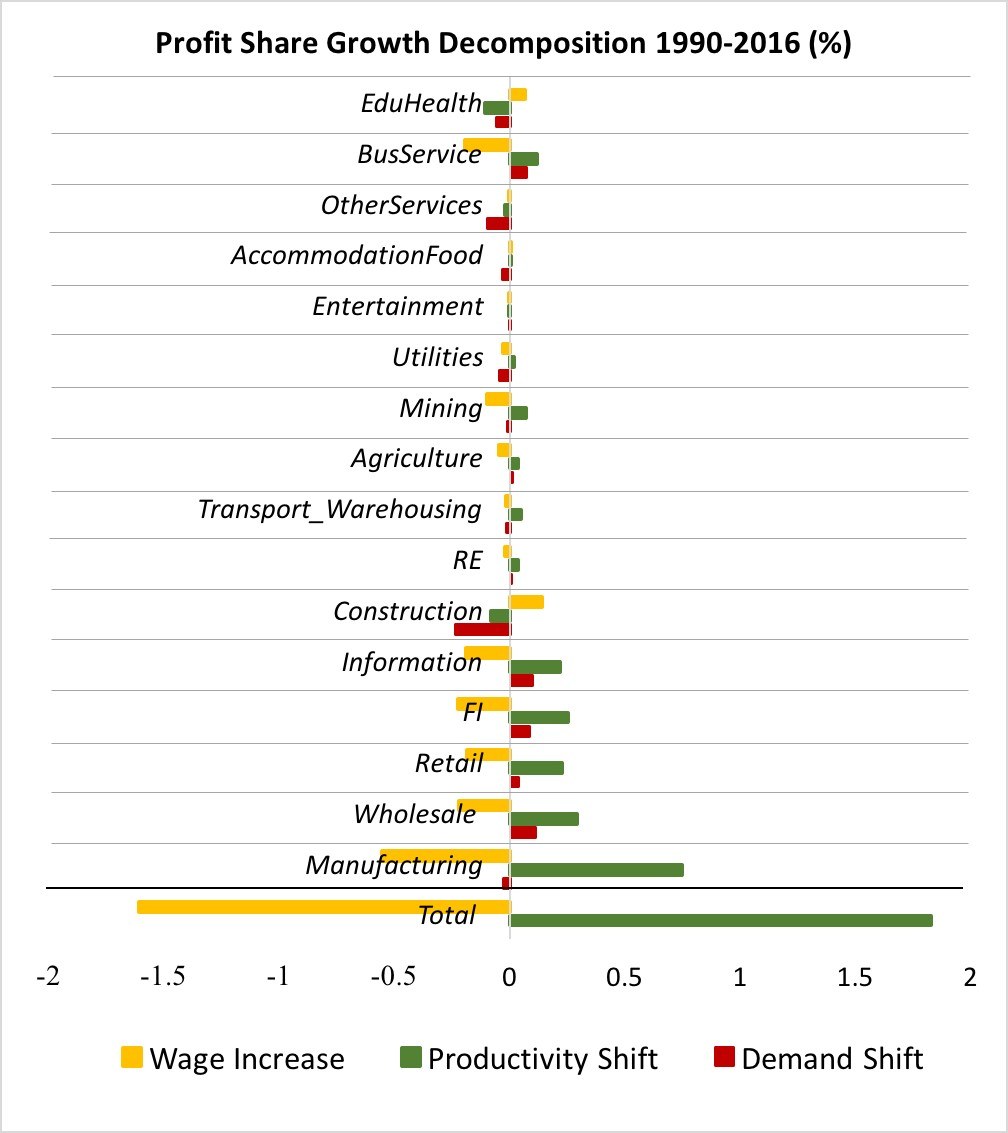
Effects of demand shifts were relatively minor, but they did stimulate profits in information, wholesale and retail trade, and finance and insurance – productivity and demand increases in these sectors more than offset rising wages. In manufacturing as well, this dynamic played the major role in driving up profits economy-wide. Among minor contributions, construction suffered from falling demand and productivity but benefitted from reductions in real wages.
Business services and education and health are large sectors with high wage shares so they have big weights in the decomposition. At the top of the diagram, falling productivity and an adverse demand shift in the latter offset lagging wages to reduce profits. In business services, weak wage increases roughly balanced rising productivity and demand.
Explanations
There are several lines of thought about forces generating slowly growing employment and a rising aggregate profit share over the past four decades. Three are wage repression, greater business market power which increases "rents" accruing to owners of capital, and finally the traditional rental payments received by owners of real estate. We can quickly sketch the reasoning, and compare to Figures 2 and 3. Each explanation has some traction, but they are not equally important.
Structurally driven shifts of employment toward sectors such as education and health, business services, and accommodation and food certainly helped hold down wages, but there are more direct interventions as well. At the macroeconomic level, a key policy is austerity which suppresses employment and so reduces the ability of labor to push for higher pay. Individual firms may exert "monopsony" power (being the only buyer in a market) to constrain wages in markets in which they "buy" labor. The instruments are institutional. Besides the effects of austerity, at the governmental level they include long-term stalemate at the National Labor Relations Board and the spread of state-level right-to-work laws, handicapping both unionization and unions' bargaining power.
Stagnant minimum wages at the bottom of the size distribution of income are only recently beginning to increase but at the same time non-poaching and non-competition clauses in contracts (which restrict job opportunities outside a company for a worker who leaves it) have been spreading rapidly. Divide-and-rule employment tactics in a "fissuring" labor market as described by Weil (2014) are another aspect of this process.
Globalization and outsourcing held down wages as well as employment. In construction and agriculture, immigration may well have repressed wages, but these sectors make a modest contribution to output. The recent increase in the employment ratio may enhance labor's bargaining power, but it is still below the peak in 1990.
Perhaps because they don't want to think about class conflict, mainstream economists mostly opt for explanations based on business "monopoly" power to drive up prices against wages. Recipients of high incomes such as corporate CEOs supposedly benefit from rents generated by monopoly (Stiglitz, 2016).
In one example at the micro level, an expanding presence of "superstar" firms with high productivity may drive down the average sectoral wage share (Autor, et. al., 2017).[4] The question then becomes what are the institutional barriers that prevent workers in these firms from getting higher pay? We get back to wage repression as an explanation.
Assuming that such barriers exist then increasing concentration of firms in a sector should be associated with a higher profit share with stable or falling employment. In Figure 3, of the half-dozen sectors reading up from the bottom of the diagram that have had the biggest impacts on growth of profits, the common perception is that there has been growing enterprise concentration in information and finance and insurance. Their employment generation in Figure 2 has been weak. Power in markets for goods and services may well have been at play.
In macroeconomics, a persisting differential between the corporate profit rate and the (real) interest rate can create a surplus siphoned to shareholders via capital gains (Eggertsson, et. al.,2018). The paper can be viewed as a rationale for Piketty's (2014) emphasis on asset price increases as sources of rising wealth. The problem that it faces is that rate differentials are irrelevant to the gap between wage and productivity growth rates shown in Figure 3. Nor is there good reason to assume that a wedge of profit over interest rates will persist. Just recall the Fed's interest rate hikes around 1980 and 1994, which caused market chaos.
These narratives invoke hard-to-quantify, somewhat metaphysical rents created by market power. We should also consider rents as the visible payments by tenants to owners of real estate. Since the time of David Ricardo two centuries ago, economists have recognized that rents on tangible property are created by demand derived from other income flows.[5] Profits from real estate rental and leasing make up around one-quarter of the total, slowly rising over time. In other words demand for real estate services is high and mildly income-elastic. On the other hand, the sector neither creates new jobs (Figure 2) nor contributes strongly to profit expansion (Figure 3). It is a big source of inequality (think New York or Bay Area real estate!). But at the national level, its significance is not growing strongly over time.
Summary
Meso level analysis cannot provide microeconomic detail, but it can shed light on broad forces shaping the economy. One key trend has been the movement of jobs toward low wage sectors such as business services, education and health, and accommodation and food. The biggest observed employment losses have been in manufacturing and wholesale trade. The analysis further suggests that wage repression pushed up profits in business services, education and health, wholesale and retail trade, and parts of manufacturing.
Power matters in all sectors. Its strongest effects act against employment and real wages in labor markets.
Footnotes
[1] Data on employment, the denominator used in computing productivity, come from the Bureau of Labor Statistics (BLS) in series beginning in 1990. Data on double-deflated chain-indexed value-added come from the Bureau of Economic Analysis.
[2] They are lower in real estate (less than 10%!), mining, utilities, and agriculture, and higher in education and health (more than 85%).
[3] Business services, for example, has a big share of total output (15%) and its own wage share is high (75%) so it makes a substantial contribution to changes in total profits. Even though its output share is also 15%, real estate makes a minor contribution because its own-profit share exceeds 90%.
[4] The idea is reminiscent of the "Horndal effect" of rising productivity in a Swedish steel mill over decades during which time there was no significant investment in new capital. Learning by doing is the standard rationalization (or label).
[5] Perhaps, one might add, with positive feedback from higher rental income to rising demand for real estate. Such an effect is likely to be weak.
See original post for references

-- via my feedly newsfeed


