Monday, March 8, 2021

The ‘$15 minimum wage is too expensive for Peoria’ argument doesn’t hold water: Five reasons why [feedly]

The '$15 minimum wage is too expensive for Peoria' argument doesn't hold water: Five reasons why
https://www.epi.org/blog/the-15-minimum-wage-is-too-expensive-for-peoria-argument-doesnt-hold-water-five-reasons-why/

The one argument made often in the debate over raising the minimum wage to $15 an hour nationwide by 2024, is that you can't expect to pay the same wages in Chicago as you do in Peoria.

Such an increase, critics contend, will bankrupt small businesses, will impact payroll decisions for corporations with operations nationally, will raise wages beyond what folks outside of big cities need to make ends meet—and will ultimately hurt local economies.

Turns out, these arguments are bogus.

Here are five reasons why:

1. $15 anywhere in this country makes cost-of-living sense.

Today, in all areas across the United States, a single adult without children needs at least $31,200—what a full-time worker making $15 an hour earns annually—to achieve a modest but adequate standard of living. By 2025, workers in these areas and those with children will need even more, according to projections based on the Economic Policy Institute's Family Budget Calculator.

For example, in rural Missouri, a single adult without children will need $39,800 (more than $19 per hour for a full-time worker) by 2025 to cover typical rent, food, transportation, and other basic living costs.

In larger metro areas of the South and Southwest—where the majority of the Southern population live—a single adult without children will also need more than $15 an hour by 2025 to get by: $20.03 in Fort Worth, $21.12 in Phoenix, and $20.95 in Miami.

In more expensive regions of the country, a single adult without children will need far more than $15 an hour by 2025 to cover the basics: $28.70 in New York City, $24.06 in Los Angeles, and $23.94 in Washington, D.C.

2. Expensive cities are already at $15 an hour or higher.

Since the Fight for $15 was launched by striking fast-food workers in 2012, nine states (California, Connecticut, Florida, Illinois, Maryland, Massachusetts, New Jersey, New York, Virginia) and the District of Columbia—together representing approximately 40% of the U.S. workforce—have approved raising their minimum wages to $15 an hour.

Additional states—including Washington, Oregon, Colorado, Arizona, New Mexico, Vermont, Missouri, Michigan, and Maine—have approved minimum wages ranging from $12 to $14.75 an hour.

3. Many business owners and corporate executives are realizing the value of a $15 minimum wage.

In states that have already approved $15 minimum wages, business organizations representing thousands of small businesses have endorsed a $15 minimum wage.

Business groups that have endorsed a $15 minimum wage include Business for a Fair Minimum Wage, the American Sustainable Business Council, the Patriotic Millionaires, the Greater New York Chamber of Commerce, the Long Island African American Chamber of Commerce, and others.

Growing numbers of employers have responded to pressure from workers and raised their starting pay scales to $15 or higher. These include retail giants Amazon, Whole Foods (owned by Amazon), Target, Walmart, Wayfair, Costco, Hobby Lobby, and Best Buy; employers in the food service and producing industries, such as Chobani, Starbucks, Sanderson Farms (Mississippi), and the Atlanta-area locations of Lidl grocery stores; health care employers, including Michigan's Henry Ford Health System and Trinity Health System, Ohio's Akron Children's Hospital and Cincinnati Children's Hospital Medical Center, Iowa's Mercy Medical Center and MercyCare Community Physicians, Missouri's North Kansas City Hospital and Meritas Health, and Maryland's LifeBridge Health; insurers and banks such as Amalgamated Bank, Allstate, Wells Fargo, and Franklin Savings Bank in New Hampshire; and tech and communications leaders such as Facebook and Charter Communications.

4. Workers making a higher minimum wage are less likely to be dependent on public assistance, reducing the burden on cash-strapped state and local governments.

In states without laws to raise the minimum wage to $15, nearly half (47%, or 10.5 million) of families of workers who would benefit from the Act rely on public supports programs in part because they do not earn enough at work.

These workers and their families account for nearly one-third of total enrollment in one or more public supports programs.

In states without a $15 minimum wage law, public supports programs for underpaid workers and their families make up 42% of total spending on Medicaid and CHIP (the Children's Health Insurance Program), cash assistance (Temporary Assistance for Needy Families, or TANF), food stamps (Supplemental Nutrition Assistance Program, or SNAP), and the earned income tax credit (EITC), and cost federal and state taxpayers more than $107 billion a year.

5. When low-wage workers get a raise, they're more likely than higher-wage workers to spend every extra dollar they earn on basic necessities—putting that money right back into the economy.

From a general macroeconomic perspective, raising the minimum wage in a period of depressed consumer demand is smart policy (though it is worth keeping in mind that the minimum wage wouldn't go to $15 immediately under the Raise the Wage Act, it would be phase in in five gradual steps, reaching $15 in 2025).

Minimum wage hikes put extra dollars in the pockets of people who are highly likely to spend every additional cent they receive, often just to make ends meet. Workers who benefit from an increased minimum wage disproportionately come from low-income households that spend a larger share of their income than business owners, corporate shareholders, and higher-income households, who are likely to save at least some portion of the dollars that finance a minimum wage hike. As a result, raising the minimum wage boosts overall consumer demand, with research showing that past raises have spurred greater household buying, notably on dining out and automobiles.

(Related post: Why the U.S. needs a $15 minimum wage: How the Raise the Wage Act would benefit U.S. workers and their families.)

Enjoyed this post?

Sign up for EPI's newsletter so you never miss our research and insights on ways to make the economy work better for everyone.


 -- via my feedly newsfeed
Dean Baker: Environment Versus How Many Jobs? [feedly]

Much as I love Dean, saying energy -- or for that matter, industrial -- workers are a more negligible component of the workforce than in earlier decades wrongly understates their power in the real economy, and in the labor movement. When you imply you can leave energy, manufacturing, construction workers "behind" -- and that iS the implication -- is like inviting the labor movement to a race with one of its legs gone. If labor is not capable of becoming fully engaged, I predict not much progress will be made against reaction. Leaving out -- or leaving in second place --  compensation and transition to these workers in Green New Deal programs is an invitation to defeat.

Environment Versus How Many Jobs?

Dean Baker
http://feedproxy.google.com/~r/beat_the_press/~3/h-8RcGE1bXU/

The Washington Post had an article on concerns among unions about job loss due to various measures from the Biden administration to promote clean energy. The article noted concerns that Biden's agenda may lead to the loss of good-paying jobs in the fossil fuel sector.

It would have been helpful to point out how many jobs are potentially at stake. According to the Bureau of Labor Statistics, fossil fuel powered electric plants and the pipeline industry, the two sectors discussed in the piece employ 78,700 and 48,200 workers, respectively.

The workers employed in fossil fuel power generation are a bit more than 0.05 percent of total employment, while employment in the pipeline industry is just over 0.03 percent. Employment in fossil fuel power generation was already falling rapidly under the Trump administration, declining by 16,800, or 18.0 percent, over the last four years.

It is also worth noting that in a typical (pre—pandemic) month, roughly 1.8 million workers lose their jobs. Over the course of a year, this would come to 27 million. (Some workers lose a job more than once in a year, so this does not mean 27 million workers lose their job.) The job loss in these industries due to the promotion of clean energy would presumably take place over many years, not all at once.

The fact that other workers frequently lose their jobs does not reduce the hardship for workers losing relatively good paying jobs in the fossil fuel industry. But it is important to place the potential size of the job loss in some context. And, in the case of the fossil fuel power generation sector, it is important to note that there was already substantial job loss under Trump, so job loss is not a new problem that will be created by Biden's policies, even if it may be accelerated.

The post Environment Versus How Many Jobs? appeared first on Center for Economic and Policy Research.


 -- via my feedly newsfeed

Sunday, March 7, 2021

https://equitablegrowth.org/jobs-report-a-year-into-the-coronavirus-recession-employment-losses-have-been-greatest-for-black-women-workers-and-latinx-workers/

https://equitablegrowth.org/jobs-report-a-year-into-the-coronavirus-recession-employment-losses-have-been-greatest-for-black-women-workers-and-latinx-workers/

One year after the onset of the coronavirus recession, the U.S. labor market is still a long way from its February 2020 employment levels, but saw important job gains last month. According to the latest Employment Situation Summary by the U.S. Bureau of Labor Statistics, the U.S. economy in February added 379,000 nonfarm payroll jobs—the greatest month-over-month gain since October of last year.  

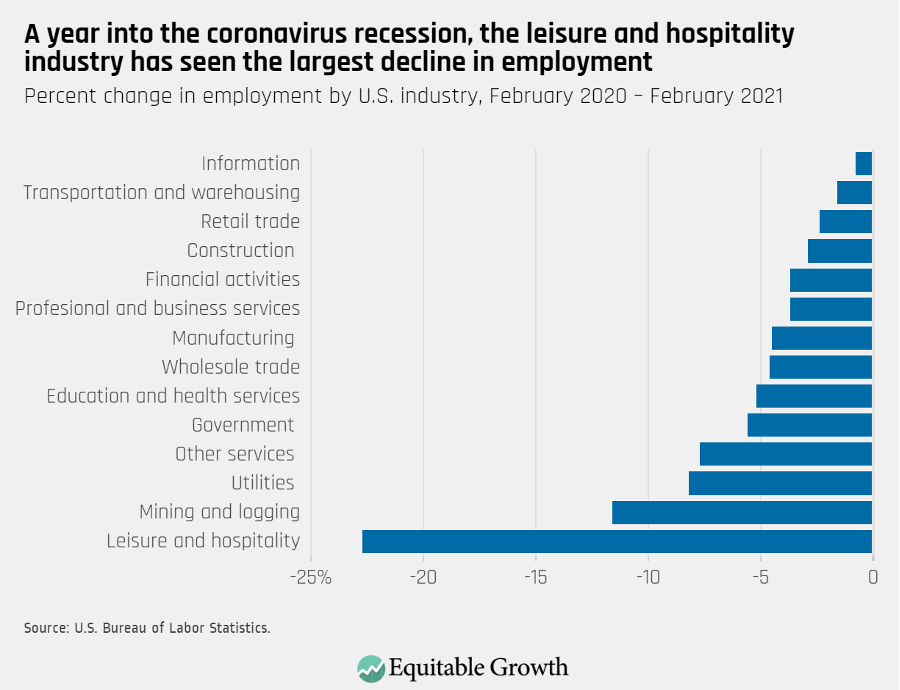
Today's release also shows that between mid-January and mid-February the overall unemployment rate fell from 6.3 to 6.2  percent, with 50,000 workers re-entering the U.S. labor force. Across sectors, last month's job gains were concentrated in leisure and hospitality, which added 355,000 jobs. Yet data on employment changes over the entire year show that the downturn remains especially hard for this sector and for service-providing industries in general. (See Figure 1.)

Figure 1

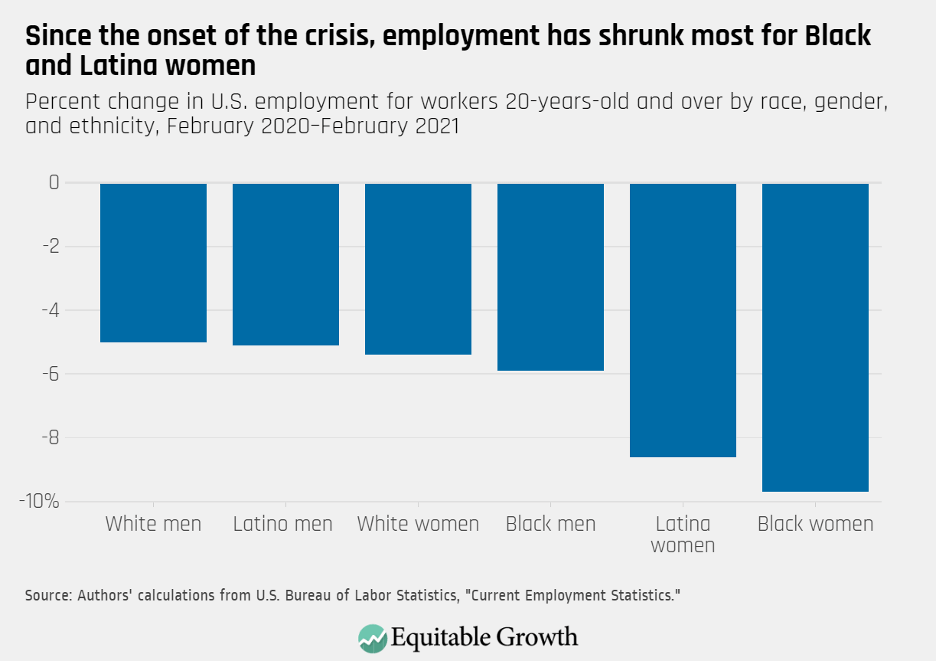
The economic pain brought on by the downturn continues to fall heaviest on some groups. The jobless rate stands at 9.9 percent for Black workers, at  8.5percent for Latinx workers, at 5.1 percent for Asian American workers, and at 5.6 percent for White workers. Disaggregating the data further shows that over the past 12 months, net job losses have been greatest for Black and Hispanic women and men—groups for whom employment declined by  9.7 percent and 8.6 percent, respectively. (See Figure 2.)

Figure 2

Hispanic men's experience during the coronavirus recession

For Hispanic men, overall job losses are less severe than for women workers or Black men. Yet their experience during this recession also highlights important challenges they face in the labor market. For instance, Hispanic men are overrepresented in jobs that cannot be done from home. Despite accounting for about 8 percent of the U.S. workforce, these workers represent about a quarter of the construction workers and about 1 in 5 workers in the mining sector. In part as a result of their industry and occupational distribution, Hispanic men are facing risks associated with in-person work and have been more likely to experience joblessness than their White, non-Hispanic peers—a trend that risks entrenching longstanding inequities between the two groups of workers.

Consequently, as of the last quarter of 2020, Hispanic men were earning the lowest median weekly earnings of any other group of men, and just a bit higher than the weekly earnings than for Hispanic women.

Even though earnings disparities between Hispanic men and their White non-Hispanic peers are often attributed to differences in education, these pay disadvantages persist even among workers with the same level of education. A recent study shows that whereas 6 percent of White men with an advanced degree hold low-wage jobs, 13 percent of Hispanic men do. An analysis by the Economic Policy Institute shows that Hispanic men make about 15 percent less than White men who live in the same geographic region and have the same level of education and work experience. That gap, moreover, remains relatively unchanged since the early 1970s.

Researchers also find evidence that Hispanic men—and especially those who also are immigrants—are more likely to take low-wage and low-quality jobs, since they often lack the private networks and access to social insurance programs that would allow them to engage in longer job-search periods. Consistent with this evidence is that Latinx workers who are part of a labor union experience a particularly large pay boost. On average, workers covered by a union contract are paid 11 percent more than their nonunionized peers. Among Latinx workers, however, the wage premium associated with being represented by a union contract is more than 20 percent.

Yet research by Jake Rosenfeld of the University of Washington-St. Louis and Meredith Kleykamp at the University of Maryland, College Park also finds that Latinx immigrants are less likely to be part of a union than U.S.-born Latinx workers, suggesting that stronger networks and U.S. citizenship might protect workers against hostile responses to unionization efforts.

Conclusion

As the U.S. economy went into a pandemic-driven tailspin one year ago, almost 21 million workers lost their jobs between mid-March and mid-April alone. In February 2021, the U.S. labor market is short 9.5 million jobs relative to February 2020. These losses remain starkest for Black and Latina women, and other vulnerable groups of marginalized workers, highlighting the importance of policy in setting the groundwork for an equitable economic recovery.

Above all, policymakers should prioritize the enforcement of existing labor law. Even though this should be a priority for policymakers during booms as well as contractions, research shows that wage theft rises and falls with the business cycle—as recessions hit and the jobless rate rises, so does the share of workers who suffer a minimum wage violation.

Another way to tackle these U.S. labor market inequities is to lift the federal minimum wage, now frozen at $7.25 an hour for more than a decade. More than 40 percent of U.S. workers make less than $15 dollars per hour. In the food services industry, where Latinx workers make up more than a quarter of all workers, a whopping 78 percent of workers earn less than $15 dollars an hour. A large share of U.S. workers and an even larger share of women workers and workers of color would receive a much-needed pay boost should the federal minimum wage increase, helping drive a faster and more equitable economic recovery.

Tim Taylor: Debt and Deficits: Nostalgia for the 1980s [feedly]


A review of "debt" history in both politics, and ideology, and economics

Debt and Deficits: Nostalgia for the 1980s

https://conversableeconomist.blogspot.com/2021/03/debt-and-deficits-nostalgia-for-1980s.html

Back in the mid-1980s, the federal government under the Reagan administration ran what were widely considered to be excessive and risky budget deficits: from 1983 to 1986, the annual deficit was between 4.7% of GDP and 5.9% of GDP per year. The accumulated federal debt held by the public as a share of GDP rose from 21.2% of GDP in 1981 to 35.2% of GDP by 1987. I cannot exaggerate how much ink was spilled over this problem, some of it by me, back in those innocent and carefree time, before we learned to stop worrying and love the deficit.

The Congressional Budget Office has just released "The 2021 Long-Term Budget Outlook" (March 2021). There's nothing deeply new in it, but it made me think about how attitudes about budget deficits and government debt have evolved. The report notes: 
At an estimated 10.3 percent of gross domestic product (GDP), the deficit in 2021would be the second largest since 1945, exceeded only by the 14.9 percent shortfall recorded last year. ... By the end of 2021, federal debt held by the public is projected to equal 102 percent of GDP. Debt would reach 107 percent of GDP (surpassing its historical high) in 2031 and would almost double to 202 percent of GDP by 2051. Debt that is high and rising as a percentage of GDP boosts federal and private borrowing costs, slows the growth of economic output, and increases interest payments abroad. A growing debt burden could increase the risk of a fiscal crisis and higher inflation as well as undermine confidence in the U.S. dollar, making it more costly to finance public and private activity in international markets.
Here are a few illustrative figures. The first one shows accumulated federal debt over time since 1900. You see the bumps for debt accumulated during World Wars I and II, and during the Great Depression of the 1930s. If you look at the 1980s, you can see the Reagan-era rise in debt/GDP.  But after the debt/GDP ratio had sagged back to 26.5% by 2001, you can see the the big jump for debt incurred during the Great Recession, and then debt incurred during the pandemic recession, and then where the projections under current law would take us.
From an historical point of view, you can think of fiscal policy during the Great Recession and the pandemic recession as similar to what happened during the Great Recession and World War II. In both cases, there were two huge stresses within a period of about 15 years, and the federal government addressed both of them with borrowed money. In historical perspective, those Reagan-era deficits that caused such a fuss were just a minor speed bump. However, what's projected for the future has no US historical equivalent. 

This figure shows projections for annual budget deficits, rather than for accumulated debt. The figure separates out the amount of deficits that are attributable to interest payments in past borrowing (blue area). The "primary deficit" (purple area) is the deficit due to all non-interest spending. You'll notice that the primary deficit doesn't get crazy-high: it steadily grows from about 2.5% of GDP in the mid-2000s to 4.6% of GDP by the late 2040s. The problem is that the federal government gets on what I've called the "interest payments treadmill," where high interest payments are helping to create large annual deficits, and then large annual deficits keep leading to higher future interest payments. 
If the government could take actions to hold down the rise in the primary deficit over time, with some mixture of spending cuts and tax increases (or does it sound better to say spending "restraint" and tax "enhancements"?), then this could also keep the US government from stepping on the interest payments treadmill.  

This figure shows projected trends for spending and taxes, under current law. You can see the sepnding jump during the Great Recession, and then the jump during the pandemic recession. Assuming current law, projected tax revenues as a share of GDP don't change much going forward. However projected outlays do rise.

CBO explains the rise in outlays: 
Larger deficits in the last few years of the decade result from increases in spending that outpace increases in revenues. In particular:
  • Mandatory spending increases as a percentage of GDP. Those increases stem both from the aging of the population, which causes the number of participants in Social Security and Medicare to grow faster than the overall population, and from growth in federal health care costs per beneficiary that exceeds the growth in GDP per capita.
  • Net spending for interest as a percentage of GDP is projected to increase over the remainder of the decade as interest rates rise and federal debt remains high. 
There's been some talk in recent years about how, in a time of low interest rates, it could be an excellent time for the US government to make long-run investments that would pay off in future productivity. This case has some merit to me, but it's not what is actually happening. Instead, the fundamental purpose of the US government has been shifting. Back in 1970, about one-third of all federal spending was direct payments to individuals: now, direct payments to individuals are 70% of all federal spending. The federal government use to have missions like fighting wars and putting a person on the moon: now, it cuts checks. The CBO has this to say about the agenda of using federal debt to finance investments: 
Moreover, the effects on economic outcomes would depend on the types of policies that generate the higher deficits and debt. For example, increased high-quality and effective federal investment would boost private-sector productivity and output (though it would only partially mitigate the adverse consequences of greater borrowing). However, in CBO's projections, the increasing deficits and debt result primarily from increases in noninvestment spending. Notably, net outlays for interest are a significant component of the increase in spending over the next 30 years. In addition, federal spending for Social Security, Medicare, and Medicaid for people age 65 or older would account for about half
of all federal noninterest spending by 2051, rising from about one-third in 2021.
For decades now, we have known that a combination of the aging of the post-World War II "baby boom" generation combined with rising life expectancies was going to raise the share of elderly Americans. We have also known for decades that primary programs for meeting the needs of this group--like Social Security and Medicare--have made promises that their current funding sources can't support. We have been watching US health care costs rise as a share of GDP For decades.  Meanwhile, the US economy has been experiencing slow productivity growth, which makes addressing all problems closer to a zero-sum game.  

Neither during the Great Recession of 2007-2009 nor during the heart of the pandemic recession in 2020 and early 2021 was an appropriate time to focus on the long-term future of government debt. But averting our eyes from the trajectory of the national debt is not a long-term strategy. 


 -- via my feedly newsfeed

[The Washington Post] Biden stimulus showers money on Americans, sharply cutting poverty and favoring individuals over businesses

Good breakdown of benefits from WAPO.

https://www.washingtonpost.com/business/2021/03/06/biden-stimulus-poverty-checks/

March 6, 2021 at 4:02 p.m. EST

President Biden's stimulus package, which passed the Senate on Saturday, represents one of the most generous expansions of aid to the poor in recent history, while also showering thousands or, in some cases, tens of thousands of dollars on Americans families navigating the coronavirus pandemic.

The roughly $1.9 trillion American Rescue Plan, which only Democrats supported, spends most of the money on low-income and middle-class Americans and state and local governments, with very little funding going toward companies. The plan is one of the largest federal responses to a downturn Congress has enacted and economists estimate it will boost growth this year to the highest level in decades and reduce the number of Americans living in poverty by a third.

This round of aid enjoys wide support across the country, polls show, and it is likely to be felt quickly by low- and moderate-income Americans who stand to receive not just larger checks than before, but money from expanded tax credits, particularly geared toward parents; enhanced unemployment; rental assistance; food aid and health insurance subsidies.

But the ambitious legislation entails risks — both economic and political. The bill, which the House is expected to pass and send to Biden within daysinjects the economy with so much money that some economists from both parties are warning that growth could overheat, leading to a bout of hard-to-contain inflation. Meanwhile, some businesses are saying that government aid has been so generous that they're already having trouble getting unemployed workers to return to work — a problem that could be exacerbated by the legislation.

AD
ADVERTISING

Unlike many other significant anti-poverty measures passed by Congress in history, this one has a short time horizon, with almost all the relief for families going away over the coming year. That could be an abrupt awakening for Americans who have grown accustomed to financial support since Congress moved swiftly to create a stronger safety net at the start of the pandemic a year ago. It also lacks the bipartisan imprint of former President Trump's bills, which directed money in larger measure to companies as well as individuals.

"This legislative package likely represents the most effective set of policies for reducing child poverty ever in one bill, especially among Black and Latinx children," said Indivar Dutta-Gupta, co-executive director of the Georgetown Center on Poverty and Inequality. "The Biden administration is seeing this more like a wartime mobilization. They'll deal with any downside risks later on."

The total numbers are staggering. Cumulatively, the government will hand out $2.2 trillion to workers and families between the relief passed last year and this latest bill, according to the Committee for a Responsible Federal Budget, a nonpartisan group. That's equivalent to what the government spends annually on Social Security, Medicare and Medicaid combined.

Image without a caption

Exactly how much money Americans are set to receive depends on a number of factors including whether they are unemployed, their household income, whether they have children or other dependents, and the state they live in.

AD

According to calculations by Marc Goldwein, senior policy director for the Committee for a Responsible Federal Budget, a Massachusetts family of four that had an income of about $53,000 before the pandemic and has one parent unemployed stands to receive more than $22,000 from this package. That's in addition to the unemployment assistance and child tax credit the family would be eligible for without the pandemic.

In total, this family of four is set to have received more than $50,000 from the relief bills Congress has passed since the crisis began, a large amount that more than replaces the family's lost income during the crisis.

Image without a caption

The Democratic stimulus package also provides significant funding for vaccine distribution and state and local governments. Business and health leaders say getting most Americans vaccinated is key to the economic recovery. But most of the attention on the bill has focused on its overall price tag and the payments that are set to go to about 150 million American households.

AD

The latest stimulus will reduce poverty by a third, lifting nearly 13 million Americans out of it, according to an analysis by Columbia University's Center on Poverty and Social Policy. Black Americans, Hispanic Americans and poor families with children are set to benefit the most. Child poverty would be reduced by more than half, the researchers predict.

Who will get a third stimulus check and why?
Economic stimulus or economic relief: Here's what we know about who might qualify for the next round of coronavirus checks and how much they'll get. (Monica Rodman, Sarah Hashemi, Monica Akhtar/The Washington Post)

The magnitude of aid, especially combined with last year's relief, is much greater than the U.S. government has responded to other economic crises. The response to the Great Recession was about $1.8 trillion over several years and the most optimistic estimates are that about 6 million Americans were kept out of poverty in 2009 because of efforts by Congress at the time.

Biden and his top officials have repeatedly said they have learned lessons from the mistakes made during the Great Recession response. This time around they want to go big enough to ensure jobs return swiftly. They want a package that, in the words of White House press secretary Jen Psaki, will get families "talking about it at their dinner tables."

AD

Many economists say the package is far from perfect, but they broadly agree that this crisis has been an unprecedented hit on low-income workers and their children and the aid should be targeted most toward them.

Recent history has shown that giving money to poorer families delivers the greatest boost to the economy, because those Americans are the most likely to spend the money right away.

"History and a strong body of research would tell us the only way to avoid more lasting scars on households and the economy is by not doing too little," said Ellen Zentner, chief economist at Morgan Stanley. She pointed out that giving money to low-income households "is much more stimulative than past policies in a downturn."

Still, one of the biggest criticisms of the bill is that it is too large overall at a time when the Congressional Budget Office projects the economy is running roughly $700 billion below potential — a concept that tries to measure what a completely healthy economy would like.

AD

"I don't think there's any justification from an economic standpoint or a bottom-up standpoint for $1.9 trillion in further covid relief," Goldwein said. "A package half that size would still be a safe boost to the economy."

Goldwein and others are especially critical of Democrats' decision to allot $350 billion to state and local aid, even though many states are no longer running deficits and independent estimates suggest the need is far less than that amount. Many economists also question the need to send $1,400 to people who have not lost their jobs.

"To me the part that's the hardest to justify is the $1,400 checks to everyone," said Greg Mankiw, a Harvard University professor who served as President George W. Bush's chief economist from 2003 to 2005. "They are making large payments to people who don't need them."

AD

Mankiw points out that two of his adult children who have not lost jobs have been receiving the payments. And a family of four who didn't lose any income in this crisis would still receive an additional $5,600. Some economists are also concerned that the money, along with enhanced unemployment benefits until early September, are discouraging some people from returning to work.

"Many small businesses complain they are not able to reconnect with employees because of these benefits," said Lindsey Piegza, chief economist at the investment firm Stifel. "We want to be leery of getting a short-term boost that ends up creating longer-term roadblocks."

But the mantra of the White House and the Federal Reserve has been that it's better to err on the side of doing too much than too little. Treasury Secretary Janet Yellen has made the case that it's not just the jobless who are struggling. Many people have taken a pay cut or are working fewer hours and many families have had to juggle jobs with child-care and elder-care responsibilities, which brings more costs.

AD

"Any time you try to design a targeted system in the scale of the U.S. economy, you end up missing people," Neel Kashkari, president and chief executive of the Federal Reserve Bank of Minneapolis, said in a Friday interview. This bill "really, in my mind, is not meant to be stimulus, it's meant to be relief for those families who've lost jobs."

Kashkari led the bank bailout, known as the Troubled Asset Relief Program (TARP), in the wake of the 2008-09 financial crisis. Back then, he said, the government was so concerned about targeting aid to deserving families that a lot of struggling homeowners didn't get money fast enough and the nation ended up with a massive foreclosure problem. He doesn't want to see that repeated.

Democrats say the American Rescue Plan corrects the flaws, not just of the Great Recession response but also the Cares Act and the covid relief bill from December. They argue that last year's bills cut aid off too soon and did not give enough help to struggling families, which is how the nation ended up with millions of Americans facing eviction, relying on food banks and unable to afford diapers.

AD

On Friday, the Labor Department reported that the official unemployment rate is 6.2 percent, but the White House said the true rate is 9.5 percent because so many Americans, especially mothers, have stopped working or even looking for a job while they care for children. People are not counted in the official unemployment statistics if they have not looked for a job in the past month.

To address the needs of low-income families, this bill does more than provide stimulus funds and extended unemployment aid. It also expands three key tax credits — the child tax credit, the earned income tax credit, and the child and dependent care tax credit — that advocates for the poor have long urged the government to do to help reduce poverty. These programs make up about $150 billion of the bill.

Under this more generous child tax credit plan, parents would receive $3,000 a year for every child ages 6 to 17 and $3,600 a year for every child under 6. The current credit is $2,000, and the poorest families can get a refund from the government for only $1,400. The stimulus bill also expands the child and dependent care tax credit so eligible families can deduct up to 50 percent of their costs, up from 20 to 35 percent before.

For people without children, the legislation expands the earned income tax credit, which helps supplement wages for the working poor.

These tax changes, along with another round of cash payments, will boost incomes of the bottom 20 percent of Americans by 33 percent, according to Steve Wamhoff, a tax expert at the liberal Institute on Taxation and Economic Policy. That's more than double what the March 2020 Cares Act did for the poorest Americans.

Many liberals hope these policies can be made permanent so this income boost does not disappear in 2022. The bill also provides more generous subsidies to help people afford health insurance and another attempt to expand Medicaid in states that have not yet done so.

"Most of us believe these programs like the child allowance will be made permanent," said Diane Whitmore Schanzenbach, director of Northwestern University's Institute for Policy Research.

If these programs do stick around, it raises questions about whether Democrats should be paying for them and not treating them like they are emergency relief. But advocates on the left point out that if America's safety net were better, not as many people would have fallen into such a difficult situation during the pandemic and the nation would not need as large of a response.

"We wouldn't have had to take such big steps if our policies even before the crisis had been more supportive of low-income workers and low-income kids," said Sharon Parrott, president of the left-leaning Center on Budget and Policy Priorities. "If all we do is recover back to 2019, then most low-paid workers still won't have access to health insurance and benefits and millions of children will still be in poverty."

Jeff Stein contributed to this report.

Saturday, March 6, 2021

Biz Insider: US economy adds 379,000 payrolls in February, smashing forecasts as virus cases tumble [feedly]

Looks like the vaccinations are having an impact, at least on biz hiring and recalls. Perhaps too soon to tell if this, like "de-masking" neanderthalism, will track, or just ruin, recovery.

US economy adds 379,000 payrolls in February, smashing forecasts as virus cases tumble

https://www.businessinsider.com/february-jobs-report-379000-payrolls-unemployment-rate-labor-market-recovery-2021-3?utm_source=feedly&utm_medium=webfeeds

Ben Hasty/MediaNews Group/Reading Eagle/Getty Images

  • The US added 379,000 jobs in February, beating the consensus estimate of 200,000 additions.
  • The reading marked a second straight month of labor-market expansion and came in well above January's revised sum of 166,000.
  • The unemployment rate dropped to 6.2% from 6.3%, putting it lower than forecasts.
  • Visit the Business section of Insider for more stories.

The US labor-market recovery accelerated in February as daily COVID-19 cases swiftly declined and the pace of vaccinations improved.

Businesses added 379,000 payrolls last month, the Bureau of Labor Statistics announced Friday. Economists surveyed by Bloomberg expected a gain of 200,000 payrolls.

The increase follows a revised 166,000-payroll jump in January. The labor market has now grown for two straight months after contracting in December as virus cases surged.

The US unemployment rate fell to 6.2% from 6.3%, according to the government report. Economists expected the rate to drop to stay steady at 6.3%. The U-6 unemployment rate - which includes workers marginally attached to the labor force and those employed part-time for economic reasons - remained at 11.1%.

The labor force participation was also unchanged at 61.4%. A falling participation rate can drag the benchmark U-3 unemployment rate lower, but such declines signal deep scarring in the labor market.

The bigger picture

Jobless claims data and private-payrolls reports offer some detail as to how the labor market fared through February, but the BLS release paints the clearest picture yet as to how the pandemic has affected workers and the unemployed.

Roughly 13.3 million Americans cited the pandemic as the main reason their employer stopped operations. That's down from 14.8 million people in January.

The number of people saying COVID-19 was the primary reason they didn't seek employment dropped to 4.2 million from 4.7 million.

About 22.7% of Americans said they telecommuted because of the health crisis. That compares to 23.2% in January.

Roughly 2.2 million Americans said their job loss was temporary, down from 2.7 million the month prior. The number of temporary layoffs peaked at 18 million in April, and while the sum has declined significantly, it still sits well above levels seen before the pandemic.

Filling the hole

The Friday reading affirms that, while the economy is far from fully recovered, the pace of improvement is picking up, most likely tied to the steady decline in daily new COVID-19 cases. The US reported 54,349 new cases on the last day of February, down from the January peak of 295,121 cases. Hospitalizations and daily virus deaths have similarly tumbled from their early 2021 highs, according to The COVID Tracking Project.

All the while, the country has ramped up the distribution and administration of coronavirus vaccines. The US has so far administered more than 82.6 million doses, according to Bloomberg data. The average daily pace of vaccinations climbed above 2 million on March 3 and has so far held the level. At the current rate, inoculating three-quarters of the US population would take roughly six months, but the Biden administration has a rosier outlook.

The president on Tuesday announced the US will have enough vaccines for every adult by the end of May. While distributing the shots will likely last beyond May, the new timeline marks a two-month improvement to the administration's previous forecast.

Still, other data tracking the labor market points to a sluggish rebound. Initial jobless claims totaled 745,000 last week, according to Labor Department data published Thursday. That was below the median economist estimate of 750,000 claims but a slight increase from the previous week's revised sum of 736,000. Weekly claims counts have hovered in the same territory since the fall as lingering economic restrictions hinder stronger job growth.

Continuing claims, which track Americans receiving unemployment benefits, fell to 4.3 million for the week that ended February 20. The reading landed in line with economist projections.

Other corners of the economy are faring much better amid the warmer weather and falling case counts. Retail sales grew 5.3% in January, trouncing the 1% growth estimate from surveyed economists. The strong increase suggests the stimulus passed at the end of 2020 efficiently lifted consumer spending in a matter of weeks.

All signs point to another fiscal boost being approved over the next few days. Senate Democrats voted to advance their $1.9 trillion stimulus plan on Thursday, kicking off a period of debate before a final floor vote. President Joe Biden has said he aims to sign the bill before expanded unemployment benefits lapse on March 14. The new package includes $1,400 direct payments, a $400 supplement to federal unemployment insurance, and aid for state and local governments.

The bill isn't yet a done deal. Sen. Ron Johnson of Wisconsin forced a read-out of the entire 628-page bill on Thursday, as Republicans seek to at least drag out its passage into law. Not a single Republican senator voted to advance the bill on Thursday.

A process known as "vote-a-rama" will start after the 20 hours of debate and give Republicans the chance to further impede a final vote by introducing potentially hundreds of amendments to the bill.


 -- via my feedly newsfeed