Monday, December 7, 2020

Calculated Risk: Seven High Frequency Indicators for the Economy [feedly]

Some interesting numbers on travel and entertainment. These numbers get updated frequently, so it will be a good place to track the impact of vaccines on very COVID vulnerable businesses and occupations.  

Seven High Frequency Indicators for the Economy
http://feedproxy.google.com/~r/CalculatedRisk/~3/9wEAxoawCoI/seven-high-frequency-indicators-for.html

These indicators are mostly for travel and entertainment.    It will interesting to watch these sectors recover as the vaccine is distributed.   

IMPORTANT: Be safe now - if all goes well, we could all be vaccinated by Q2 2021.

----- Airlines: Transportation Security Administration -----

The TSA is providing daily travel numbers.

 Click on graph for larger image.

This data shows the seven day average of daily total traveler throughput from the TSA for 2019 (Blue) and 2020 (Red).

The dashed line is the percent of last year for the seven day average.

This data is as of December 6th.

The seven day average is down 65.5% from last year (34.5% of last year).  (Dashed line)

There had been a slow increase from the bottom, but has declined following the Thanksgiving week holiday.

----- Restaurants: OpenTable -----

The second graph shows the 7 day average of the year-over-year change in diners as tabulated by OpenTable for the US and several selected cities.

Thanks to OpenTable for providing this restaurant data:

This data is updated through December 5, 2020.

This data is "a sample of restaurants on the OpenTable network across all channels: online reservations, phone reservations, and walk-ins. For year-over-year comparisons by day, we compare to the same day of the week from the same week in the previous year."

Note that this data is for "only the restaurants that have chosen to reopen in a given market". Since some restaurants have not reopened, the actual year-over-year decline is worse than shown.

Note that dining is generally lower in the northern states - Illinois, Pennsylvania, and New York - but declining in the southern states.

----- Movie Tickets: Box Office Mojo -----

This data shows domestic box office for each week (red) and the maximum and minimum for the previous four years.  Data is from BoxOfficeMojo through December 3rd.

Note that the data is usually noisy week-to-week and depends on when blockbusters are released.

Movie ticket sales have picked up slightly over the last couple of months, and were at $16 million last week (compared to usually around $200 million per week).

Some movie theaters have reopened (probably with limited seating).

----- Hotel Occupancy: STR -----

This graph shows the seasonal pattern for the hotel occupancy rate using the four week average

The red line is for 2020, dash light blue is 2019, blue is the median, and black is for 2009 (the worst year since the Great Depression for hotels - prior to 2020).

This data is through November 28th. Hotel occupancy is currently down 28.5% year-over-year.

Notes: Y-axis doesn't start at zero to better show the seasonal change.

Since there is a seasonal pattern to the occupancy rate, we can track the year-over-year change in occupancy to look for any improvement. This table shows the year-over-year change since the week ending Sept 19, 2020:

 -- via my feedly newsfeed

Sunday, December 6, 2020

Why Some of the Shift to Telecommuting Will Stick [feedly]


Why Some of the Shift to Telecommuting Will Stick

https://conversableeconomist.blogspot.com/2020/12/why-some-of-shift-to-telecommuting-will.html

It seems to me that the tone of the discussion surrounding the pandemic-induced shift telecommuting has been changing. Last spring and early summer, a lot of the discussion was about about how well it was working, how much time it was saving, how much employees preferred it, and so on. But then the discussions tend to express more concerns. In the words of a recent Wall Street Journal article, "Companies Start to Think Remote Work Isn't So Great After All Projects take longer. Collaboration is harder. And training new workers is a struggle. 'This is not going to be sustainable.'" Bloomberg reported on the results from a study done on teleworkers by researchers at the Harvard Business School:  "The Pandemic Workday Is 48 Minutes Longer and Has More Meetings. A study of 3.1 million workers around the world found an uptick in emailing, too."

What factors will determine whether the shift to telecommuting sticks? Jose Maria Barrero, Nicholas Bloom, and Steven J. Davis present some results from a series of nationally representative surveys of US workers done from May to October 2020, in "Why Working From Home Will Stick" (December 2020, University of Chicago Becker Friedman Institute Working Paper 2020-174). The authors argue that teleworking will remain substantially higher after the pandemic: they estimate a rise from about 5% of work-days were supplied from home before the pandemic, and it will be something like 22% even after the pandemic is done. Based on the survey data, they suggest five reasons why some of the shift to working from home will persist:

First, reduced stigma. A large majority of respondents report perceptions about working from home have improved since the start of the pandemic among people they know. With fewer people viewing working from home as "shirking from home," workers and their employers will be more willing to engage in it. 

Second, ... COVID-19 compelled firms to experiment with a new production mode – working from home – and led them to acquire information that leads some of them to stick with the new mode after the forcing event ends. 

Third, our survey reveals that the average worker has invested over 13 hours and about $660 dollars in equipment and infrastructure at home to facilitate working from home. We estimate these investments amount to 1.2 percent of GDP. In addition, firms have made sizable investments in back-end information technologies and equipment to support working from home. Thus, after the pandemic, workers and firms will be positioned to work from home at lower marginal costs due to recent investments in tangible and intangible capital. 

Fourth, about 70 percent of our survey respondents express a reluctance to return to some pre-pandemic activities even when a vaccine for COVID-19 becomes widely available, for example riding subways and crowded elevators, or dining indoors at restaurants. ...

Fifth, ... the massive expansion in working from home has boosted the market for working from equipment, software and technologies, spurring a burst of research that supports working from home, in particular, and remote interactivity, more broadly.
Here are a few reactions: 

1) More work-days happening from home would be bad news for dense urban areas. The authors write: "We estimate that 4 the post-pandemic shift to working from home (relative to the pre-pandemic situation) will lower post-COVID worker expenditures on meals, entertainment, and shopping in central business districts by 5 to 10 percent of taxable sales." 

2) The workers who are well-positioned to benefit from working form home often tend to have higher incomes and workplace status. Workers in retail or manufacturing or many other other jobs don't have a work-from-home option. For new workers getting hired, on-the-job learning and professional connections are almost certainly harder to create when you're one more face in a checkerboard of continual online meetings. In that sense, the additional perk of sometimes working from home is likely to create a separation between a more favored class of  workers that has access to this option and other workers who do not. 

3) There's a conflict in what workers and employers saying about productivity during the pandemic. In this survey data, workers typically report being more productive from home. But employers often report that productivity is lower when people are working at home (for example, see "What Jobs are Being Done at Home During the Covid-19 Crisis? Evidence from Firm-Level Surveys," by Alexander W. Bartik, Zoe B. Cullen, Edward L. Glaeser, Michael Luca & Christopher T. Stanton, NBER Working paper #27422 , June 2020). One possible reason for this gap is that many of those working from home are happy to be doing it, and they are overestimating their productivity. Another possible reason is that workerks tend to focus on their productivity in doing specific day-to-day tasks, but employers are also looking at activities like the benefits of training or brainstorming that may be facilitated by more informal face-to-face interactions. 

4) Finally, there's a lot of research on the "economics of density," which tends to find that workers who are grouped together have higher productivity. After all, there's a reason why cities and downtown areas with concentrated employment came into existence in the first place, and why they have been the engines of economic growth over time. The after-effects of the pandemic will test this connection. If those who work closely in a physical sense continue to have higher pay and productivity, then those who work from home are likely to gain flexibility but suffer some career slowdowns, because they aren't where the action is. Perhaps employers and firms have now learned how to gain the benefits of physical closeness via web-based conference calls. Or maybe not. 

For an overview of these arguments about the economics of density, the Summer 2020 issue of the Journal of Economic Perspectives has a useful Symposium on the Productivity Advantages of Cities: 
For a previous post on this topic from last spring, see "Will Telecommuting Stick?"(May 26, 2020).

 -- via my feedly newsfeed

Saturday, December 5, 2020

The long-run implications of extending unemployment benefits in the United States for workers, firms, and the economy [feedly]

... automatic stabilizers would help

The long-run implications of extending unemployment benefits in the United States for workers, firms, and the economy

https://equitablegrowth.org/the-long-run-implications-of-extending-unemployment-benefits-in-the-united-states-for-workers-firms-and-the-economy/

At the outset of the coronavirus pandemic earlier this year, millions of U.S. workers lost their jobs. In March, the U.S. Congress took notice and decided that the 26 weeks of Unemployment Insurance typically provided by states were not enough for an employment crisis that would likely extend beyond 6 months. Through the new Pandemic Emergency Unemployment Compensation program, it provided people who lost jobs through no fault of their own with an additional 13 weeks of benefits.

Today, coronavirus cases counts are skyrocketing, hospitals are filling, businesses are closing, and long-term unemployment is surging. But some workers have already run out of benefits, and the PEUC program is set to expire on December 26, leaving 8.1 million workers without any income support through this emergency 13-week benefit extension.

The expiration of the Pandemic Emergency Unemployment Compensation program means devastation for workers and their families this December. But research released earlier this year by Adriana Kugler and Umberto Muratori at Georgetown University and Ammar Farooq at Uber Technologies Inc. shows that the effects of the PEUC expiration are likely to persist far into the future for workers whose benefits expire, and ripple through the U.S. economy to affect firms and workers searching for well-matched employment relationships.

The basic idea behind this research is intuitive. When people have resources to meet their basic needs while out of work, they can take the time they need to find the right job for them, rather than taking the first work opportunity that comes along. Workers benefit because they find jobs that pay more and meet their needs more broadly, and firms benefit because they recruit workers with the right skills for the job. While the idea makes sense, it hasn't been backed by much evidence in the U.S. context, in part because of data limitations.

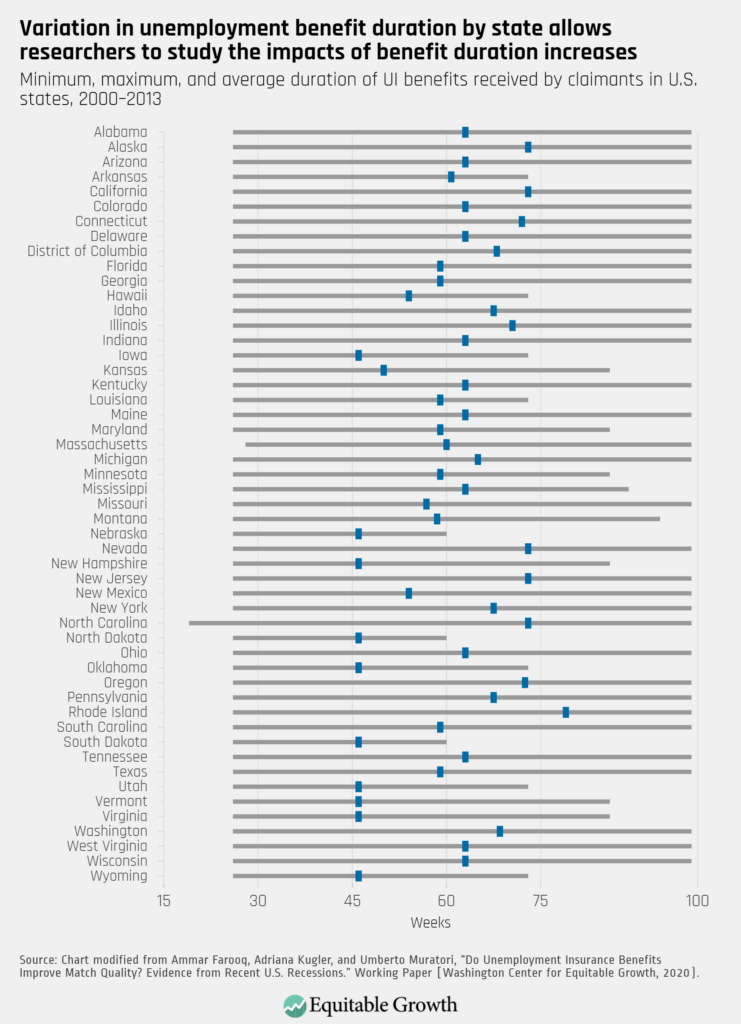
This makes it particularly exciting that this research team was able to access data from the Longitudinal Employer Household Dynamics database, which matches administrative information about workers and their earnings with administrative information about their employers. Using these data, as well as information from the Current Population Survey and the natural experiment that occurred when different states offered different durations of unemployment benefits during the Great Recession of 2007–2009 and its aftermath, Farooq, Kugler, and Muratori take a close look at how job seekers and firms fare when the duration of unemployment benefits is extended. (See Figure 1.)

Figure 1

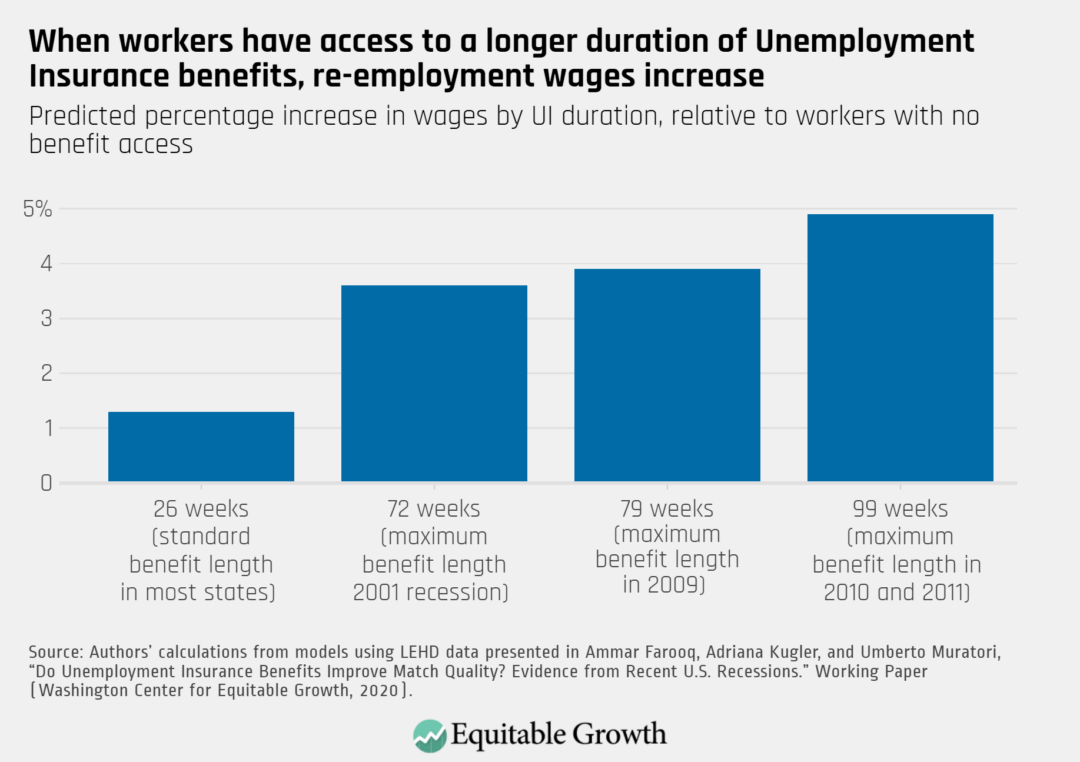
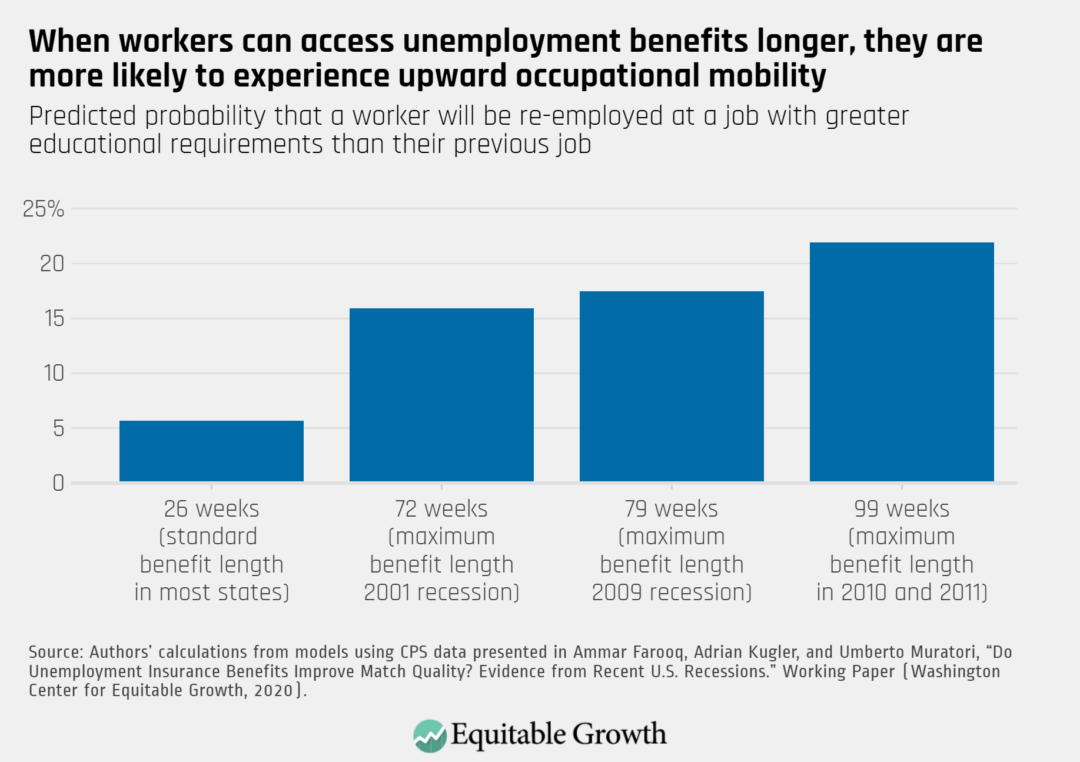
Farooq, Kugler, and Muratori find that the longer you have access to unemployment benefits, the higher paying the job that you eventually find is and the more your skills and training get put to use. (See Figures 2 and 3.) Access to the full extended emergency benefits during 2009, which increased benefits from 26 weeks to 79 weeks, increases re-employment wages by 2.6 percent and also increases the probability that a worker will be re-employed in a job that requires more education than their previous job by 11.7 percentage points.

Figure 2

Figure 3

The idea that workers match their talents with job openings that put their skills to use is not just good news for those workers. It matters for firms and the broader economy as well. Farooq, Kugler, and Muratori take advantage of their dataset, which allows them to follow individual workers over time and also to see the full workforce of the firms with which they eventually find re-employment. Using these features of the data, they find that higher-quality firms are better able to recruit workers that have the abilities they need. This creates a chain reaction that spreads through the U.S. economy. The authors describe it eloquently:

These results suggest that if a worker can receive UI benefits for a longer period, she will be able to find a job with an employer that is closer to her in terms of quality. This worker then is likely to leave another job open for someone else who is also likely to be better matched, and in turn that other worker can also leave vacant another job and relieve it to someone else, generating a chain reaction that makes many other workers, beyond the one receiving the UI extension, match better in the labor market.

In this manner, the benefits of extended unemployment benefits ripple past a worker's current situation to affect their future job prospects, the productivity of firms, and the experiences of workers across the economy.

Particularly striking is the fact that the positive effects of extended unemployment benefits are larger for workers who are members of groups that lack funds for a rainy day. Because of labor market discrimination, unequal access to education and training, caregiving obligations, and stagnating wage levels, members of demographic groups, including women, people of color, and less-educated workers, typically lack the private savings held by their counterparts who are members of more advantaged groups.

Indeed, this research finds that during the Great Recession and its aftermath, women, people of color, and low-educated workers improve their job matches when they have access to unemployment benefits even more than their counterparts who are members of wealthier demographic groups. The research team finds that a 53-week increase in UI benefits improves the job-match quality by 0.9 percent for White workers, but improved match quality even more for workers of color: The effect size for workers of color is 1.2 percent.

Similarly, Farooq, Kugler, and Muratori find that workers of color (along with women, less-educated workers, and young workers) see larger returns to increased weeks of benefits when it comes to wage levels. This supports the idea that the improved fit between workers and the jobs they find stems from workers' ability to spend more time searching for a job that is a good match, without sacrificing their basic needs in the short term.

Their findings also suggest that insufficient durations of unemployment benefits during moments of macroeconomic contraction exacerbate inequality in the U.S. labor market. This concern is magnified during today's coronavirus recession because the sectors of the U.S. economy that have been hardest hit are the same ones where women, people of color, and low-educated workers are overrepresented.

There is another reason that policymakers should be deeply concerned about the relationship between job matching and extended unemployment benefits during this crisis in particular. While this research speaks to job match in terms of workers' education levels and wages, we can guess that the extended time provided for job search also allows workers to find jobs that are better matches for them along other dimensions—schedule flexibility, location, and working conditions. During the current public health crisis, working conditions are of outsize importance. The ability to be choosy about the health and safety conditions of one's workplace is more likely to be the difference between life and death for a worker or a member of the worker's family than is typical outside of the context of a public health crisis.

So, what to do about the upcoming expiration of the PEUC program? There is the obvious short-term fix—extend the duration of PEUC benefits so that all workers who are unemployed through no fault of their own can receive unemployment benefits for the amount of time it takes to find a job that is a good match for their skills and their health.

And then, there is the bigger structural issue. It's clear from a macroeconomic perspective that the duration of unemployment benefits should extend automatically during moments of economic contraction. Indeed, a permanent program called the Extended Benefits program is designed to do just this. But the formulae we rely on (known as "triggers") to turn on Extended Benefits are broken, and we are repeatedly left in the situation we find ourselves in today: waiting on political horse trades to enact common sense, economically necessary policy decisions through one-off emergency benefit extensions.

So, to make unemployment compensation work for workers and for the economy as a whole in both the short- and long-term, policymakers should extend PEUC today, but they shouldn't stop there. They should also redesign Unemployment Insurance permanently with improved automatic stabilizers so that payment extensions trigger automatically when economic conditions warrant.


 -- via my feedly newsfeed

Wages for the top 1% skyrocketed 160% since 1979 while the share of wages for the bottom 90% shrunk: Time to remake wage pattern with economic policies that generate robust wage-growth for vast majority [feedly]

Wages for the top 1% skyrocketed 160% since 1979 while the share of wages for the bottom 90% shrunk: Time to remake wage pattern with economic policies that generate robust wage-growth for vast majority
https://www.epi.org/blog/wages-for-the-top-1-skyrocketed-160-since-1979-while-the-share-of-wages-for-the-bottom-90-shrunk-time-to-remake-wage-pattern-with-economic-policies-that-generate-robust-wage-growth-for-vast-majority/


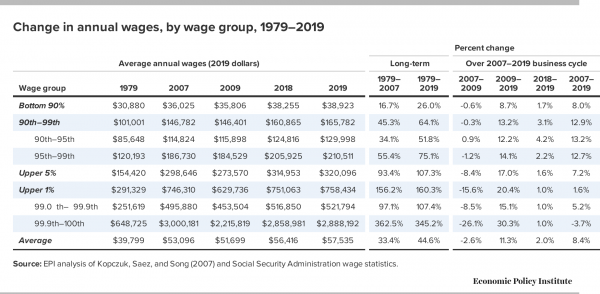
Newly available wage data tell a familiar story: In every period since 1979, wages for the bottom 90% were continuously redistributed upward to the top 10% and frequently to the very highest 1.0% and 0.1%.

For last year, 2019, the data show a continuation, with annual wages rising fastest for those in the top 10% while those in the bottom 90% saw below-average wage growth.

This unceasing growth of wage inequality that undercuts wage growth for the bottom 90% reaffirms the need to place generating robust wage growth for the vast majority and rebuilding worker power at the center of economic policymaking.

A similar pattern as in 2019 prevailed over the entire 2007–2019 business cycle as wages were redistributed in two ways, up from the bottom 90% to the top 10% and within the top 10% from the top 1% to those in the remaining 9% of the top 10%. Still, the top 1% has done far better in the 2009–2019 recovery (wages rose 20.4%) than did those in the bottom 90% (wages rose only 8.7%).

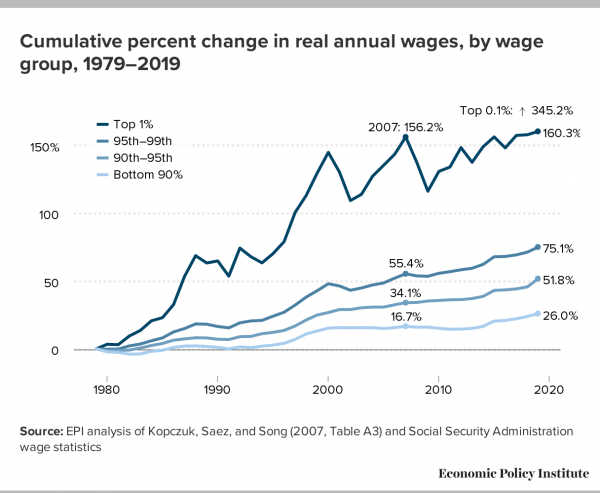
As Figure A shows, the top 1% and the very tippy top, those in the top 0.1%, were the clear winners over the longer-term 1979–2019 period:

  • The top 1.0% saw their wages grow by 160.3%; and
  • wages for the top 0.1% grew more than twice as fast, up a spectacular 345.2%.
  • In contrast, those in the bottom 90% had annual wages grow by 26.0% from 1979 to 2019.

This disparity in wage growth reflects a sharp long-term rise in the share of total wages earned by those in the top 1.0% and 0.1%.

These are the results of EPI's updated series on wages by earning group, which is developed from published Social Security Administration (SSA) data and updates the wage series from 1947–2004 originally published by Kopczuk, Saez and Song (2010). These data, unlike the usual source of our other wage analyses (the Current Population Survey), allow us to estimate wage trends for the top 1.0% and top 0.1% of earners, as well as those for the bottom 90% and other categories among the top 10% of earners. These wage data are not top-coded, meaning the underlying earnings reported are actual earnings and not "capped" or "top-coded" for confidentiality. These SSA wage data are W-2 earnings, which include realized stock options and vested stock awards.

Figure A

Over the longer term, since 1979, there was far faster wage growth at the top (highest 1.0%) and tippy top (upper 0.1%), signaling a major redistribution upward from the bottom 90%. As Figure A shows, the top 1.0% of earners are now paid 160.3% more than they were in 1979. Even more impressive is that those in the top 0.1% had more than double that wage growth, up 345.2% since 1979 (Table 1). In contrast, wages for the bottom 90% grew only 26.0% in that time. The other segments of the top 10% (those in the 90th–95th percentiles and 95th–99th percentiles) also had faster-than-average wage growth since 1979, up 51.8% and 75.1%, but nowhere near as fast as the wage growth at the top. Thus, wages have been redistributed upward since 1979 from the bottom 90% to the top 10% and within the top 10% to the top 1% and especially to the top 0.1%.

This pattern of upward wage distribution also prevailed over the recent recovery (since 2009): The bottom 90% experienced modest annual wage growth—reflecting growing annual hours as well as higher hourly wages—up 8.7% from 2009 to 2019. In contrast, the wages of the top 1.0% and top 0.1% grew, respectively, 20.4% and 30.3% in the last 10 years.

In the most recent year, however, wages grew fastest for the bottom 9% of the top 10% (up 4.2% for 90th–95th percentiles, up 2.2% for 95th–99th percentiles) and slower than average for the bottom 90% (up 1.7%) and the top 0.1% and top 1% (both up 1.0%).

One key characteristic of the Great Recession downturn was the big hit on the very highest earners, with the top 1% and top 0.1% seeing 15.6% and 26.1% declines over the two years from 2007 to 2009. Even by 2019 the top 0.1% had not recovered from this sharp fall at the start of the business cycle as the top 1% as a whole earned only 1.6% above their 2007 earnings. Thus, the business cycle from 2007 to 2019 was one in which wages were redistributed from the bottom 90% to the top 10% and within the top 10% from the top 1% to the remainder of the top 10% (the 90th–99th percentiles). The one constant wage dynamic in every period since 1979 has been that the wages for the bottom 90% are continuously redistributed upward.

It is worth noting that our series on the wage growth of the bottom 90% corresponds closely to the Social Security Administration's series on median annual earnings: Between 1991 and 2019 the real median annual wage grew 23.8%, very close to the 26.0% growth for the bottom 90%.

It is also noteworthy that the wage growth for the bottom 90% was almost entirely concentrated in the two periods of sustained low unemployment representing 11 of the 40 years: The bottom 90%'s wage growth in the 1995–2000 and 2013–2019 periods represented 90% of all the wage growth ($7,230 of $8,043) over the entire 1979–2019 period. The shift of wages away from the bottom 90% meant that their wages rose 26.0% rather than the 44.6% increase obtained on average over the 1979–2019 period, some 18.6 percentage points faster growth.

Table 1

These disparities in long-term wage growth reflect a major redistribution upward of wages since 1979, as noted earlier. The bottom 90% earned 69.8% of all earnings in 1979 but only 60.9% in 2019 (Table 2). In contrast, the top 1.0% nearly doubled its share of earnings from 7.3% in 1979 to 13.2% in 2019. The growth of wages for the top 0.1% is the major dynamic driving the top 1.0% earnings as the top 0.1% more than tripled its earnings share, from 1.6% in 1979 to 5.0% in 2019.

Table 2

The bottom 90% lost some ground over the recent business cycle, 2007–2019, as their wage share fell slightly, from 61.1% to 60.9%. The winners in the recent business cycle were not the top 1%, whose wage share fell from 14.1% to 13.2%. Rather, the upward redistribution of wages from the bottom 90% and the shift away from the top 1.0% in the recent business cycle accrued to the other high earners in the top 10%, those earning between the 90th and 95th percentiles (averaging $129,998 in 2019) and between the 95th and 99th percentiles (averaging $210,511 in 2019).

 -- via my feedly newsfeed

Jared Bernstein: November jobs report shows clear, virus-related slowing [feedly]

November jobs report shows clear, virus-related slowing
http://feedproxy.google.com/~r/JaredBernstein/~3/gmUZgBOOZlY/

Payrolls were up 245,000 last month, the slowest month for job gains since the jobs recovery began in April. The jobless rate fell from 6.9 to 6.7 percent, but this was due to a decline in labor market participation, not more jobs (in the households survey from which the unemployment rate is drawn, employment fell). Job changes in virus-affected sectors, like restaurants (down 17,000 jobs), suggest that the spiking virus caseload is hurting job growth. 

Overall, as the figure shows, payrolls remain 9.8 million jobs down from their pre-recession peak. If the pace of gains doesn't speed up from that of November, it would take about 3 years to get back to the pre-pandemic peak. But this is too low a bar because it doesn't factor in job growth that would have occurred had we remained on the earlier trend. Hitting that target at this rate would take 4 years (see figure below).

Source: BLS, my calculations

In other words, we'll need much faster job growth if we are to get back to full employment in a timely manner.

Private sector jobs grew more quickly last month, up 344,000. One reason for this difference was 93,000 fewer temporary federal hires for the 2020 Census. Another is the decline in local education jobs, down 21,000 in November and 688,000 since February, a function of both Covid-induced disruptions to public schools and struggling municipal budgets.

Other concerning indicators from today's report include:

–A sharp rise in long-term unemployment (jobless for at least 27 months), accompanied by a continuing shift from those unemployed due to temporary layoffs and those facing more lasting job searches. Since August, the number in long-term unemployment is up 2.3 million, the largest such increase on record.

–In-person service jobs, like those in the leisure and hospitality sector, are particularly at risk when the virus is spiking. After growing at a solid clip in recent months, restaurant jobs were down 17,400 in November. 

–The number of private-sector industries adding jobs in November fell sharply, from 71 to 59 percent.

This jobs report shows the clear impact of two intersecting forces: the spiking virus and the fading of earlier fiscal relief packages passed by the Congress. The former, as noted, is continuing to put firm, downward pressure on the pace of job creation. The latter means that fiscal support is fading well before the job market is up to the task of replacing lost labor incomes. 

Since the Federal Reserve is already doing what they can to keep the cost of credit very low, the missing piece is added fiscal support. As President-elect Biden said today, "If Congress and President Trump fail to act, by the end of December 12 million Americans will lose the unemployment benefits they rely on to keep food on the table and pay their bills."

The good news is that Congress is considering a new, bipartisan, $900 billion relief plan that would help avoid some of the suffering due to the ongoing health and economic crises. Today's jobs report provides a clear, unequivocal signal that this package, which is but a partial first step towards a robust, resilient recovery, needs to get quickly into the economy and into the lives of vulnerable families.


 -- via my feedly newsfeed

Thursday, December 3, 2020

Re: Matthew Yglesias: The "racial wealth gap" is a class gap

Here's a piece by Adolph Reed on the Trouble with Disparity that takes on a similar topic. https://nonsite.org/the-trouble-with-disparity/

On Thu, Dec 3, 2020 at 3:18 PM John Case <jcase4218@gmail.com> wrote:
A provocative take on the class / identity question with respect to racism.


A provocative take on the class/identity question with respect to race. Send comments!


The "racial wealth gap" is a class gap


Rich people are very white, but most white people aren't rich

Matthew YglesiasDec 2

Good morning it's Wednesday!

And what a fine day to discuss an unfashionable leftist view of mine. The discussion "racial wealth gap" is a somewhat perverse way to think about the real issue: A relatively small minority of the American population controls a huge share of the wealth, and that small minority is disproportionately white.

You could, in principle, try to ameliorate the resulting racial wealth gap by making the wealthy elite more racially diverse — a strategy that would do nothing to help the vast majority of non-white people. Alternatively, you could try to narrow the gap between rich and non-rich people, which would help the majority of people of all races. The latter approach is better on both substance and politics. So much better that to an extent it raises the question of what's the point of talking about a "racial wealth gap" as opposed to simply a gap between the wealthy and the non-wealthy?

The wealth gap is about the wealthy

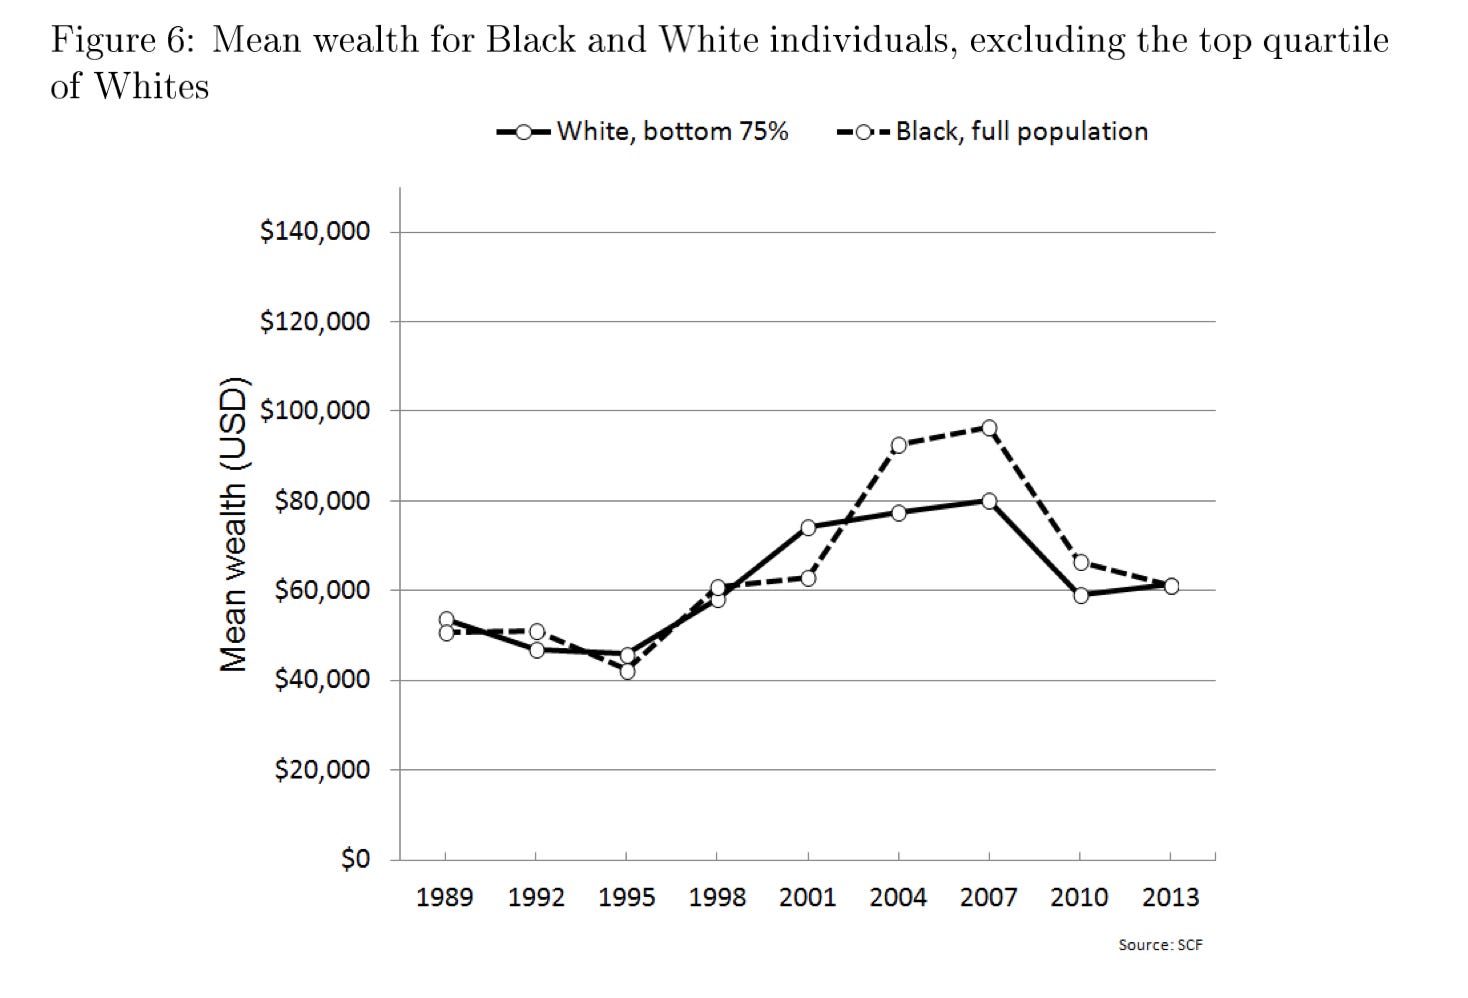
For his master's thesis, Kevin Carney took a detailed look at the evolution of the black/white wealth gap in the United States and among other things came away with this finding — if you lop off the richest quarter of white people, then suddenly Black and white wealth dynamics over time look very similar.

The infamous destruction of African-American wealth during the subprime mortgage crash, for example, also happened for the majority of white households. The reason the racial wealth gap grew during this period is that rich white people own a lot of shares of stock while everyone else's wealth is in their homes (if it exists at all).

Another way of looking at this is that while most white people are not members of the economic elite, the economic elite is a very white group of people.

With some help from Matt Bruenig of the People's Policy Project, I looked at the racial composition of the wealthy elite according to the Fed's Survey of Consumer Finances:

  • If you look at the top 10 percent of Americans by wealth, only 2.2 percent of those Americans are Black.

  • The top 5 percent of Americans by wealth are only 2 percent Black.

  • The top 1 percent, is only 0.5 percent Black.

Bruenig cautions that when you look at tiny subgroups like the top one percent, you get into sample size issues since the Fed only surveys about 5000 families (he also did an article looking at the numbers from the older SCF that's worth your time). But it's plain as day if you look at the numbers that as you go from top ten to top five to four, three, two, one you get a less and less Black group of people while the white percentage goes up and up.

Now some level that "white people are richer than Black people" and "the rich are a very white group of people" are two different ways of saying the same thing.

But I do think the framings lead to someone different ideas. Talking about income rather than wealth, Valerie Wilson and William Rogers found that the black/white economic gap grew between 1979 and 2016 primarily because wage inequality overall grew (see also this discussion in The Grio). You could address that either by trying to create a more egalitarian wage structure or by trying to create a more diverse set of people earning very high salaries even while doing nothing to improve the average person's pay. Similarly, you could approach the wealth gap issue primarily as a lack of diversity among America's billionaire class.

Billionaires own a lot of white wealth

Rich white guys. It's a thing.

According to the Forbes 400 list (an imperfect metric but good enough for a ballpark estimate†), there are seven African-American billionaires who have a combined wealth of $13 billion. These people are all very rich, obviously. But there's a (white) guy named David Tepper who's not particularly famous and who Forbes says is worth $13 billion all on his own. And he's only 41st on the list!

And billionaires collectively own a lot of wealth. Forbes says their top 400 are worth $3.2 trillion, of which less than one percent is owned by Black people. In a statistical sense, this drives a considerable racial wealth gap.

Now on the other hand, it's not as if the typical white person is a billionaire. Mark Zuckerberg's vast fortune is not materially benefiting Jared Golden's constituents in northern Maine or Joe Manchin's constituents in West Virginia via some magical property of shared whiteness.

Now a right-wing opponent of redistribution might want to do some racecraft to convince tens of millions of working class white people that they participate in the wealthy of white billionaires. But it's often been people on the left perpetuating this idea! Simply redistributing resources from billionaires to the majority of the population would help most white people, and help most Black people, and would also narrow the racial wealth gap.

Diversity or equality?

Going back to Carney's research, he's talking about the top 25 percent of the white wealth distribution, which is a much bigger group than just billionaires. But you do see among the mass affluent some of this same impulse to say we need more diversity, rather than more equality. Take for example the town of Hingham in the suburbs of Boston which is getting its own YIMBY group.

Except according to the Boston Globe "the Hingham YIMBY group is not focused on promoting low-income housing, but is instead aimed at increasing the town's racial diversity."

Now one point YIMBYs normally make about towns like Hingham is that by excluding new housebuilding and zoning out low-income families, they tend to render themselves very white. Hingham YIMBY's solution to this is to market the town more heavily to prosperous African-American suburbanites in Greater Boston and encourage them to consider moving to Hingham. And mathematically, they are correct. Hingham is not a large place, so a pure marketing campaign to convince more rich Black people to move there could make it a diverse place.

But look at this land-use in Hingham! The town is home to two MBTA commuter rail stations. One of them abuts a golf course and some underdeveloped land:

The other just abuts a bunch of underdeveloped land:

If you allowed the construction of apartment buildings near those stations, you'd almost certainly improve the diversity of the town. But more to the point, you'd create the opportunity for a bunch of people to live in transit-oriented housing with convenient commuter rail access to the Boston labor market. And if Massachusetts as a whole opted to legalize housing near transit, they could do an enormous amount to grow the state's economy, raise living standards, and promote sustainable commuting patterns.

Convincing a few affluent Black families to move to Hingham, by contrast, isn't really going to achieve much of anything.

And that's the big picture here. Exclusion is bad for racial equity. But that doesn't mean the solution is to fiddle with the racial equity dial by importing some really rich black people. The solution is for the Bay State to embrace housing growth and adopt international best practices in commuter rail operation. That would create broad prosperity that lifts up the majority of the people in the state and, yes, by doing so, it would also improve racial equity.

By the same token, you could take a Hingham approach to the billionaire problem and say that we need to make the billionaire class more diverse. But while conjuring up four dozen additional Black billionaires would have a impact on our understanding of Black wealth, it would not actually accomplish anything to make life better for the overwhelming majority of Black people. What would do that is the exact same thing as what would make life better for most white people — broad steps to create a less lopsided distribution of economic resources.

Tractable solutions are not "reductionism"

Now please do not read me as saying that there is no racism in America or that class politics is the only thing. We have lots of evidence of racial discrimination in the labor market, in the housing marketin policing and elsewhere.

But the way to tackle those problems would be to tackle them.

For example, there's solid reason to believe that the relatively straightforward step of conducting more DOJ "pattern or practice" investigations of police discrimination would lead to both less discrimination and fewer murders. And there's probably a lot the Civil Rights Division could be doing with audits to crack down on housing and labor market discrimination.

But if you're concerned about the economic disparity between white people and Black people, what you really ought to be concerned with is the disparity between rich people and non-rich people. You obviously don't want to narrow the gap in an economically destructive way. But if you can find growth-friendly ways to redistribute resources, you mechanically improve the racial gap. And even better, you have a tractable political problem — most voters are white, but most voters are not rich. And white people are overrepresented in the Senate, but rich people are underrepresented. So if you try to build a politics around racial redistribution, you're just going to lose. But if you try to build a politics around economic redistribution you just might win.

None of this is remotely revolutionary; it's just long-held conventional wisdom about politics. But the internal dynamics of progressive spaces have shifted in a weird way. Everyone is sensitive to often valid complaints that they've slighted racial justice in the past. But instead of dropping their work to refocus on problems that really are distinctively racial, what's mostly happened is either an effort to give redistributionist ideas new (but less popular) racial framing or else Hingham-esque efforts to achieve a superficial veneer of equity. But the majority of people in all ethnic groups are similarly situated in economic terms, and far and away the best way to make progress on material conditions is to emphasize that rather than reify the whiteness of the billionaire class.


† Thomas Piketty has told me that in his view the Forbes 400 (and similar lists from Bloomberg and other media sources) undercount the wealth of old money heirs who own diverse assets rather than large, easy to spot, stakes in single companies. If he's right about that, the true super-rich class is even whiter than what Forbes says.

--


--

TED BOETTNER  Senior Researcher

Ohio River Valley Institute

(c) 304 590 3454 @BoettnerTed