Sunday, June 28, 2020

How a Black Commons Could Help Build Communal Wealth [feedly]

Interesting take on reparations.

How a Black Commons Could Help Build Communal Wealth

https://www.yesmagazine.org/social-justice/2020/06/26/black-wealth-land-ownership

Underlying the recent unrest sweeping U.S. cities over police brutality is a fundamental inequity in wealth, land, and power that has circumscribed Black lives since the end of slavery in the U.S.

The "40 acres and a mule" promised to formerly enslaved Africans never came to pass. There was no redistribution of land, no reparations for the wealth extracted from stolen land by stolen labor.

June 19 is celebrated by Black Americans as Juneteenth, marking the date in 1865 that former slaves were informed of their freedom, albeit two years after the Emancipation Proclamation. Coming this year at a time of protest over the continued police killing of Black people, it provides an opportunity to look back at how Black Americans were deprived of land ownership and the economic power that it brings. An expanded concept of the "Black commons"—based on shared economic, cultural and digital resources as well as land—could act as one means of redress. As professors in urban planning and landscape architecture, our research suggests that such a concept could be a part of undoing the racist legacy of chattel slavery by encouraging economic development and creating communal wealth.

Land grab

The proportion of the United States under Black ownership has actually shrunk over the last 100 years or so.

At their peak in 1910, African American farmers made up around 14% of all U.S. farmers, owning 16 to 19 million acres of land. By 2012, Black Americans represented just 1.6% of the farming community, owning 3.6 million acres of land. Another study shows a 98% decline in Black farmers between 1920, and 1997. This contrasts sharply with an increase in acres owned by white farmers over the same period.

In a 1998 report, the U.S. Department of Agriculture ascribed this decline to a long and "well-documented" history of discrimination against Black farmers, ranging from New Deal and USDA discriminatory practices dating from the 1930s to 1950s-era exclusion from legal, title and loan resources.

The lack of ownership is crucial to understanding the crippling economic disparity that has hollowed out the Black middle class.

Discriminatory practices have also affected who owns property as well as land. In 2017, the racial homeownership gap was at its highest level for 50 years, with 79.1% of White Americans owning a home compared to 41.8% of Black Americans. This gap is even larger than it was when racist housing practices such as redlining, which denied Black residents mortgages to buy, or loans to renovate, property were legal.

The lack of ownership is crucial to understanding the crippling economic disparity that has hollowed out the Black middle class and continues to plague Black America—making it harder to accrue wealth and pass it on to future generations.

A 2017 report found that the median net worth for non-immigrant Black American households in the greater Boston region was just US$8, but for whites it was $247,500. This was because of "general housing and lending discrimination through restrictive covenants, redlining and other lending practices."

Nationally, between 1983 and 2013, median Black household wealth decreased by 75% to $1,700 while median white household wealth increased 14% to $116,800.

Freedom farms

Land ownership today could look very different. The idea of collective ownership has a long history in the United States. Even during slavery, a piece of ground was granted by slave masters for enslaved African subsistence farming. The Jamaican social theorist Sylvia Wynter called this land "the plot."

The principles of collective land ownership evolved in post-slavery Black America.

Wynter has explained how that these parcels of land were transformed into communal areas where slaves could establish their own social order, sustain traditional African folklore and foodways—growing yams, cassava and sweet potatoes. Plots were often called "yam grounds," so important was this staple food.

The connection between food, land, power and cultural survival was subversive in its nature. By appropriating physical space to support collective growing practices within the brutal constraints of slavery, Black people also demonstrated the need for common, shared mental space to enable their survival and resistance. Herbalism, medicine and midwifery, and other African American healing practiceswere seen as acts of resistance that were "intimately tied to religion and community," according to historian Sharla M. Fett.

With the end of slavery, these plots disappeared.

Fannie Lou Hamer, civil rights organizer, in 1964. Photo by GHI Vintage/Universal History Archive/Universal Images Group/Getty Images.

The principles of collective land ownership evolved in post-slavery Black America. It was central to civil rights organizer Fannie Lou Hamer's Freedom Farms, a cooperative model designed to deliver economic justice to the poorest Black farmers in the American South.

In Hamer's view, the fight for justice in the face of oppression required a measure of independence that could be achieved through owning land and providing resources for the community.

This idea of a Black commons as a means of economic empowerment formed a focus of W.E.B. DuBois' 1907 "Economic Co-operation Among Negro Americans." DuBois believed that the extreme segregation of the Jim Crow era made it necessary to ground economic empowerment in the cultural bonds between Black people and that this could be achieved through cooperative ownership.

Credit unions and co-ops

The accumulation of wealth was not the only desired consequence of a Black commons.

In 1967, social critic Harold Cruse argued for a "new institutionalism" that would create a "new dynamic synthesis of politics, economics, and culture." In his view, economic ventures needed to be grounded in the greater aspirations of Black communities – politically, culturally and economically. This could be achieved through a Black commons.

As the political economist Jessica Gordon Nembhard has noted in reference to Black credit unions and mutual aid funds, "African Americans, as well as other people of color and low-income people, have benefited greatly from cooperative ownership and democratic economic participation throughout the nation's history."

The long history of racism in the United States has held back Black Americans for generations.

The nonprofit Schumacher Center for a New Economics is working to rejuvenate the idea of Black commons. In a 2018 statement, the center proposed to adopt a community land trust structure "to serve as a national vehicle to amass purchased and gifted lands in a Black commons with the specific purpose of facilitating low-cost access for Black Americans hitherto without such access."

Meanwhile, shared equity housing schemes and community land trusts continue to grow, helping Black families own property, advance racial and economic justiceand mitigate displacement resulting from gentrification.

Digital commons

The disproportionate effects of the coronavirus pandemic and unrest over police brutality have highlighted deeply embedded structural racism. Organizations such as Black Lives Matter and the Movement for Black Lives are demonstrating a renewed vigor around collective action and a blueprint for how this can be achieved in a digital age. At the same time, Black Americans are also forging a cultural commons through events such as DJ D-Nice's Club Quarantine—a hugely popular online dance party. Club Quarantine's success indicates the potential for using online platforms to facilitate community building, pointing toward future economic cooperation.

That's what organizations such as Urban Patch are trying to do. The nonprofit group uses crowdsourced funding to build community spaces in inner city areas of Indianapolis and encourage collective economic development that echoes the Black commons of years past.

The long history of racism in the United States has held back Black Americans for generations. But the current soul-searching over this legacy is also an unrivaled opportunity to look again at the idea of collective Black action and ownership, using it to create a community and economy that goes beyond just ownership of land for wealth's sake.

This article was originally published by The Conversation. It has been published here with permission.

The post How a Black Commons Could Help Build Communal Wealth appeared first on Yes! Magazine.


 -- via my feedly newsfeed

IMF: Outlook for Latin America and the Caribbean: An Intensifying Pandemic [feedly]

Outlook for Latin America and the Caribbean: An Intensifying Pandemic
https://blogs.imf.org/2020/06/26/outlook-for-latin-america-and-the-caribbean-an-intensifying-pandemic/

By Alejandro Werner

EspaƱol

Latin America and the Caribbean have become the new COVID-19 global epicenter. The human cost has been tragic, with over 100,000 lives lost. The economic toll has also been steep. The World Economic Outlook Update now estimates the region to shrink by 9.4 percent in 2020, four percentage points worse than the April projection and the worst recession on record. A mild recovery to +3.7 percent is projected in 2021.

Latin American countries should be cautious in reopening their economies and allow science and data to guide the process.

The pandemic

The rates of COVID-19 infections and deaths per capita are approaching those in Europe and the United States, with the total number of cases accounting for about 25 percent of the worldwide total.


Against this backdrop, countries should be very cautious when considering reopening their economies and allow science and data to guide the process. Indeed, many countries in the region have high levels of informality and low preparedness to handle new outbreaks, like a high occupancy of intensive care unit beds and low testing and tracing capacity.

Recent economic developments

Weaker economic data and more protracted COVID-19 outbreaks explain the significant downward revisions compared to our April forecasts. First quarter growth was worse than expected for most countries, while high frequency indicators – like industrial production, electricity consumption, retail sales, and employment – suggest that the decline in the second quarter will be deeper than projected in April. The pandemic's still rapid spread indicates that social distancing measures will need to remain in place for a longer time, depressing economic activity in the second half of 2020 and leaving more scarring going forward.


Despite the difficult outlook, external financial conditions have eased in recent weeks, largely reflecting strong actions by advanced economies' central banks, which have allowed some countries to issue debt abroad. However, financial conditions are still tighter than before the pandemic and are expected to remain volatile going forward.

Risks remain elevated. The pandemic could worsen and last longer, depressing economic activity, stressing corporate balance sheets, raising poverty and inequality, and rekindling social tensions across the region. Upside surprises could also happen. Some recent high frequency indicators for advanced economies have been better than expected. Global growth could be stronger than expected, supporting exports, commodity prices, and tourism.

Policy priorities

The immediate priority for fiscal policy is to continue protecting lives and livelihoods, which given the limited fiscal space in the region, will require reprioritizing expenditure and increasing its efficiency. Policymakers will need to find creative ways to reach different segments of society, especially where informality is high. The fallout from the pandemic and associated policy response will also raise medium-term debt sustainability concerns in several countries. Commitment to a medium-term plan of fiscal consolidation and growth-enhancing structural reforms will be key to mitigate these concerns.

Monetary policy should remain accommodative given the subdued inflation outlook, negative output gaps, and elevated unemployment. Additional policy rate cuts and measures targeted to specific markets should be considered where necessary and possible, to support economic activity and ensure proper functioning of financial markets.

Measures to maintain employment relationships, such as payroll support and financing of working capital will be important to avoid the closure of otherwise viable businesses, reduce long-term unemployment, support the recovery, minimize scarring and increase potential growth . Containment and mitigation policies should be appropriately calibrated to avoid a second pandemic wave and manage localized outbreaks.


In Argentina, GDP is expected to decline by about 10 percent in 2020, with heightened risks. Growth was revised down as the longer quarantine in the Buenos Aires metropolitan area, a sharply weaker external demand and worse commodity prices should more than offset the fiscal support package, which remains constrained by limited financing options. Uncertainties related to the debt restructuring process continue to weigh on confidence.

Brazil's , real GDP is projected to fall by 9 percent in 2020 amid high uncertainty, followed by a rebound of 3.6 percent in 2021. The authorities have responded strongly to the pandemic with decisive interest rate cuts, and significant fiscal and liquidity packages, including direct cash transfers targeted to vulnerable groups. The withdrawal of this stimulus however will weigh on growth in 2021 amid a domestic economy that was still shrugging off the 2015/16 recession. In this context, accommodative monetary policy will be essential to support the cyclical recovery while resuming the government's fiscal and structural reform agenda is key to preserving fiscal sustainability and boosting potential growth and investor confidence.

In Chile, real GDP is projected to decline by 7.5 percent in 2020 and rebound by 5.0 percent in 2021. Following a resilient performance in the first quarter, economic activity is expected to contract sharply in the second quarter owing to the strict social distancing measures, and to a lesser extent, weaker external demand from trading partners. A rebound in activity is expected to start in the third quarter and continue into 2021, supported by unprecedented fiscal, monetary and financial sector measures.

Colombia took early actions to limit the spread of the virus, but economic disruptions associated with the pandemic (including lower oil prices) are expected to generate the first recession in two decades. Following a weak first quarter, GDP is expected to contract by 7.8 percent in 2020, but growth should rebound to 4.0 percent in 2021 as the health situation stabilizes at home and elsewhere. In response, the central bank has cut policy rates and supported market liquidity, while the fiscal rule was suspended for two years to provide sufficient flexibility to respond to the health and economic crises.

The outbreak fallout for Mexico is compounded by the fall in oil prices, international financial markets volatility, disruptions to global value chains, and weakening business confidence as also reflected in declining investment pre-Covid. Real GDP is expected to fall by 10.5 percent in 2020 with growth in 2021 expected to recover a modest portion of the lost output. Monetary policy is expected to loosen further to accommodate the demand shock element of the crisis and preserve the functioning of financial markets. However, the fiscal response is the smallest among G20 countries, risking a deeper contraction and slower recovery with significant economic scarring. Mexico should ramp up spending now to protect lives and livelihoods and craft a credible medium-term fiscal reform that provides more short-term policy space and close fiscal gaps.

In Peru, the growth projection for 2020 has been revised down markedly to -14 percent, as weaker external demand and a longer than expected lockdown period have so far more than offset the government's significant economic support and translated into large employment losses. With the lockdown restrictions lifted in the second semester, economic activity is expected to gradually recover, reaching a 6½ percent expansion in 2021. Downside risks remain prominent, however, and are particularly linked to domestic and global challenges in bringing the Covid-19 pandemic under control.

Central America, Panama, and the Dominican Republic (CAPDR) will experience a deep recession in 2020 and a gradual recovery starting in 2021. Growth is being affected by domestic lockdowns and global spillovers through trade, tourism, and remittances. The contraction in trade will have a particularly strong impact in Panama, El Salvador and Nicaragua, the collapse in tourism in the Dominican Republic and Costa Rica, and weaker remittances in the Northern Triangle and Nicaragua. Idiosyncratic factors are also at play, notably natural disasters in El Salvador. A palliative is that falling oil prices are improving the terms of trade.

Countries in CAPDR have mitigated the pandemic by increasing health and social spending for unemployed and vulnerable households. Where feasible, monetary policy easing and credit guarantees are supporting financing for business, and tax deferrals and specific sectoral support through the budget are aiming at relaxing liquidity constraints in some countries.

The Caribbean economies have managed to flatten the COVID-19 curve, but their key lifelines have collapsed. With tourism coming to a virtual standstill and key source markets in advanced economies plunging into deeper recession, the region is likely to experience a very sharp and protracted contraction in economic activity. Despite the reopening of borders starting in June for some Caribbean countries, international tourist arrivals are expected to return to pre-crisis levels only gradually over the next three years. In addition, the steep drop in oil prices is hurting commodity exporters through a loss in exports and fiscal revenues. The ongoing hurricane season poses additional risks.


The IMF's support

The Fund has acted swiftly to support its membership with quick and significant injections of emergency financing. Of the 70 loans approved since the pandemic began, totaling US$ 25 billion, 17 were for countries in the region, for a total of US$ 5.2 billion. Additionally, access to the Flexible Credit Line was approved for Chile and Peru and renewed for Colombia. Together with Mexico, the total backstop provided to the region through the Flexible Credit Line amounts to US$ 107 billion.

We stand ready to use the IMF's financial clout, policy advice and capacity development resources to help Latin America and the Caribbean achieve a stronger recovery.


 -- via my feedly newsfeed

Jared Bernstein: Hey, Senators! The case for extending Unemployment Insurance benefits is air tight. [feedly]

Hey, Senators! The case for extending Unemployment Insurance benefits is air tight.
http://jaredbernsteinblog.com/hey-senators-the-case-for-extending-unemployment-insurance-benefits-is-air-tight/

There's new information out this morning that should be a critical input into ongoing negotiations in the U.S. Senate. Senators are debating whether the economy needs another relief package, and, if so, what should be in it, and this morning's income report from the Bureau of Economic Analysis is virtually yelling what the answer should be.

The report shows that aggregate income—all the wages and profits and interest payments, etc. that go to U.S. households—fell by a large, but expected, 4 percent in May. More importantly, spending was up a robust 8 percent; in an economy that's 70 percent consumer spending, that's an important boost.

But how do you get falling income and higher spending? Is it higher earnings coming out of May's jobs report? Is it people spending out of their savings? There's a bit of both, as pay rose 2.5 percent in May and while the savings rate is still hugely elevated at 23 percent, that's down from April.

But the big story, one that is highly germane to the Senate's negotiations, is that consumer spending is being driven by relief payments in general, and Unemployment Insurance in particular. The figure below, by economist Jay Shambaugh, tells the story. It shows how incomes have actually gone up (the y-axis is trillions of nominal dollars), compared to pre-crisis levels, not due to higher pay, of course, but due to all the transfers, among which Unemployment Insurance is playing a particularly important role.

This focus on UI payments, especially the $600 weekly plus-up that expires at the end of next month, links direct to the Senate negotiations (the plus-up is called "Pandemic Unemployment Compensation" or PUC). Senators are said to be considering different options, but there are those who want to pull back significantly from the $600, or even let it expire, on the basis that it is disincentivizing work as states reopen for business. Such concerns might be arguable if there were enough jobs to go around. But when the unemployment rate is this high, and labor supply far surpasses labor demand, such disincentive effects simply don't bite. In fact, a careful, new study of the most recent hiring patterns "found no evidence to support the view that the temporary $600 supplement, which meant many workers received benefits higher than their wages, drove job losses or slowed rehiring substantially."

In another new study out this morning, economist Josh Bivens shows just how important PUC (and UI payments in general) are to sustaining whatever growth we've got in the current economy. To give you a sense of the magnitudes we're talking about here, Bivens first shows the unprecedented role UI benefits are playing as share of wage income.

Source: Bivens

This morning's income report showed that PUC payments alone, at an annualized rate, came to about $840 billion in May, over 4 percent of total, personal income. Biven than goes on to simulate the impact of extending PUC through the middle of next year, finding that it would increase GDP by 3.7 percent and jobs by over 5 million. Of course, those results would be sacrificed if PUC were allowed to expire. As Bivens puts it: "This estimate shows us how enormously important expanded unemployment insurance over the next year will be to aggregate demand, as new job openings are all but guaranteed to be fewer than jobless potential workers over that time, so any incentive effect in keeping workers from searching actively for work will not be the binding constraint on the economy's growth."

In fact, economist Jason Furman make precisely this point in a similar analysis from the flip side of Bivens, estimating the impact of eliminating PUC on GDP and jobs. His results, shown below, estimate that the PUC repeal would lower GDP by almost 3 percent by the end of this year, and cost millions of jobs through 2022.

Source: Furman

These are not unusual or the least bit unexpected results. With the economy still so demand constrained, due to not just the extent of coronavirus but its recent increase in "hot spots" across the country, consumers lack the confidence and employees lack the paychecks to get back to anything approaching normal levels of commerce. It doesn't matter a whit how much government officials exhort people to get out and spend. As long as there's no vaccine and we're so deeply lacking in leadership around controlling the spread of the virus, jobs, spending, and demand in general will be suppressed.

Senators, take heed! In this climate, it would be political and economic malpractice not to expand UI benefits. The data and analysis could not be clearer: people's economic circumstances and outlook are still suffering from the pandemic-induced recession and they thus still need considerable assistance as we haltingly make our way through the crisis.


 -- via my feedly newsfeed

Tim Taylor: Updating GDP: Human Capital, Nonmarket Work, Inequality, Health Care, and More [feedly]

This article by Tim Taylor touches on critical measurement issues for socialist economic theory--indeed for economic theory in general: How to account for the value of non-market labor, education, and intangibles.

Updating GDP: Human Capital, Nonmarket Work, Inequality, Health Care, and More

https://conversableeconomist.blogspot.com/2020/06/gdp-whats-next-for-government-statistics.html

No one who knows anything about gross domestic product, including economists and government statisticians, thinks it is a broad measure of social well-being. Moreover, economists at the Bureau of Economic Analysis don't want the job of coming up with a broad measure, either.  In the June 2020 issue of the Survey of Current BusinessJ. Steven Landefeld, Shaunda Villones, and Alyssa Holdren provide an essay on "GDP and Beyond: Priorities and Plans." They write: "BEA economists use market prices and volumes to measure GDP and other economic aggregates and have no special expertise in deciding the appropriate weights to combine indicators such as education and life expectancy with gross national income per capita." 

It seems sensible to me to have the government focused on collecting a wide array of statistics across a full range of economic and social indicators, and then having outsiders debate the ultimate meaning of "better off." But as Landefeld, Villones and Holdren point point out, along with a set of outside commenters, there are plenty of challenges even when just sticking to what can be measure or at least estimated based on prices and quantities. Here are some comments and thoughts on what BEA lists as its top priorities moving forward. 

Human Capital

We have known for a long time that investments in education, skills, and experience lead to greater "human capital" which pays off for the economy as a whole. But when we discuss "investment" as a part of GDP, we remain focused on purchases by firms of plant, equipment, and software along with intangible investment from corporate R&D. Landefeld, Villones and Holdren mention one striking estimate that one estimate comparing the accumulated stock of human capital with the accumulated stock of physical capital, the stock of human capital may be worth 16 times as much. 
But there's a real challenge here in measuring human capital investment. It can be estimated in various ways, which don't agree. In addition, it seems  plausible me that human capital in the form of education is a mixture of a consumption good and an investment good, which complicates matters further. Here's one of the outside comments from Lisa Lynch:
There are three main approaches for measuring human capital investment for the purpose of national accounts: Kendrick's (1976) Cost-based approach; the Lifetime income approach as developed by Jorgenson and Fraumeni (1989 and on); and the Indicators approach as detailed by the OECD 2011 (and updated every two years since), and Barro and Lee 2013. Measuring investment in human capital based on costs typically includes spending on schools, employee training costs, opportunity cost of time acquiring human capital, and a range of expenditures on others items such as libraries, radio, TV, books and other items having human capital value. The Jorgenson-Fraumeni (J-F) Lifetime income stream focuses on the present value of the return to formal education only. Finally, the Indicators approach pulls together a range of metrics such as adult literacy, school enrollments rate, average years of schooling, and the percentage of highly qualified workers to capture differences across countries and time in human capital investment.

In principal the Cost-based and Lifetime income approaches should produce values equal to each other. In practice they do not. The Lifetime-income approach produces estimates of investments in human capital 6 to almost 10 times greater than the Cost-Based approach. ... 
Household production

A standard concern about GDP is that it doesn't measure household production that is not sold on the market, and standard estimates are that including estimates of the value of household production would raise GDP by about one-quarter.  But unpaid economic output purely for household production is only the start of the issues here. What about tasks like elder care, volunteering, and pumping your own gas or bagging your own groceries? Here's another comment from Lisa Lynch
While there has been significant work done by the BEA to develop a satellite account for household production I would urge the BEA to add additional non-labor market activities that take place outside the home but meet the threshold of "Would someone pay another person (a "third person" from outside the home) to perform the activity?" The first such activity is elder care. We know from the American Time Use Survey (2014–15) that approximately 16.2% of the U.S. population provides eldercare—unpaid care for someone over the age of 65 with a condition related to aging. Almost all of this care takes place outside the home and on an "average" day, 26 percent of unpaid eldercare providers spend an average of 3 hours in eldercare activities. With an aging population this is a growing dimension of household production that should receive increasing attention in household satellite accounts.

A second area of non-labor market work that is not captured in our satellite accounts is volunteering. From the 2015 American Time Use Survey we learn that 9% of those over age 64 volunteer on an average day. For all those volunteers over age 25 they spent an average of 2.25 hours in this activity. Examples of volunteering include administrative and support activities, social service and care activities, and indoor and outdoor maintenance, building, and clean‐up activities. While not all aspects of volunteering may meet the standard of paying another person for this work, much of it would.

A third area of non-labor market work includes the "free labor" facilitated by IT. Examples of this include ATM bank transactions, self-service work of pumping gas and bagging groceries, online airline ticket purchase and check-in, "self-service" baggage tagging/drop, self-service keyless check-in and checkout at hotels, and ordering, paying and self-pickup of meals. None of these economic activities are captured in our national accounts today even though we still have employees who are paid to do this work.
Distribution of Income

When thinking about growth of the overall economy as measured by GDP, and evaluating its costs and benefits, it seems useful to know what distribution of income is happening as well. But measuring income distribution in a way that links up directly to GDP is harder than it may sound at first. It's common for measures of income distribution to focus on personal income, using either survey data or administrative data (like tax returns). But such measures are mostly limited to personal income, which is only about half of GDP. Could measures of distribution be linked to overall GDP? In his comment, Angus Deaton sounds a cautionary note about this agenda: 
Piketty, Saez and Zucman (PSZ) have done a great service by calculating a set of distributionally disaggregated national accounts for the United States. The basic idea is irresistible. Yet these first attempts have raised many serious difficulties that were not apparent at first. Most immediately, only about half of national income appears on individual tax returns. Allocating from tax returns is hard enough, because tax units are neither individuals nor households, but allocating the other half of national income is an immensely more difficult task, requiring assumptions that are rarely well supported by evidence, and often seem arbitrary. Because distribution is such a controversial topic, these assumptions leave plenty of scope for politically-biased challenges, in which each commentator can choose their own alternatives and get almost any result they choose, inequality is increasing, inequality is not increasing, and everything in between. It is surely not good practice for statistical offices, as opposed to researchers, to have to make such deeply controversial choices. My own preference would be to give up on the bigger task of measuring the distribution of national income, and to stick to the feasible, but still difficult, challenge of allocating personal income, both before and after taxes and benefits.
Health Care

The usual idea of measuring GDP is to look at a product, and then to measure the price times the quantity produced. For products like steel or oil or cars or pizzas or haircuts, this works pretty well. But health care is an ever-evolving mixture of inputs, and the specific output that is being purchases is hard to measure.  Thus, a standard way of measuring "output" in health care has been to look at total spending on healthcare--which is of course a measure of inputs, not of outputs like reducing cases or morbidity or deaths from diabetes or cancer. Health care expenditures are a huge and growing, headed for one-fifth of all GDP. But there is often some skepticism over whether the rise in health care spending as a share of GDP represents a rise in outputs--like improved health. In his comment, Angus Deaton puts the point with some force: 
The American healthcare system poses one of the most serious challenges to national income measurement, and plays into its well-known weaknesses. Like other services, it is measured, not by its output in terms of its contribution to health, but by its inputs, such as the number of procedures, doctor visits, or prescriptions sold. I do not know how to do better than this, but I do know that these numbers, currently about 18 percent of GDP, vastly overstate any imaginable output measure. Americans have lower life expectancy and higher morbidity than do other rich countries, who spend much less. To take a concrete example, Switzerland, which has the world's second most expensive healthcare system, spends only 12 percent of its GDP. So one measure of the value of the output of American healthcare is 12 percent of American GDP, which would mean that the sector has negative value added of a trillion dollars a year; to balance the accounts, this trillion dollars would show up as poll tax on consumers, $8,700 per head, which is being transferred as a tribute, or ransom, from consumers to healthcare providers. Of course, I am not suggesting that the BEA adopt this calculation, but it illustrates the dangers of not having a measure of output and of accepting valuation at cost.
The paper and comments raise a variety of other issues.  Those who want still more detail might head for a "Symposium: Are Measures of Economic Growth Biased?" in the Spring 2017 issue of the Journal of Economic Perspectives (where I work as Managing Editor): 

 -- via my feedly newsfeed

Expanded unemployment insurance continues to be a crucial lifeline for millions of workers: See updated state unemployment data [feedly]

Expanded unemployment insurance continues to be a crucial lifeline for millions of workers: See updated state unemployment data
https://www.epi.org/blog/expanded-unemployment-insurance-continues-to-be-a-crucial-lifeline-for-millions-of-workers-see-updated-state-unemployment-data/

The U.S. Department of Labor (DOL) released the most recent unemployment insurance (UI) claims data yesterday, showing that another 1.5 million people filed for regular UI benefits last week (not seasonally adjusted) and 0.7 million for Pandemic Unemployment Assistance (PUA), the new program for workers who aren't eligible for regular UI, such as gig workers. As we look at the aggregate measures of economic harm, it is important to remember that this recession is deepening racial inequalities. Black communities are suffering more from this pandemic—both physically and economically—as a result of, and in addition to, systemic racism and violence. Both Black and Hispanic workers are more likely than white workers to be worried about exposure to coronavirus at work and bringing it home to their families. These communities, and Black women in particular, should be centered in policy solutions.

As of last week, more than one in five people in the workforce are either receiving or have recently applied for unemployment benefits—regular or PUA. These benefits are a critical lifeline that help workers make ends meet while practicing the necessary social distancing to stop the spread of coronavirus. In fact, the $600 increase in weekly UI benefits was likely the most effective measure in the CARES Act for insulating workers from economic harm and jumpstarting an eventual economic rebound, and it should be extended past July.

To be clear, our top priority right now should be protecting the health and safety of workers and our broader communities. To accomplish this, we should be paying workers to stay home when possible, whether that means working from home some or all of the time, using paid leave, or claiming UI benefits. When workers are providing absolutely essential services, they must have access to adequate personal protective equipment (PPE) and paid sick leave.

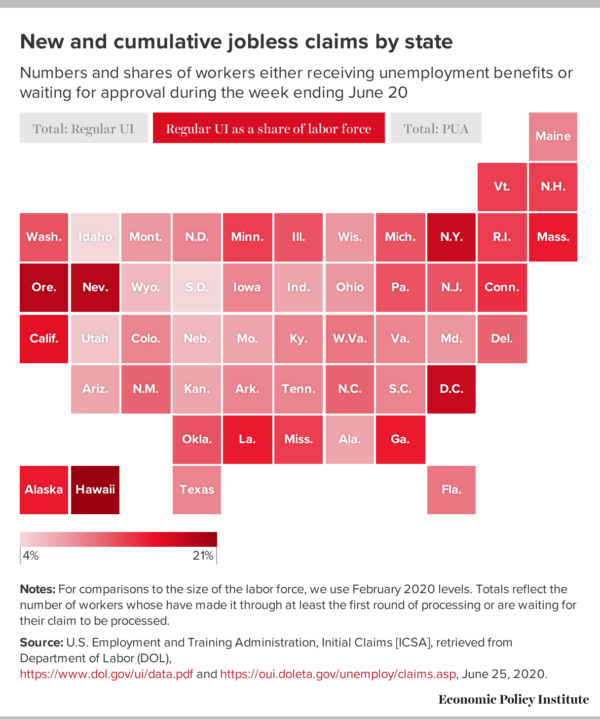
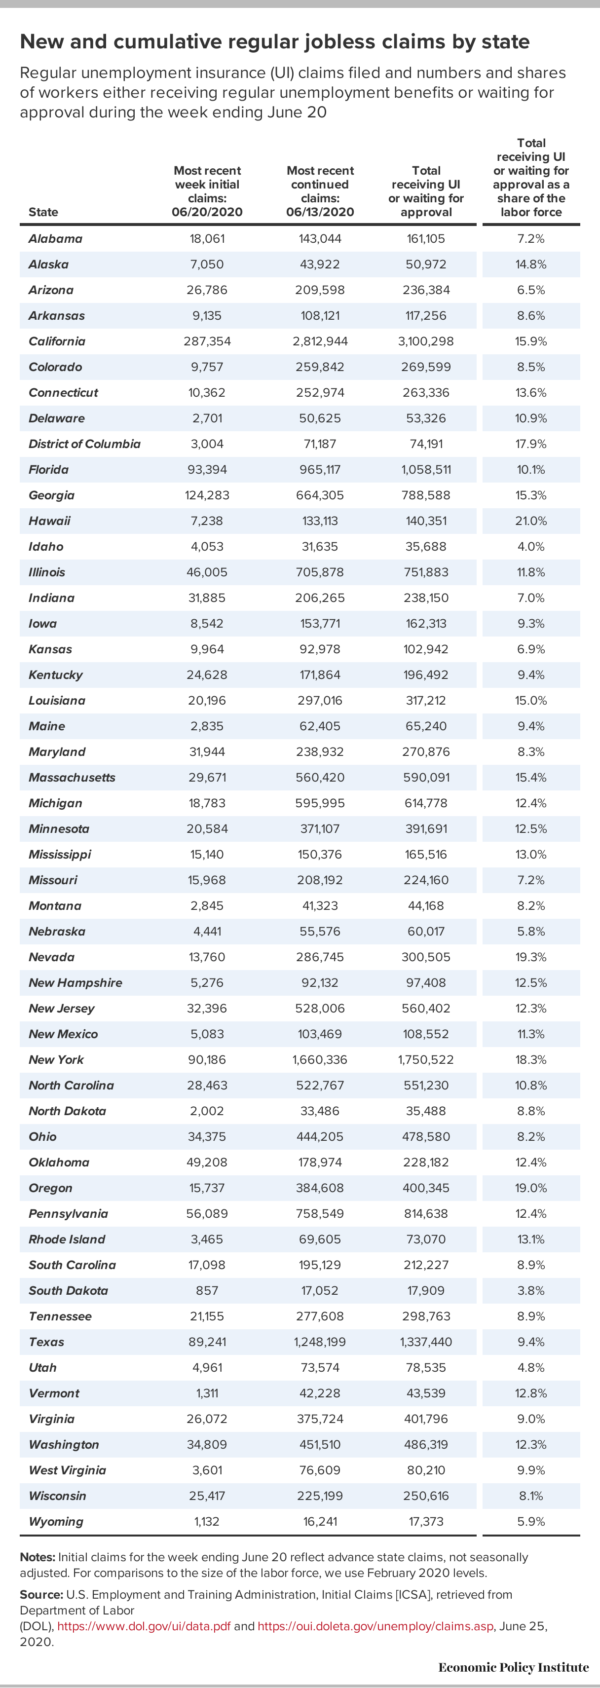
Figure A and Table 1 show the total number of workers who either made it through at least the first round of regular state UI processing as of June 13 (these are known as "continued" claims) or filed initial regular UI claims during the week of June 20. Four states had more than one million workers either receiving regular UI benefits or waiting for their claim to be approved: California (3.1 million), New York (1.8 million), Texas (1.3 million), and Florida (1.1 million). Nineteen additional states had more than a quarter million workers receiving or awaiting benefits.

While the largest U.S. states unsurprisingly have the highest numbers of UI claimants, some smaller states have larger shares of the workforce filing for unemployment. Figure A and Table 1 also show the numbers of workers in each state who are receiving or waiting for regular UI benefits as a share of the February 2020 labor force. We use February as a baseline since it predates the effects of the pandemic on the labor market. In nine states and the District of Columbia, more than one in seven workers are receiving regular UI benefits or waiting on their claim to be approved: Hawaii (21.0%), Nevada (19.3%), Oregon (19.0%), New York (18.3%), District of Columbia (17.9%), California (15.9%), Massachusetts (15.4%), Georgia (15.3%), Louisiana (15.0%), and Alaska (14.8%).

Figure A

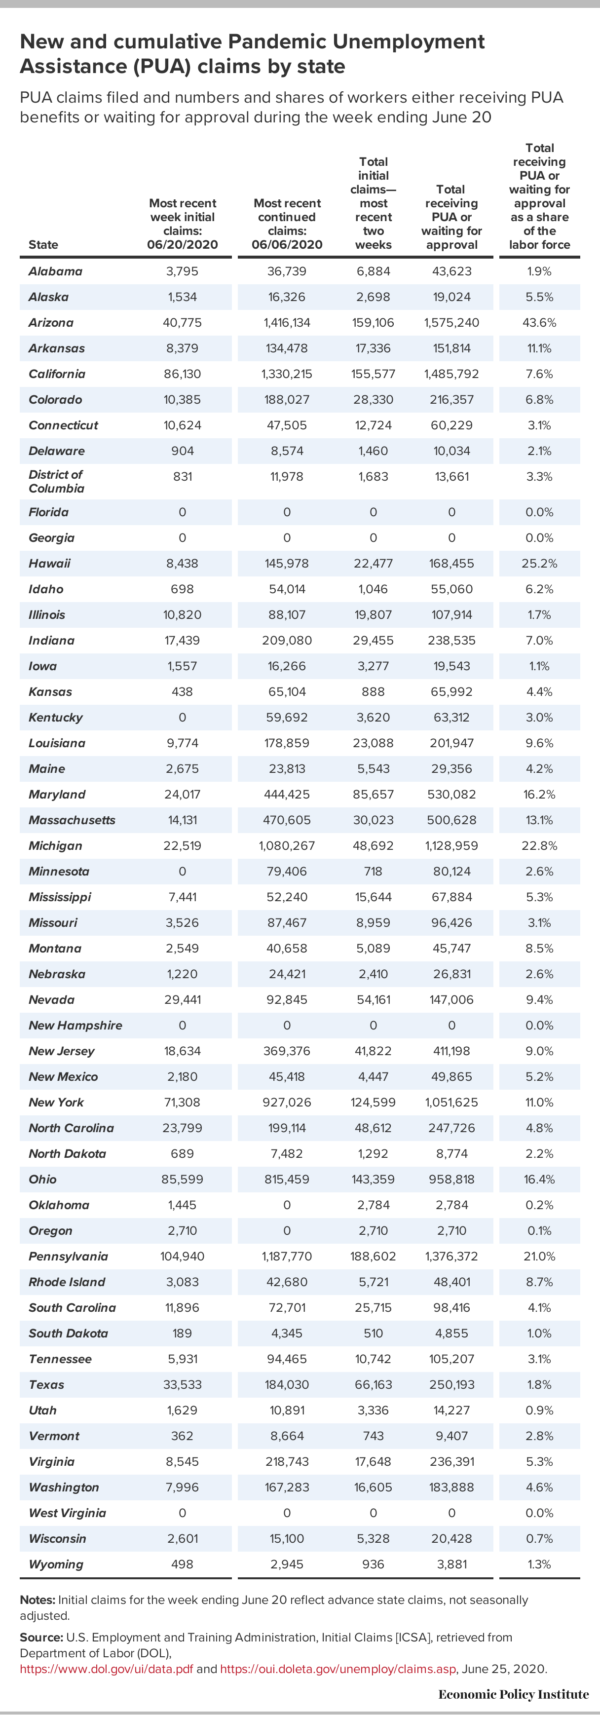
Figure A and Table 2 show the total number of workers who either made it through at least the first round of PUA processing—the new federal program that extends unemployment compensation to workers who are not eligible for regular UI but are out of work due to the pandemic—by June 6 or filed initial PUA claims during the weeks of June 13 or June 20. We do not sum the PUA claims with regular UI claims because some states have misreported PUA claims in their initial claims data, leading to potential double counting.1

As of last week, DOL reported that over 12 million workers across 46 states and the District of Columbia are receiving or waiting on a decision for PUA benefits, which underscores the importance of extending benefits to those who would otherwise not have been eligible. Five states have at least a million workers in this category: Arizona (1.6 million), California (1.5 million), Pennsylvania (1.4 million), Michigan (1.1 million), and New York (1.1 million). Four states still have not reported any PUA claims: Florida, Georgia, New Hampshire, and West Virginia.

To mitigate the economic harm to workers, Congress should pass another federal relief and recovery package that includes worker protections, investments in our democracy, resources for coronavirus testing and contact tracing (which is necessary to reopen the economy), and an extension of the across-the-board $600 increase in weekly unemployment benefits well past its expiration at the end of July.

The package should also include substantial aid to state and local governments, so that they can invest in the services that will allow the economy to recover, particularly public health and education. Without this aid, a prolonged depression is inevitable and 5.3 million workers would likely lose their jobs by the end of 2021, especially if state and local governments make the same budget and employmentcuts that slowed the recovery after the Great Recession. At the same time, policymakers should prioritize long-overdue overhauls of federal labor law and continue to strengthen wage standards that protect workers and help boost consumer demand.

1. Unless otherwise noted, the numbers in this blog post are the ones reported by the U.S. Department of Labor (DOL), which they receive from the state agencies that administer UI. While DOL is asking states to report regular UI claims and PUA claims separately, many states are also including some or all PUA claimants in their reported regular UI claims. As state agencies work to get these new programs up and running, there will likely continue to be some misreporting. Since the number of UI claims is one of the most up-to-date measures of labor market weakness and access to benefits, we will still be analyzing it each week as reported by DOL, but we ask that you keep these caveats in mind when interpreting the data.

Table 1
Table 2

 -- via my feedly newsfeed

Saturday, June 27, 2020

Enlighten Radio:Jazz Divas: Saturday Enlighten Radio

The Red Caboose has sent you a link to a blog:


Blog: Enlighten Radio
Post: Jazz Divas: Saturday Enlighten Radio
Link: https://www.enlightenradio.org/2020/06/jazz-divas-saturday-enlighten-radio.html

--
Powered by Blogger
https://www.blogger.com/

Thursday, June 25, 2020

IMF:Financial Conditions Have Eased, but Insolvencies Loom Large [feedly]

On balance, a pessimistic outlook from the IMF

Financial Conditions Have Eased, but Insolvencies Loom Large

https://blogs.imf.org/2020/06/25/financial-conditions-have-eased-but-insolvencies-loom-large/

By Tobias Adrian and Fabio Natalucci

Amid the human tragedy and economic recession caused by the COVID-19 pandemic, the recent surge in risk appetite in financial markets has caught analysts' attention. After sharp declines in February and March, equity markets have rallied back, in some cases to close to their January levels, while credit spreads have narrowed significantly, even for riskier investments. This has created an apparent disconnect between financial markets and economic prospects. Investors seem to be betting that lasting strong support from central banks will sustain a quick recovery even as economic data point to a deeper-than-expected downturn, as shown in the June 2020 World Economic Outlook Update.

Tug of war

In the newest Global Financial Stability Update, we analyze the tug of war between the real economy and financial markets and the risks involved. With huge uncertainties about economic outlook and investors highly sensitive to COVID-19 developments, pre-existing financial vulnerabilities are being exposed by the pandemic. Debt levels are rising, and potential credit losses resulting from insolvencies could test bank resilience in some countries. Some emerging market and frontier economies are facing refinancing risks, and lower-rated countries have started to regain access to markets only slowly.

Major central banks around the world have contributed to the substantial easing of financial conditions via interest rate cuts and a balance sheet expansion of over $6 trillion, including asset purchases, FX swap lines, and credit & liquidity facilities. These swift and unprecedented actions by central banks have restored confidence and boosted investor risk taking, including in emerging markets, where asset purchases have been deployed for the first time. Risky asset prices have rebounded since the precipitous fall early in the year, while benchmark interest rates have fallen. With the easing of global financial conditions, risk appetite has retuned also to emerging markets. Aggregate portfolio outflows have stabilized, and some countries have experienced some modest inflows again. In credit markets, spreads of investment-grade companies in advanced economies are currently quite contained, contrary to the sharp widening seen during previous large economic shocks. Spreads have also narrowed significantly in emerging countries, albeit less so in frontier markets. On net, financial stability risks in the short term are little changed since the last Global Financial Stability Report, as prompt and bold actions by policymakers have helped cushion the impact of the pandemic on the global economic outlook.

A disconnect has emerged

The disconnect between financial markets and the real economy can be illustrated by the recent decoupling between the soaring U.S. equity markets and plunging consumer confidence (two indicators that have historically trended together), raising questions about the rally's sustainability if not for the boost provided by central banks.

This divergence raises the specter of another correction in risk asset prices should investors' attitude change, posing a threat to the recovery. So-called bear equity market rallies have occurred in the past during periods of significant economic pressures, only to unwind swiftly.

What triggers?

A number of developments could trigger a decline in risk assets' prices. The recession could be deeper and longer than currently anticipated by investors. There could be a second wave of infections, with ensuing containment measures. Geopolitical tensions or broadening social unrest in response to rising global inequality could lead to a reversal in investor sentiment. Finally, expectations about the extent of central banks' support could turn out to be too optimistic, leading investors to reassess their appetite and pricing of risk.

Such a repricing, especially if amplified by financial vulnerabilities, could result in a sharp tightening in financial conditions, thus constraining the flow of credit to the economy. Financial stress could worsen an already unprecedented economic recession, making a recovery even more challenging.

Pre-existing vulnerabilities

Pre-existing financial vulnerabilities are being laid bare by the pandemic. First, in advanced and emerging market economies alike, corporate and household debt burdens could become unmanageable in a severe economic contraction. Aggregate corporate debt has been rising over several years, and it now stands at historically high levels relative to GDP. Household debt has also increased in many economies, some of which now face an extremely sharp economic slowdown. The deterioration in economic fundamentals has already led to a corporate ratings downgrade, and there is a risk of a broader impact on the solvency of companies and households.

Second, the realization of credit events will test the resilience of the banking sector as they assess how governments' support for households and companies translates into borrowers repaying their loans. Some banks have started to prepare for this process, and expectation of further pressure on their profitability is reflected in the declining prices of their stocks.

Third, nonbank financial companies could also be affected. These entities now play a greater role in the financial system than before. But since their appetite for continuing to provide credit during a deep downturn is untested, they could end up being an amplifier of stress. For example, a sharp correction in asset prices could lead to large outflows in investment funds (as seen early in the year), possibly triggering fire sales of assets.

Fourth, while conditions have eased in general, risks remain for some emerging and frontier markets that face more urgent refinancing needs. Their debts' rollover will be more costly should financial conditions suddenly tighten. Some of these countries also have low levels of reserves, making it harder to manage portfolio outflows. Credit-rating downgrades could worsen this dynamic.

Mind the trade-offs

Countries need to strike the right balance between competing priorities in their response to the pandemic, being mindful of the trade-offs and implications of continuing to support the economy while preserving financial stability.

The unprecedented use of unconventional tools has undoubtedly cushioned the pandemic's blow to the global economy and lessened the immediate danger to the global financial system—the intended objective of policy actions. However, policymakers need to be attentive to possible unintended consequences, such as a continued buildup of financial vulnerabilities in an environment of easy financial conditions. The expectation of continued support from central banks could turn already stretched asset valuations into vulnerabilities—particularly in a context of financial systems and corporate sectors that are depleting their buffers during the pandemic. Once the recovery is underway, policymakers should urgently address vulnerabilities that could sow the seeds of future problems and put growth at risk down the road.


 -- via my feedly newsfeed