Saturday, June 20, 2020

Reconsidering progress this Juneteenth: Eight graphics that underscore the economic racial inequality Black Americans face in the United States [feedly]

Reconsidering progress this Juneteenth: Eight graphics that underscore the economic racial inequality Black Americans face in the United States
https://equitablegrowth.org/reconsidering-progress-this-juneteenth-eight-graphics-that-underscore-the-economic-racial-inequality-black-americans-face-in-the-united-states/

While Juneteenth marks a day of resilience, endurance, and emancipation for Black Americans, this year's anniversary is also a harsh reminder of the delayed freedom granted in 1865. For many, there is a renewed interest in the day traditionally meant to celebrate freedom, as the country grapples with two viruses eating away at the nation—COVID-19 and White supremacy—both of which underscore the nation's longstanding history of institutional racism and racial inequality.

This year's 155th anniversary comes at a time marked by global unrest and protests against systemic racism and police brutality that led to the deaths of George FloydBreonna TaylorAhmaud ArberyRayshard Brooks, and countless other Black Americans. This same level of disparate impact can be seen in national coronavirus data, which show Black Americans losing their jobs and dying at nearly three times the rate of White Americans. 

The economic disparities between Black and White Americans are prolonged and profound. In observance of Juneteenth, the Washington Center for Equitable Growth is reflecting on the perceived progress made in the lives of Black Americans and highlighting evidenced-backed policy solutions needed to reduce economic racial inequality.

Eight graphics on wages, wealth, and health

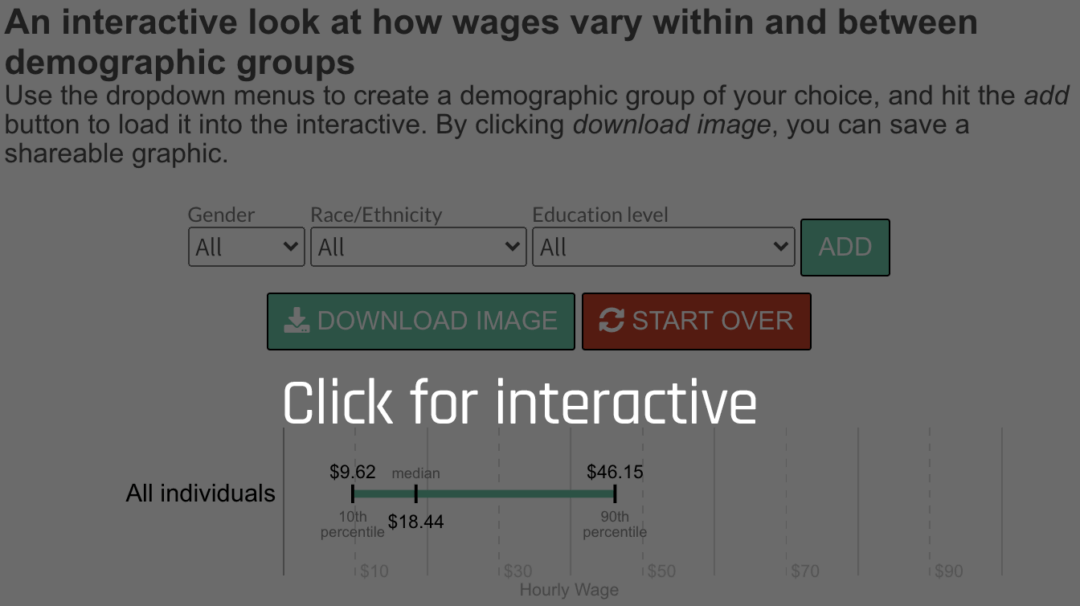
Black workers, especially Black female workers, have lower salaries than White workers with similar levels of education. While the median White male worker with a college degree earns $31.25 an hour, the median Black male worker with a college degree only earns only $23.08. This is only $5 more than a White male worker with a high school degree. Some of this wage gap is due to occupational segregation, but the majority of it is "unexplained" and is attributed to discrimination. (See Interactive.)
Black Americans also experience a disparity in intergenerational mobility, or the relationship between their income as an adult and their parents' income at a similar age. While Latinx and Asian Americans have intergenerational mobility rates converging with those of White Americans, Black and Native Americans do not. One reason for this is that even when raised in high-income families, Black children are far more likely to experience downward mobility. (See Figure 1.)

Figure 1
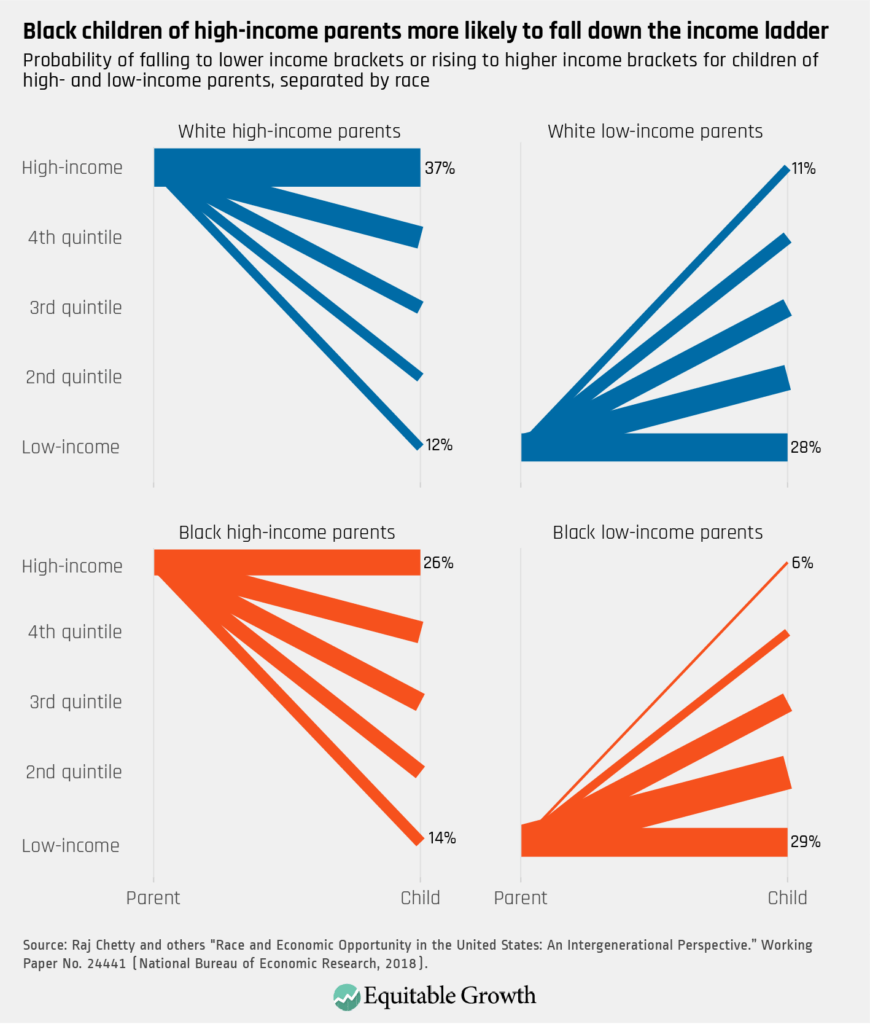
The role of the U.S. criminal justice system in driving downward mobility for Black Americans is strongly hinted at in this research. More research is clearly needed to further our understanding of the economic consequences of our racist criminal justice system.

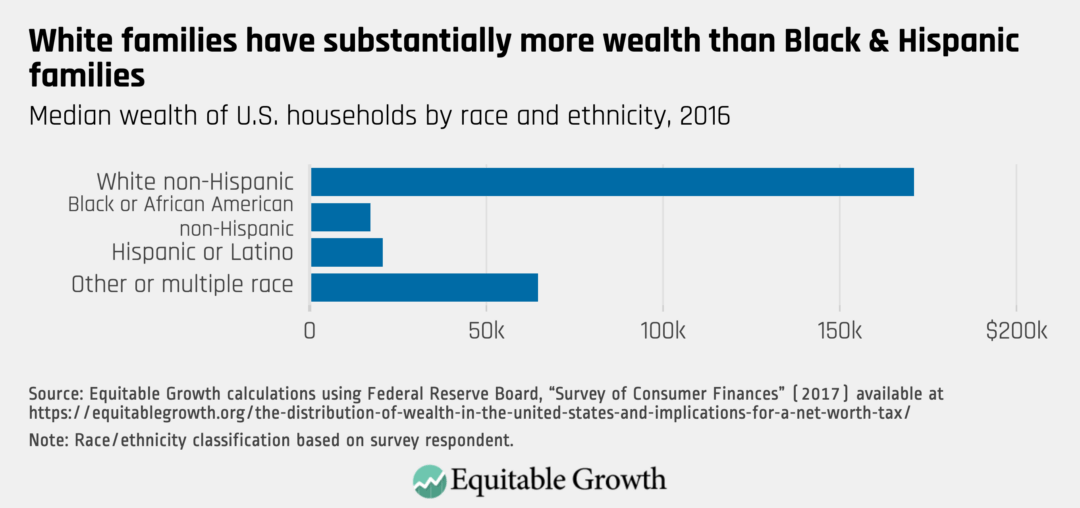
The Black-White racial wealth divide is even larger than the Black-White income gap. White families have median wealth of $171,000 while Black families have median wealth of only $17,600. Differences in income or education cannot explain this wealth divide between White and Black American families—the net worth of Black families in the top income quintile is only $262,800, which is barely more than half that of White families in the top income quintile. (See Figure 2.)

Figure 2
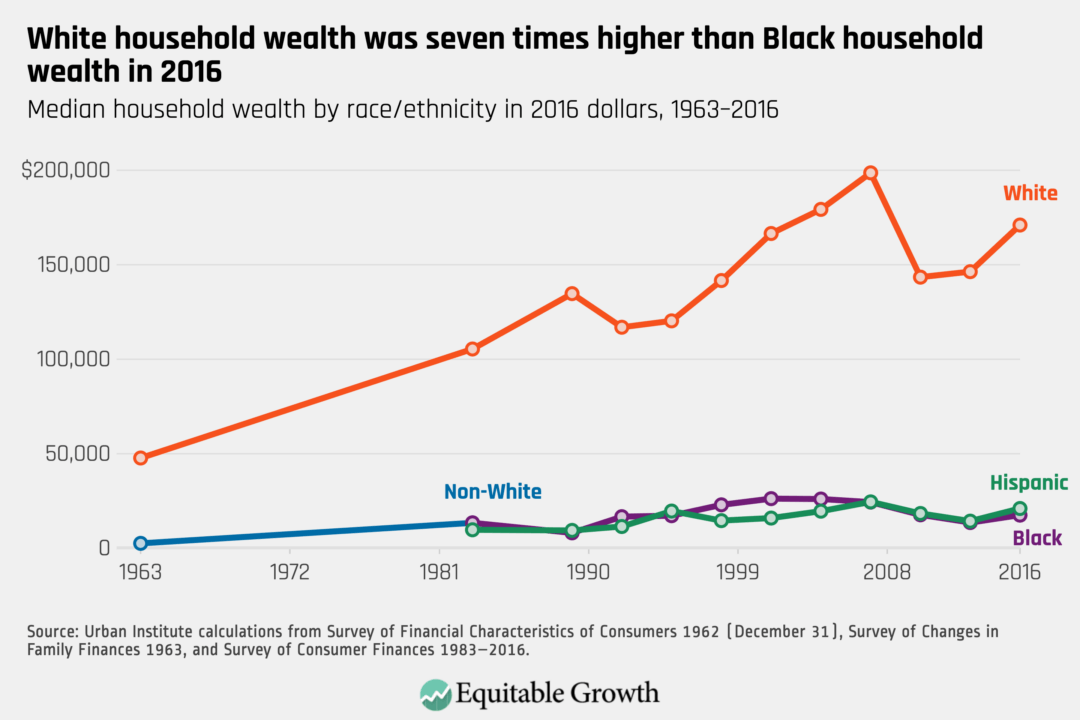
The Black-White racial wealth divide has not decreased over time, despite Black Americans' education and income levels improving over time. This again belies arguments that the economic racial inequality that Black Americans experience is due to differences in skills rewarded by the marketplace. (See Figure 3.)

Figure 3
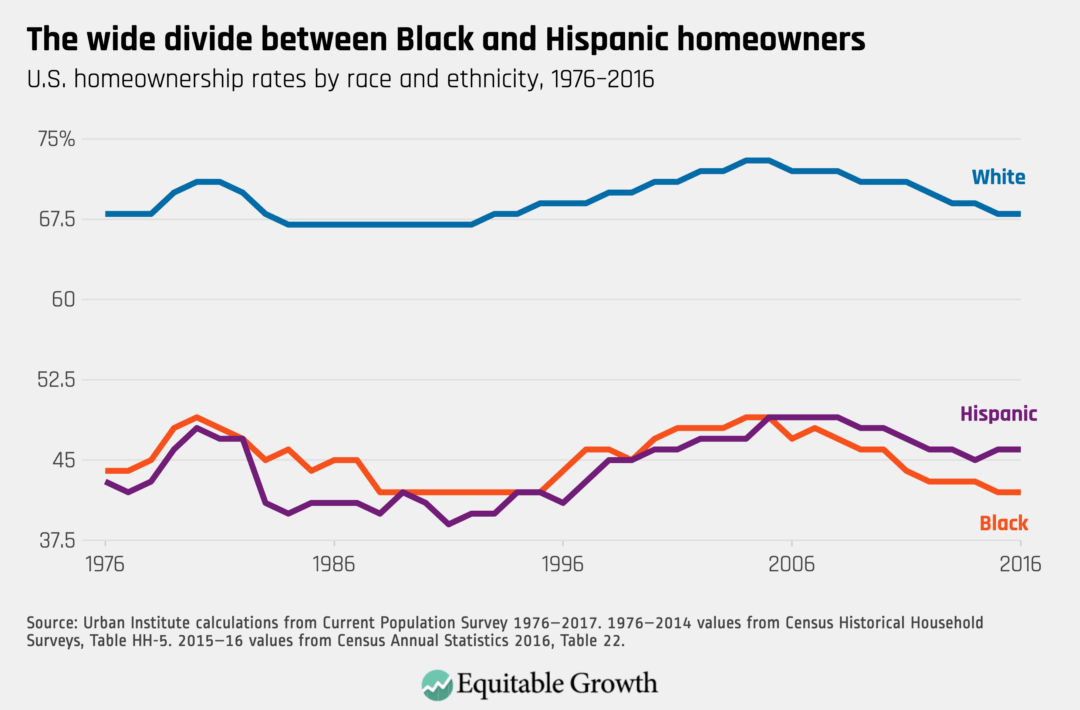
One major contributor to the Black-White racial wealth divide is the systemic policy support for White homeownership and systematic barring of Black homeownership through federal policies that created redlining and the modern mortgage market in the 1930s. These policies have had lingering effects for decades, and despite the Fair Housing Act of 1968 legally barring discrimination in housing, Black homeownership rates have not meaningfully changed. They were further worsened during the mid-2000s housing bubble, when banks gave Black borrowers subprime mortgages even when they had better credit scores than White borrowers. (See Figure 4.)

Figure 4
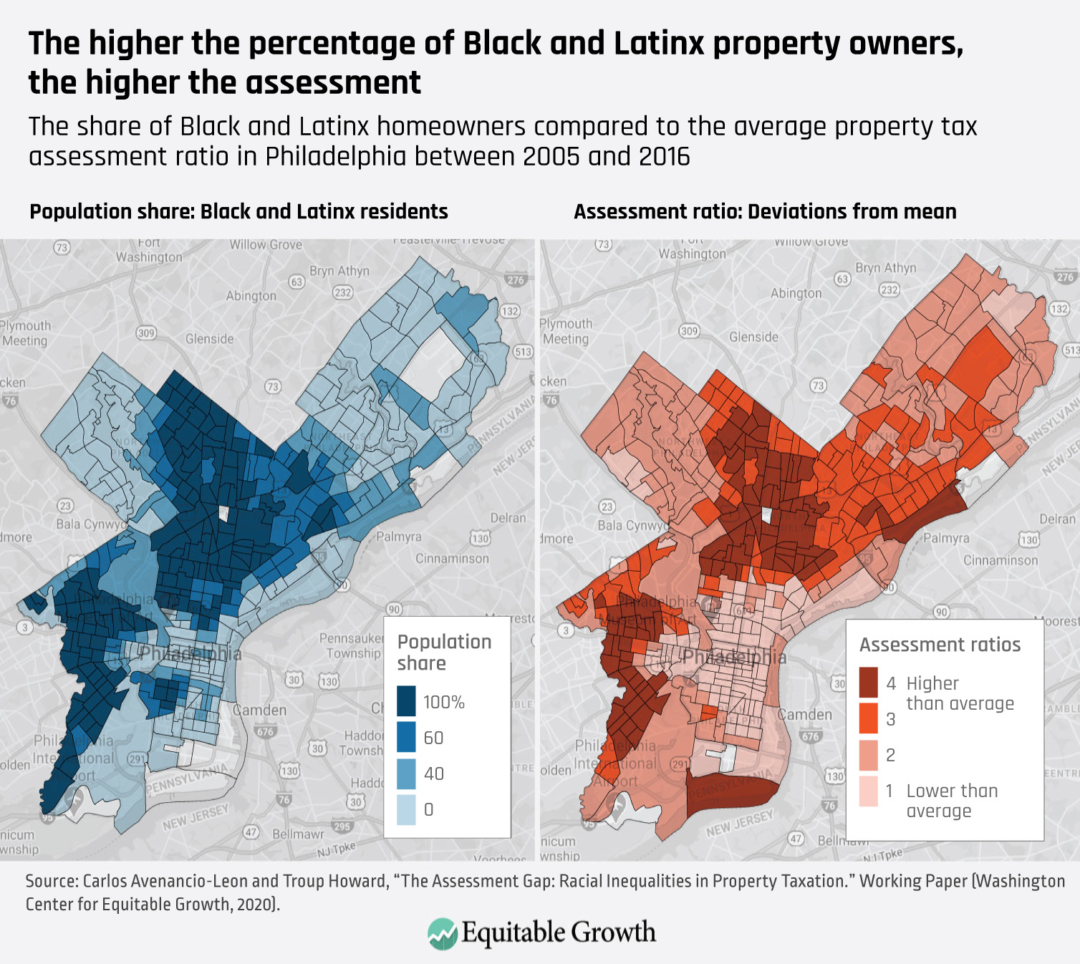
In addition, even when able to purchase homes, Black and Latinx homeowners face higher property tax burdens. New research from Carlos Avenancio-León of Indiana University Bloomington and Troup Howard of the University of California, Berkeley found that even within regions where every homeowner theoretically faces the same rate of taxation, Black and Latinx homeowners nonetheless end up paying a 10 percent to 13 percent higher tax rate, on average, within the same local property tax jurisdiction. (See Map.)
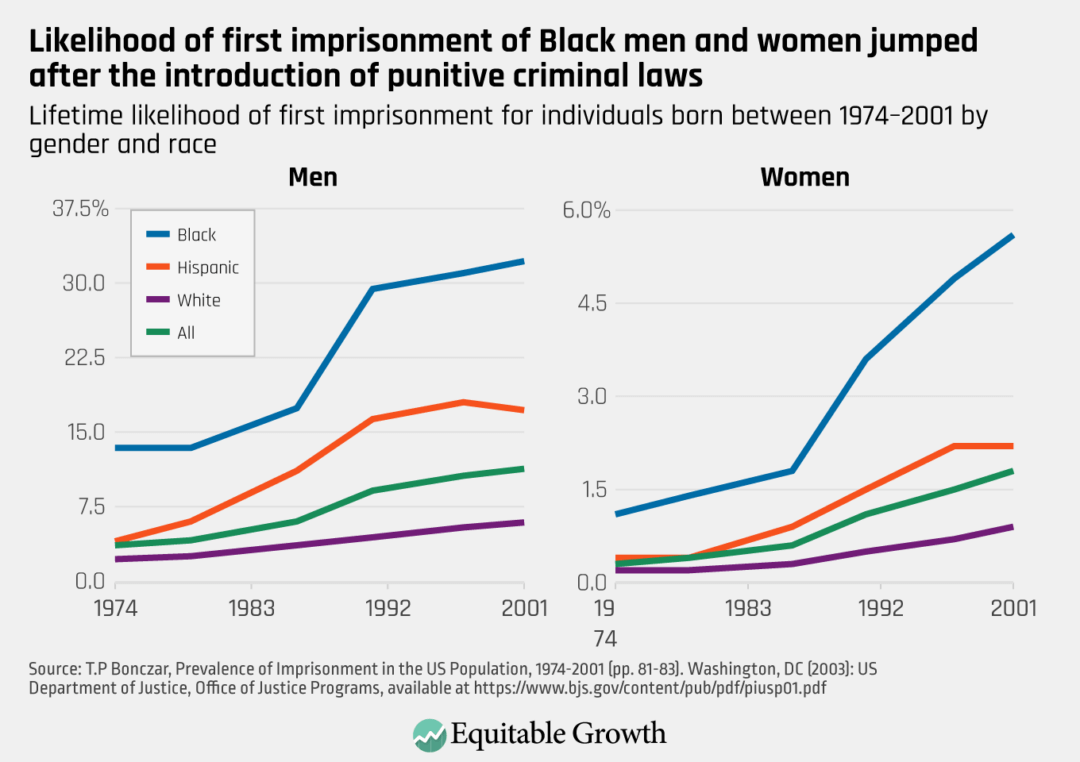
An issue in its own right, the disproportionate incarceration of Black people is also a contributing factor to economic racial inequality. Time served is time away from the labor market, detrimental to finding and keeping future employment, and penalizes even those found innocent through administrative fines and fees. The dramatic increase in incarceration over recent decades has not been driven by increases in crime but rather by a shift to more punitive sentencing regimes that disproportionately fall on Black and Latinx communities. (See Figure 5.)

Figure 5
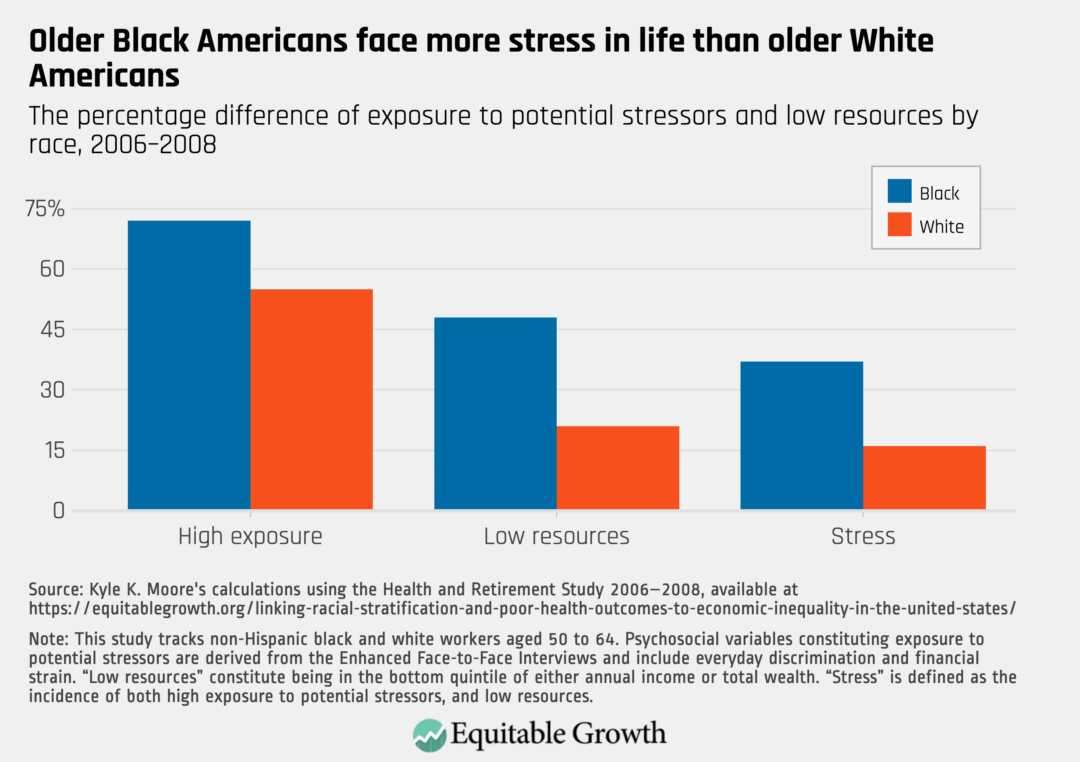
The health disparities that Black Americans experience in conditions such as hypertension and inflammation are an example of the limits of an economic framework for understanding racial disparities. Even at similar levels of income and education, Black Americans experience worse health outcomes. One reason is the discrimination and racism experienced daily by Black Americans, which exacts a physical toll that increases the incidence of these types of conditions. (See Figure 6.)

Figure 6
Higher incidence of these types of conditions is already a matter of public health justice. But when paired with the novel coronavirus that turns these pre-existing conditions into acute vulnerabilities, it becomes especially so. Layer on top of this the disproportionate representation of Black workers in jobs where they're exposed to the coronavirus, the housing they're constrained to because of the ongoing legacy of redlining and other discriminatory mortgage lending practices, and other structural inequalities, and there now is a perfect storm for a global health pandemic to vastly disproportionately impact Black communities.

Policy solutions

The economic racial inequality facing Black Americans has not improved over time despite rising education levels and a growing national economy. That is because economic racial inequality is due to intentional public policies of discriminationsegregation, and incarceration. Therefore, only structural economic change will be sufficient to address economic racial inequality.

"There comes a time when the cup of endurance runs over, and men are no longer willing to be plunged into the abyss of despair."

Martin Luther King Jr.

One group of policy solutions to consider focus on wealth building. Policies that simply ensure workers are being paid fairly and equitably the money they earn is an easy place to start. Possible suggestions include sufficiently funding the Equal Employment Opportunity Commission so it can enforce existing anti-discrimination labor laws and prosecute wage theft, and eliminating the tipped minimum wage, which is racist in origin and was supported along starkly racial lines here in Washington, D.C. 

Policies that address the racist differences in credit options—such as postal banking, as recommended by Washington Center for Equitable Growth board member and UC Irvine law professor Mehrsa Baradaran—and reforms to the Community Reinvestment Act are another group. Addressing student debt, which disproportionately burdens Black students as a consequence of the Black-White wealth divide, will also be necessary, either through a progressive approach or even outright cancellation. But, ultimately, centuries of enslavement, institutionalized violence, purposeful exclusion from the White wealth-building policies of the New Deal, and ongoing labor market discrimination—all of which have contributed to the Black-White wealth gap—call for a reparations program on a scale sufficient to address the problem.

Another group of policy solutions focused on addressing the racism of the U.S. criminal justice system would also serve to redirect taxpayer dollars toward public investments that improve economic growth and mobility for Black Americans. Defunding the police would redirect public funds from policing to education, social services, and other pro-social public goods that will boost intergenerational mobility. This would merely reverse the policy choices many cities made decades ago, as Black migrants from the South moved to northern cities as part of the Great Migration, with those cities responding by decreasing public expenditures—except on policing.

We need to enact policies that begin to eradicate economic racial inequality as soon as possible. While our nation made some progress toward making the U.S. economy and society much more equitable since enslaved Black Americans gained their freedom in 1865, the legacy of Jim Crow and the continuing economic racial discrimination so evident in the graphics above shows how much further we have to go. Downward mobility is on the rise, racist policies have not been eradicated, and the racial wealth divide is not only not closing but rather is increasing. It is abundantly clear that we still have much work to do.

A few suggestions on individual scholars to follow for in-depth reading on these issues:

Olubenga Ajilore, senior economist, Center for American Progress

Algernon Austin, senior researcher, NAACP Legal Defense Fund

Carlos Avenancio, assistant professor of financeIndiana University Bloomington

Nina Banks, associate professor of economics, Bucknell University

Mehrsa Baradaran, professor of law, University of California, Irvine School of Law

Peter Blair, assistant professor of education, Harvard Graduate School of Education

Lisa Cook, professor, Michigan State University

Robynn Cox, assistant professor of social work, University of Southern California

William Darity, Jr., Samuel DuBois Cook professor of public policy, African and African American studies, and economics, and the director of the Samuel DuBois Cook Center on Social Equity at Duke University

Ellora Derenoncourt, incoming assistant professor, University of California, Berkeley

Dania Francis, assistant professor of economics, University of Massachusetts, Boston

Darrick Hamilton, executive director of the Kirwan Institute for the Study of Race and Ethnicity, Ohio State University

Bradley Hardy, associate professor, American University

Kilolo Kijakazi, institute fellow, Urban Institute

Trevon Logan, Hazel C. Youngberg Trustees distinguished professor of economics, Ohio State University

Kyle Moore, senior policy analyst, U.S. Congress Joint Economic Committee

Anna Gifty Opoku-Agyeman, co-founder and CEO, the Sadie Collective

Mark Paul, assistant professor of economics, New College of Florida

William E. Spriggs, chief economist, AFL-CIO

Fanta Traore, co-Founder and COO, the Sadie Collective

Valerie Wilson, director, program on race, ethnicity, and the economy, Economic Policy Institute

Jhacova Williams, economist, Economic Policy Institute

Naomi Zewde, assistant professor, Graduate School of Public Health and Health Policy, City University of New York (CUNY) Hunter College


 -- via my feedly newsfeed

Tim Taylor: The Productivity Race: US vs. Germany vs. Japan [feedly]

Tim Taylor digs into the productivity trends through comparisons and contrasts between US, German and Japanese history since 1980. Some surprises, especially the one  showing the US advantage is largely based on working people to death, far more than Germany or Japan.

The Productivity Race: US vs. Germany vs. Japan

https://conversableeconomist.blogspot.com/2020/06/the-productivity-race-us-vs-germany-vs.html

Over the long run of decades, essentially all of the gains in standard of living are due to higher levels of productivity. On average and over time, what the people of a society produce is going to be closely linked what they can consume. In addition, the many and manifest problems of society are much easier to address in a context of an economy with rising productivity and economic growth, because an economy with flat productivity and zero growth is a zero-sum game, where helping one group always means imposing costs on others. 

Martin Neil Baily, Barry P. Bosworth and Siddhi Doshi search for "Lessons from Productivity Comparisons of Germany, Japan, and the United States (International Productivity Monitor, Spring 2020, pp. 81=103). These are the three biggest high-income developed economies, and three of the four biggest economies in the world (of course, China is the other). However, they differ in their experiences in recent decades, as well as in their institutions and cross-industry patterns. 

As a starting point, here's a quick-and-basic measure of productivity: GDP per hour worked.  Starting back in 1970, the US economy was way ahead in this measure of productivity: "Germany's aggregate productivity level was 0.72 relative to the United States in 1970, and Japan's aggregate productivity level was 0.40 relative to the US level in 1970." But Germany and Japan had more rapid productivity growth than the US in the 1980s and 1980s, and in fact Germany caught up to US levels. However, since about 1995, the US has reasserted its lead with faster productivity growth than Germany and Japan. 
As the authors look more deeply into these patterns, what do they see? 

1) The figure measures output per hour worked, but in Germany the average worker worked 1363 hours in 2018, while the average US worker was on the job 1786 hours that year.  (Take moment to wrap your mind around that difference. The average German workers worked more than 400 hours less in 2018--more than 10 weeks less!). Indeed, Germany has been substantially reducing average number of hours worked in recent years: for example, some German union workers negotiated for those who preferred it to choose a 28-hour work week. If one instead did a comparison by output per worker, not output per hour worked, the gap would be larger: "However, Ger­many has greatly reduced the number of hours worked per worker and so output per worker was only 73. 7 per cent of the US level in 2017." 

Japan has also reduced hours worked. In 1990, for example, the average Japanese worker was on the job 2031 hours per year, compared with 1,833 hours for a US worker. But by 2018, the average Japanese worker was at 1680 hour per year, lower than the US level of 1786 hours. 

2) These differences in hours worked across countries may also imply something about levels of productivity.  For the sake of argument, let's hypothesize that the decline in hours in Germany and Japan tended to be larger for workers with lower skills. If that is true, then the comparison of GDP/hour worked is looking at a broader range of US workers compared with a group that lacks the same proportion of low-skilled workers in Germany and Japan. 

3) Of course, West and East Germany combined in the early 1990s, so what "Germany" means as an economy shifts at that time. But overall, the authors write: "The German economy caught up to the US level of productivity in the 1990s and has since remained close behind. Their economy lacks the innovative IT sector of the United States but has other ad­vantages, including strong worker training. German GDP per capita is well below the US level, but that is because German work­ers have many fewer annual hours of work, and more leisure."

4) Of course, Japan has an economic meltdown for the ages in the early 1990s, from which its economy has arguably never fully recovered. The authors write: "In the 1990s that relative progress [for Japan] stalled out and GDP per hour worked fell further be­hind the levels achieved in both Germany and the United States. Increasing the level of competitive intensity and driving out low productivity small and large firms would help complete Japan's convergence to the productivity frontier. The Japanese manu­facturing sector still has strong productiv­ity performance, setting the frontier level of productivity in some industries, but its rel­ative performance has declined. ... The lit­erature suggests Japan may have had dif­ficulty with software development and the application of IT." 
 
5) One can also do a breakdown of productivity by industry, and look for industries where productivity in one of these three countries seems especially low compared to the others. For the US, the construction and utilities are two industries where low productivity stands out.  They write: "Recent productivity growth in the United States has been very slow indeed. There are promising technologies on the horizon but so far the gains are not being realized. The results in this article point to problem industries such as construction and utilities where productivity growth is very low or negative. While it is likely that productivity measurement needs to be im­proved, there are also underlying problems associated with regulation and a lack of ef­fective competition." I would add my own hobby-horses here for US productivity growth, which include an insufficient commitment to worker training and to research and development efforts. 

 -- via my feedly newsfeed

Medicaid Expansion’s Coverage Gains Won’t Hurt State Budgets, Even in Recession [feedly]

Medicaid Expansion's Coverage Gains Won't Hurt State Budgets, Even in Recession
https://www.cbpp.org/blog/medicaid-expansions-coverage-gains-wont-hurt-state-budgets-even-in-recession

With Oklahoma and Missouri voters deciding this summer whether their states will extend Medicaid to a combined 600,000 people by adopting the Affordable Care Act's (ACA) Medicaid expansion, opponents are again falsely claiming that states can't afford the expansion, warning that the COVID-19 pandemic and recession will drive enrollment higher. While the recession will, in fact, likely prompt more people to enroll, that will cost states little or nothing at a time when the expansion's positive impacts on access to care, health outcomes, and financial security are more important than ever.

Millions of people have gained coverage through expansion, driving down uninsured rates in the 35 expansion states (plus Washington, D.C.) compared to non-expansion states. It has cost states little and even saved money in many of them, state and independent analyses consistently find.

That's because, for starters, states face little upfront cost for the expansion, with the federal government paying the entire cost from 2014 to 2016 before phasing down to 90 percent in each year beginning with 2020. Meanwhile, expansion produces offsetting savings and revenue increases. As more people gain coverage, for instance, hospitals' uncompensated care costs fall and, in some states, public hospital budgets and payments to other hospitals to help cover those costs fall as well. These savings alone could offset more than one-third of the expansion's upfront cost across the 15 states that have not yet adopted it, the Urban Institute estimates. States also spend less on programs for people with behavioral health needs, since Medicaid pays for their treatment, and less on corrections as federal Medicaid dollars pay a greater share of the inpatient hospital costs of inmates eligible for or enrolled in Medicaid when care was provided. In states that tax managed care plans serving Medicaid beneficiaries, higher Medicaid enrollment generates additional revenue as well.

In Missouri, a 2019 Washington University study projected that expansion would save the state $39 million in the current fiscal year, and $932 million from 2020 to 2024. This would mirror the experiences of states like Arkansas, Louisiana, Michigan, Montana, and Virginia, which estimate that their expansions have save the states money and will keep doing so with the federal matching rate at 90 percent.

Similarly, a recent New England Journal of Medicine analysis of state budget data concludes that expansion states saw "no significant changes in spending from state revenues associated with Medicaid expansion," compared to non-expansion states — including for 2017 and 2018, after the federal matching rate fell. Further, there's "no evidence that Medicaid expansion forced states to cut back on spending on other priorities, such as education, transportation, or public assistance," the authors find.

While these findings predate COVID-19 and the recession, the same budget dynamics should operate during the recession. With millions losing their jobs or much of their income, expansion enrollment and upfront state costs will indeed rise. But so, too, will the offsetting savings described above. That's because, without expansion, higher uninsurance due to the recession will increase demand (and therefore state spending) for state-funded programs serving the uninsured, like uncompensated care pools and behavioral health programs.

Some states have dedicated funding sources for their Medicaid expansions, such as higher assessments on health care providers and on managed care plans that serve Medicaid enrollees. Since these revenues are tied to enrollment and utilization, revenue will rise with enrollment, preventing states from experiencing budget gaps that some expansion opponents forecast. Oklahoma's legislature passed a bill this spring that would have covered the state's expansion cost in part through a higher assessment on the state's hospitals tied to utilization, but Governor Kevin Stitt vetoed it.

Meanwhile, the benefits to state residents from expanding Medicaid will only grow as more people need coverage. Already, nearly 27 million people may have lost job-based health coverage due to the recession, Kaiser Family Foundation researchers estimate. Urban Institute researchers project that about 40 percent of people losing job-based coverage in non-expansion states will become uninsured, compared to 23 percent in expansion states, largely because fewer will qualify for Medicaid.

Expansion coverage improves access to care, with especially large gains for Black and Hispanic adults, research finds. It strengthens financial security by, for example, reducing medical debt and preventing evictions. It saves lives, with researchers projecting that it would have prevented 776 premature deaths among older adults in Missouri over four years and 467 in Oklahoma. Expansion also improves hospital finances, particularly for rural hospitals — which could prove especially important today, with hospitals struggling due to both higher costs and less revenue due to the pandemic.

Finally, the federal dollars that come with the expansion provide valuable economic stimulus during a recession. The expansion would likely create or save over 350,000 jobs among states that adopted it while the economy was still recovering from the Great Recession from 2014 to 2016, the Council of Economic Advisers estimated in 2014. With billions in federal dollars at stake, the expansion could provide similar benefits to the remaining non-expansion states during the recession.

All in all, the Medicaid expansion remains a critical lever for states to extend health coverage to hundreds of thousands of their residents, improve health outcomes, advance racial equity, and help spur an economic recovery, all without hurting their budgets.


 -- via my feedly newsfeed

Rising Food Prices Means Rising Need for Aid [feedly]

Rising Food Prices Means Rising Need for Aid
https://www.cbpp.org/blog/rising-food-prices-means-rising-need-for-aid

People are paying higher prices for groceries during the pandemic, including a nearly 50-year record rise in April, jeopardizing the food security of millions of households already reeling from job and income losses. The additional boost to SNAP benefits in the House-passed Heroes Act would help to address this issue as well as provide needed economic stimulus.

Due to factors such as supply disruptions, supermarket and grocery store food prices were 4.8 percent higher in May 2020 than in May of last year, compared to just a 0.1 percent rise in overall prices over the same period. Prices for all six major grocery store food groups rose over the last 12 months.

Food Prices Have Risen Rapidly Due to Supply Disruptions

Many families were already struggling to pay their rent and put food on the table, and the current crisis has only exacerbated these problems. Food insecurity has roughly doubled from 2018 levels, with 23 percent of households reporting in April that the food they bought didn't last through the month and they didn't have enough money to get more. Such food insecurity is far more common among people of color, affecting, for example, 29 and 34 percent of Black and Hispanic respondents, respectively.

Also particularly alarming is the rise in food insecurity among children. Nearly 1 in 5 mothers of young children (12 and under) reported that their children weren't eating enough in April — a level five times higher than in 2018 — because they couldn't afford enough food. Food insecurity among children can have lasting impacts on their mental and physical development and overall health and well-being. And because parents often skip meals or eat less themselves so that their children have enough to eat, the share of parents who don't get enough to eat is usually even higher than the share of affected children.

SNAP is responding to increased need during this pandemic partly thanks to steps that policymakers have taken to enhance food assistance, such as letting states provide emergency supplemental benefits that raise households' SNAP levels to the current maximum amount and creating a new mechanism known as Pandemic-EBT (or P-EBT) to compensate for meals that children miss due to school closures.

But policymakers should do more. About 40 percent of SNAP households — families with the lowest incomes that are already getting the maximum benefit — aren't benefiting from the emergency benefitsIt's also not clear that every state will apply for P-EBT or that policymakers will extend it through the summer. That's why additional measures, such as those in the Heroes Act to raise the maximum SNAP benefit levels and address problematic restrictions in the food assistance relief measures enacted thus far, are needed to aid households with the highest risk for homelessness, food insecurity, and other hardships.


 -- via my feedly newsfeed

Friday, June 19, 2020

Q2 GDP Forecasts: Probably Around 33% Annual Rate Decline [feedly]

Q2 GDP Forecasts: Probably Around 33% Annual Rate Decline
http://www.calculatedriskblog.com/2020/06/q2-gdp-forecasts-probably-around-33.html

Important: GDP is reported at a seasonally adjusted annual rate (SAAR). So a 33% Q2 decline is around 8% decline from Q1 (SA).

From Merrill Lynch: 
We revise up 2Q GDP to -35% qoq saar from -40% and 3Q to 20% from 7%, given the faster and more successful reopening. [June 18 estimate]
emphasis added
From Goldman Sachs: 
We have adjusted our real GDP growth forecasts and now expect -33% in Q2, +33% in Q3, and +8% in Q4 (vs. -36%, +29%, and +11% previously) in qoq annualized terms. [June 18 estimate]
From the NY Fed Nowcasting Report
The New York Fed Staff Nowcast stands at -19.0% for 2020:Q2 and -1.9% for 2020:Q3. [June 19 estimate]
And from the Altanta Fed: GDPNow
The GDPNow model estimate for real GDP growth (seasonally adjusted annual rate) in the second quarter of 2020 is -45.5 percent on June 17, down from -45.4 percent on June 16. [June 17 estimate]

 -- via my feedly newsfeed

The Big Failure of Small Government