Friday, January 17, 2020

Reducing the Health-Care Tax [feedly]

Reducing the Health-Care Tax
http://cepr.net/publications/op-eds-columns/reducing-the-health-care-tax

Jared Bernstein and Dean Baker
The Washington Post, January 14, 2020

One of most enduring, economically and socially damaging, downright frustrating facts about life in the United States is how expensive health care is here. Not only does U.S. health care cost far more than in other advanced economies, but compared with the nations that spend less, we have worse or equivalent health outcomes. In fact, U.S. life expectancy now lags behind that of all the advanced economies.

An MRI scan that cost $1,400 here went for $450 in Britain and $190 in Holland. Thirty tablets of a drug to reduce the risk of blood clots (Xarelto) cost $380 here, $70 in Britain, $80 in Switzerland and $60 in Holland. Hospital admission for angioplasty is $32,000 here, $15,000 in Australia, $12,000 in Britain, $7,000 in Switzerland, $6,000 in the Netherlands.

Add to those differences the latest outrage in health-care costs: surprise medical billing, when even well-insured patients can wake up from surgery finding that they owe thousands of dollars, because someone treating them while they were unconscious was out of their insurance network.

Princeton economists Anne Case and Angus Deaton (a Nobel winner) recently summarized the problem by labeling it an $8,000-a-year annual health-care tax paid by U.S. families. This is the difference in costs between what we pay for health care and what people in other countries pay. As Case put it: "We can brag we have the most expensive health care. We can also now brag that it delivers the worst health of any rich country."

Why call this expense a tax? Well, for one, if you want health coverage, you can't escape it. But even if you don't — and good luck with that — you still can't escape the tax, as both employer- and government-provided health care extract payments through lower paychecks and public financing.

Case and Deaton may be erring on the low side in their $8,000-per-family figure. The Organization for Economic Cooperation and Development puts per-person spending in the United States at $8,950 a year. That compares with $5,060 in Germany, $3,470 in Canada and just $3,140 in Britain. If we assume a family of three, we would get an annual health-care tax of $11,670 compared with Germany and more than $17,000 compared with the cost of health care in Britain.

How can such differences persist, especially in a service where consumption is so essential to well-being? If ice cream were that much more expensive here, we'd have a lot to squawk about, for sure. But it wouldn't be a matter of life and death.

An obvious, and correct, answer as to why U.S. health care is so expensive is because we do so little, relative to other systems, to control costs. But it's worse than that. We do a fair amount to make health care more expensive.

First, our system of private insurance costs far more than single-payer systems like Canada's, and also more than countries with private but heavily regulated insurers like Germany. OECD data show that as a share of health spending, our administrative costs are three times that of Canada's and twice that of Germany's. Getting our administrative costs closer to those in other countries would require regulating private insurers and expanding public coverage, but it could save us at least 10 percent of our total health-care bill.

Next, we pay twice as much to our health-care providers and for prescription drugs as everyone else. The latter costs us more than $3,000 per family per year. We pay more than twice as much for medical equipment, costing us a bit less than $1,500 per family per year. Doctors and dentists cost us close to an extra $750 per family per year.

One reason for the outsize costs of these inputs to U.S. health care is that government policy protects our providers. When it comes to manufactured goods, like cars and clothes and almost everything on the shelves of Walmart, economists and policymakers push for "free trade" and more competition. But when it comes to health-care providers, these same authorities turn protectionist.

In areas like prescription drugs and medical equipment, this protection is explicit: Manufacturers are granted patent monopolies. The government will arrest anyone who sells protected items in competition with a patent holder.

In the case of doctors, we have maintained or increased barriers that make it difficult for qualified foreign physicians to practice in the United States. We also prevent other health-care professionals, such as physicians' assistants and nurse practitioners, from doing many tasks for which they are entirely competent. There is a similar story with dentists and dental hygienists.

Other countries directly control drug prices. In France, the government determines whether a new drug is an improvement or a copycat, and, if the drug is deemed useful, the government negotiates drug prices with the manufacturers and caps their revenue. When sales exceed the cap, the manufacturer must rebate most of the difference back to the government.

Here in the United States, we give drug companies and medical equipment manufacturers' patent monopolies and allow them to charge whatever they want. We don't even let the government use its massive leverage to negotiate lower drug prices for Medicare beneficiaries. That's what makes these goods expensive; they're almost always relatively cheap to produce.

This is fixable. It would take regulating costs, reducing reimbursements to providers and increasing competition.

The pharmaceutical industry's rationale for cost-exploding medical patents is that it helps incentivize research and innovation. Without them, it's likely that pharmaceuticals and medical equipment companies would do less speculative research. But it would take a fraction of the savings from reducing such protectionism to replace patent-support research with publicly supported research (for which we already spend $40 billion a year).

In terms of boosting competition, allowing foreign doctors whose training meets our standards to more easily practice medicine here would bring U.S. physicians' pay in line with international standards. Of course, our doctors pay much more for their education than doctors trained elsewhere, so part of this new structure would also require reducing the domestic cost of medical education and alleviating some of the educational debt burden that U.S.-trained doctors have acquired.

Increasing competition would also require using antitrust measures to push back on the pricing power engendered by the consolidation of both hospital groups and medical practices. An analysis by the New York Times of 25 metro areas found that hospital mergers "have essentially banished competition and raised prices for hospital admissions."

Even if we succeed in raising competition and reducing protectionism, health care will still be too expensive for many low- and moderate-income families, many of whom have suffered stagnant incomes in recent decades. Like every other wealthy country, we will need to get on a path to universal coverage. But whatever form that takes, if we can significantly reduce our current health-care tax, the savings will easily be large enough to extend quality, affordable coverage to every American.


Jared Bernstein, chief economist to former vice president Joe Biden, is a senior fellow at the Center on Budget and Policy Priorities. 

Dean Baker is a senior economist at the Center for Economic and Policy Research.


 -- via my feedly newsfeed

Bloomberg: Trump Plans to Nominate Shelton, Waller to Federal Reserve [feedly]

More efforts to politicize the Fed. (If this were to happen, regulatory economic control would pass into Trumps hands. With that kind of power, hard to see anything but revolutionary tactics dislodging it)

Trump Plans to Nominate Shelton, Waller to Federal Reserve

https://www.bloomberg.com/news/articles/2020-01-16/trump-plans-to-nominate-shelton-waller-to-federal-reserve-board

President Donald Trump plans to nominate Judy Shelton and Christopher Waller to join the Federal Reserve, the White House said.

The president, who has publicly criticized Fed Chairman Jerome Powell and his colleagues for not cutting interest rates as aggressively as he would like, tapped the pair in July for the two remaining vacancies on the central bank's seven-seat board in Washington. But the formal announcement of his intention to nominate them didn't come until Thursday and will now move to the Senate for consideration.

ADVERTISING

If confirmed by the Senate, they will join an institution that's been under constant attack from the president who has sought to make Powell a potential scapegoat if the economy falters as he seeks re-election this year. Trump returned to this theme at the White House on Wednesday, appearing to lament that he had passed over Kevin Warsh in picking Powell as Fed chief.

Fed officials cut interest rates three times in 2019 but signaled they expect to keep rates on hold through 2020, based on their forecast of moderate economic growth with unemployment staying near a 50-year low.

Gold Standard

The two economists have widely different backgrounds, but their policy comments suggest they'd be inclined to be open to Trump's calls for easier monetary policy.

Shelton, who has been an informal adviser to Trump, has publicly said the central bank should reduce rates. She's spent decades outside mainstream economics and recently appears to have completed a metamorphosis from proponent of returning to the gold standard -- a concept broadly espoused by those who feel monetary policy is too lax -- to an advocate of the need for more stimulus.

She has a doctorate in business administration from the University of Utah with an emphasis on finance and international economics.

Waller is largely a conventional choice because he's drawn from within the Fed's own ranks.

He is a Ph.D. economist who previously served as a professor of economics at the University of Notre Dame before joining the St. Louis Fed in 2009, where he is director of research. Waller has been consistent in his calls for a more dovish approach over the years. His key research focus has been on monetary and macroeconomic theory and the political economy.

Lengthy Process

The lengthy Senate confirmation process means neither candidate is likely to join the board for months. Current Vice Chairman Richard Clarida's nomination was announced April 18, 2018, and he wasn't sworn in until Sept. 17. Governor Michelle Bowman, nominated the same day as Clarida, didn't take office until Nov. 26.

As a high-ranking Fed staffer, Waller may have a better chance of passing muster with lawmakers than some of Trump's previous contenders. As for Shelton, the Senate has already confirmed her in her current role as the U.S. executive director for the European Bank for Reconstruction and Development.

Read more: Fed Hopeful Shelton Questions Value of Bank's Dual Mandate

Her unorthodox views, though, could attract opposition.

In an interview with Bloomberg in May, she said she was "highly skeptical" that the goals for the Fed set by Congress -- the pursuit of maximum employment, stable prices and moderate long-term interest rates -- were relevant.


 -- via my feedly newsfeed

Thursday, January 16, 2020

Science and engineering report shows continued loss of U.S. dominance

Science and engineering report shows continued loss of U.S. dominance


The Cerro Tololo Inter-American Observatory in Chile, which is funded by the NSF. (T. Abbott/NOAO/AURA/NSF)
Jan. 15, 2020 at 9:00 a.m. EST
The United States has continued to fall from its position as the uncontested world leader in science and engineering, according to a federal report on scientific investment and education released Wednesday.

The National Center for Science and Engineering Statistics, a federal statistical agency within the National Science Foundation, took the pulse of American science by compiling research expenditures, journal articles, the scientific workforce and education data. The NSF submits this state-of-the-science report to Congress every two years.

The report identifies several obstacles and declines. "There's no denying that the U.S. science and engineering enterprise faces head winds," Diane Souvaine, the chair of the National Science Board, told reporters on Tuesday.

"Fifty-nine years ago, President Kennedy sent America on a path to the moon," she said. "Today we find ourselves again in an hour of challenge and change."

AD
ADVERTISING

What the report found on investment:

The U.S. economy is tightly bound to science and technology. Since World War II, these advancements have driven 85 percent of economic growth, said Julia Phillips, chair of the National Science Board's science policy committee.

In 2017, the United States spent $548 billion on research and development. That's more than any other country. Business investments have driven growth of research and development spending, which has increased by about 4 percent each year since the turn of the century.

But, on the global stage, the U.S. share in R&D has been shrinking while the world's total swelled to more than $2 trillion — an overall tripling of investments between 2000 and 2017. In 2000, nearly 40 cents of each dollar used for R&D was spent in the United States. By 2017, the U.S. portion was down to 25 cents.

AD

Much of the growth has been in Asia; China, which was responsible for 32 percent of the increase in those 17 years, is probably the world's largest R&D performer. "China may already have surpassed the U.S. in total expenditures at some point in 2019," Phillips said, based on a National Science Board projection.

Phillips drew a distinction between two types of science expenses, what she called "fundamental research" vs. "experimental development." Fundamental research, which includes theoretical and applied work, generates new knowledge, she said. The United States spends more in this area than any other country, by a significant amount. This, Phillips said, is the "seed corn" of American science and engineering enterprise. The government funded $76 billion of that research in 2017. Businesses funded an additional $85 billion.

Countries such as China, in contrast, have devoted proportionally more money to experimental development. That funds the creation of new things — improved materials or devices, for instance — rather than knowledge.

AD

On education and employment:

The science and engineering workforce grew faster than overall workforce, a trend that has remained true since 1960. Many of these workers were born in other countries. Nearly 6 in 10 people with PhDs in the workforce, according to the report, are foreign-born.

In 2016, about 800,000 students in the United States earned bachelor's degrees, or the equivalent, in a science or engineering field. European Union countries produced almost a million undergraduates with these degrees. China awarded 1.7 million, the report said.

International students also make up large numbers of undergraduate and graduate degrees in U.S. science and engineering. In 2017, people with temporary visas earned a third of science and engineering doctoral degrees. Many of these students remain an important part of the scientific community in the United States, staying to work for years after graduation.

AD

First-year enrollments of foreign students, however, have fallen from their peak numbers in 2016. China and India have become competitors for attracting skilled international students. "Amid the global bidding war for talent, we need to avoid complacency," Phillips said.

A survey by international educators suggested that nationalist and anti-immigration rhetoric in the United States may have contributed to the recent decline in foreign students, CNN reported in November.

"While other countries work hard to attract international students, we are managing to send a message that talented foreigners are not welcome here, just when we most need them," Ángel Cabrera, president of George Mason University, said in a statement to The Washington Post in 2018.

And diversity:

In overall numbers, more women are in the scientific workforce than ever before, the new report said, as are black, Hispanic and other minority scientists and engineers. But because the number of jobs also increased, women and minorities remain underrepresented in most fields.

AD

Change has been slow. Women held 29 percent of science and engineering jobs in 2017, the report said. In 2003, that share was 23 percent. Underrepresented minorities rose from 9 percent of the workforce to 13 percent over the same period.

"The science and engineering enterprise in the United States ideally should reflect our population in race, ethnicity and gender," Phillips said. "It's clear that we have a long way to go."
--

Tuesday, January 14, 2020

Australia Shows Us the Road to Hell [feedly]

Australia Shows Us the Road to Hell
https://www.nytimes.com/2020/01/09/opinion/australia-fires.html

text only:

A controlled burn along the Princess Highway in Meroo National Park, Australia.Credit...Matthew Abbott for The New York Times

In a rational world, the burning of Australia would be a historical turning point. After all, it's exactly the kind of catastrophe climate scientists long warned us to expect if we didn't take action to limit greenhouse gas emissions. In fact, a 2008 report commissioned by the Australian government predicted that global warming would cause the nation's fire seasons to begin earlier, end later, and be more intense — starting around 2020.

Furthermore, though it may seem callous to say it, this disaster is unusually photogenic. You don't need to pore over charts and statistical tables; this is a horror story told by walls of fire and terrified refugees huddled on beaches.

So this should be the moment when governments finally began urgent efforts to stave off climate catastrophe.

But the world isn't rational. In fact, Australia's anti-environmentalist government seems utterly unmoved as the nightmares of environmentalists become reality. And the anti-environmentalist media, the Murdoch empire in particular, has gone all-out on disinformation, trying to place the blame on arsonists and "greenies" who won't let fire services get rid of enough trees.
These political reactions are more terrifying than the fires themselves.

PAUL KRUGMAN'S NEWSLETTER Get a better understanding of the economy — and an even deeper look at what's on Paul's mind. Sign up here.

Climate optimists have always hoped for a broad consensus in favor of measures to save the planet. The trouble with getting action on climate, the story went, was that it was hard to get people's attention: The issue was complex, while the damage was too gradual and too invisible. In addition, the big dangers lay too far in the future. But surely once enough people had been informed about the dangers, once the evidence for global warming became sufficiently overwhelming, climate action would cease to be a partisan issue.

The climate crisis, in other words, would eventually become the moral equivalent of war — an emergency transcending the usual political divides.

But if a nation in flames isn't enough to produce a consensus for action — if it isn't even enough to produce some moderation in the anti-environmentalist position — what will? The Australia experience suggests that climate denial will persist come hell or high water — that is, through devastating heat waves and catastrophic storm surges alike.


Buildings on the main street of Mogo, Australia, destroyed by fire.Credit...Matthew Abbott for The New York Times

You might be tempted to dismiss Australia as a special case, but the same deepening partisan division has long been underway in the United States. As late as the 1990s, Democrats and Republicans were almost equally likely to say that the effects of global warming had already begun. Since then, however, partisan views have diverged, with Democrats increasingly likely to see climate change happening (as indeed it is), while Republicans increasingly see and hear no climate evil.


Does this divergence reflect changing party composition? After all, highly educated voters have been moving toward the Democrats, less-educated voters toward the Republicans. So is it a matter of how well informed each party's base is?

Probably not. There's substantial evidence that conservatives who are highly educated and well informed about politics are more likely than other conservatives to say things that aren't true, probably because they are more likely to know what the conservative political elite wants them to believe. In particular, conservatives with high scientific literacy and numeracy are especially likely to be climate deniers.

But if climate denial and opposition to action are immovable even in the face of obvious catastrophe, what hope is there for avoiding the apocalypse? Let's be honest with ourselves: Things are looking pretty grim. However, giving up is not an option. What's the path forward?

The answer, pretty clearly, is that scientific persuasion is running into sharply diminishing returns. Very few of the people still denying the reality of climate change or at least opposing doing anything about it will be moved by further accumulation of evidence, or even by a proliferation of new disasters. Any action that does take place will have to do so in the face of intractable right-wing opposition.

This means, in turn, that climate action will have to offer immediate benefits to large numbers of voters, because policies that seem to require widespread sacrifice — such as policies that rely mainly on carbon taxes — would be viable only with the kind of political consensus we clearly aren't going to get.

What might an effective political strategy look like? I've been rereading a 2014 speech by the eminent political scientist Robert Keohane, who suggested that one way to get past the political impasse on climate might be via "an emphasis on huge infrastructural projects that created jobs" — in other words, a Green New Deal. Such a strategy could give birth to a "large climate-industrial complex," which would actually be a good thing in terms of political sustainability.

Can such a strategy succeed? I don't know. But it looks like our only chance given the political reality in Australia, America, and elsewhere — namely, that powerful forces on the right are determined to keep us barreling down the road to hell.


Paul Krugman has been an Opinion columnist since 2000 and is also a Distinguished Professor at the City University of New York Graduate Center. He won the 2008 Nobel Memorial Prize in Economic Sciences for his work on international trade and economic geography. @PaulKrugman


 -- via my feedly newsfeed

Jared Bernstein: 2019: A robust year for job growth; less so for wage growth [feedly]

2019: A robust year for job growth; less so for wage growth
http://jaredbernsteinblog.com/2019-a-robust-year-for-job-growth-less-so-for-wage-growth/

Payrolls rose 145,000 last month, capping off a strong year for job gains with payrolls up 2.1 million over the year, an average of 176,000 per month. These are solid numbers, especially at this stage in a uniquely long expansion, but as we show below, their magnitude is well within historical context. In fact, in percentage terms, employment growth in 2019 posted the slowest growth rate (1.4%) since 2010. This, however, is to be expected, as such growth rates typically decelerate as recoveries grow older and the labor market closes in on full capacity (see data note at the end of this post).

The unemployment rate ended the year at 3.5%, a fifty-year low. Wage growth, however, disappointed last month, and has clearly decelerated in recent months, even at low unemployment. This important finding suggests a) job quantity in this labor market expansion is stronger than job quality, b) many workers still suffer weak bargaining clout, and c) based on both recent wage and price movements, we are not yet at full employment.

Our monthly smoother shows monthly gains using 3, 6, and 12-month averages. All three bars are of a similar height, meaning the underlying trend of monthly payroll gains is around 180,000, an impressively large number for a record-long job recovery that's been ongoing for about a decade.

The figure below provides more context, showing average monthly payroll gains since 2000. Last year was around the middle of the pack in terms of its magnitude, but the figure provides a good look at the cumulative job gains that occur in a long, robust jobs expansion compared to the much shorter one in the 2000s.

While both nominal and, more importantly from the perspective of workers' living standards, real paychecks have gotten a boost from the tight labor market over the past few years, they remain a soft spot. The figures below show hourly wage gains, year-over-year, for all private sector workers and for mid-level workers. The figure for all workers rose a lot more strongly last year than in 2019, when, despite a tight labor market, it began to decelerate (this series is more pessimistic than some, but others series show a similar flattening).

The next figure provides similar context showing nominal hourly wage gains for each year, 2000-19 (wage growth for the "all" group is only available since 2007). Last year's deceleration is clear, but the height of the bars is still commensurate with earlier periods of tight labor markets.

The next figure shows real wages (with 2019 values based on my forecast of December's inflation rate). Here again, we see real gains for workers in 2019, but less so than both last year and earlier years in this expansion (one reason for this finding is that inflation was exceptionally low in 2015). A relevant input to this real wage analysis is the fact that productivity growth has slowed over this period. Higher productivity growth allows firms to pay more while maintaining profit margins. Conversely, at lower productivity growth, workers' diminished bargaining power becomes a bigger constraint on their pay, a factor that is increasingly disadvantageous in our era of growing employer power in key industries such as retail, health care, and technology.

Another clear labor-market soft spot is the manufacturing sector. The year ended with a loss of 12,000 jobs; the sector added just 4,000 jobs per month in 2019 compared to 22,000 in 2018. As a share of total employment, manufacturing was 8.4% last month, its second lowest share of record going back to 1939. Of course, this is the result of a long-term shift from goods to service production, one that is common to advanced economies, but research clearly links the recent decline in manufacturing to Trump's trade war.

In sum, 2019 was a good year for low unemployment and job gains. Yes, the latter is down relative to earlier years in the expansion, but that's expected at this stage (see data note below). The crucial macroeconomic lesson is that the U.S. can run a much hotter for much longer labor market than many economists and Federal Reserve policy makers heretofore believed. Even at a 50-year low for unemployment, wage and price pressure remain at bay.

That said, wage trends and manufacturing employment remain conspicuous and important problems, however, and both should be addressed by policies that strengthen worker bargaining power and boost the international competitiveness of exporters.

Data note: There are various ways to calculated annual changes over calendar years. In the above analysis, we take employment and percent changes from December over December, e.g., from December 2018 to December 2019. In our view, this is the best way to summarize the growth over the year versus, say, compared the average payroll level for year t with year t-1. We also note that these payroll values will shortly be revised, though the broad trends described above will remain intact.

Evidence for the claim that employment growth eventually slows as expansions age can be seen in the figure below, which plots year-over-year percent changes in payrolls, with recession shading. As expansions age, this variable eventually decelerates. We quantify this by regressing the change in payrolls (either raw numbers or percent changes) on a trend and trend-squared that grows with each expansion (so the first month in each expansion is '1', the second is '2', etc. and recessions are '0's') we find a significantly non-linearity in this variable. That is, the trend expansion variable is positive (as expected) and the squared value is negative, with both coefficients highly significant.

Source: BLS

None of this should be taken to imply that the expansion is soon to fade to recession. First, there is no evidence of labor market or broader economy overheating, either in the wage or especially in the inflation data. Moreover, there are no obvious credit bubbles of the type that have ended recent expansions. In fact, as Goldman Sach's Jan Hatzius has pointed out, household and firm balance sheets look fairly healthy. In fact, our simple payroll model described above predicts considerably slower payroll growth right now relative to the actual growth rate—about 1% vs. the actual 1.4%–implying this expansion, even at its advanced age, is chugging along at a safe clip, at least for now.


 -- via my feedly newsfeed

Piketty: After the climate denial, the inequality denial [feedly]

amen to this analysis.


After the climate denial, the inequality denial

Thomas Piketty

https://www.lemonde.fr/blog/piketty/2020/01/14/after-the-denial-of-climate-change-the-inequality-denial/

In the wake of the denial of global warming, now on the wane, at least superficially, are we at present witnessing the denial of the rise in inequality?
This is obvious in the case of the French government where all the efforts undertaken since 2017 appear to be guided by the idea that the country is suffering from a surfeit of equality. Hence the tax rewards for the wealthiest when the government came into office; hence similarly its inability to understand the demand for justice expressed in the social movement at the moment. In real terms, a universal retirement pension scheme is possible, but only on condition that everything is done to improve the small and medium pensions, even if this involves increased efforts on the part of the highest salaries and the wealthiest. Those who are at the top of the scale must understand that aging and the end of life mean new challenges in terms of dignity and equality.

More generally speaking, while the demand for justice is expressed in numerous protest mobilisations all over the world, in the media associated with business circles we witness an attempt to relativise the rise in inequality over recent decades. True, nobody expects the weekly publication, The Economist, to be in the lead in a campaign for equality. But this is no reason to manipulate the facts, once they have been established.

It is all the more regrettable because the governments of the rich countries have not made any genuine attempt to promote transparency concerning the distribution of wealth since the crisis in 2008. Given all the declarations on tax havens, the automatic transmission of banking data etc., one would have expected that financial opacity would have decreased. In theory, all countries should now be equipped to collect and publish banking and fiscal data enabling them to follow the development of the distribution of wealth according to the level of income and of wealth, in particular for the top incomes. With the suppression in several countries of progressive-type taxes on wealth and on the income from capital, in several instances (in particular in France, but also equally in Germany, in Sweden or in the United States) we even see a decline in the public data available.

Too frequently, researchers, as do public administrations, find themselves using the rankings published in magazines, data which do indeed indicate the growing prosperity of the wealthiest but which do not fulfil the conditions of transparency and rigour one has the right to expect to inform a reasoned democratic debate on these essential issues. We are supposedly living in the age of "big data".  This is undoubtedly true for the major private monopolies which have the right to unashamedly gain access to our personal data. But as far as public statistics on the distribution of wealth and its necessary redistribution are concerned, in reality we live in an age of considerable opacity which is perpetuated by all those who oppose the reduction of inequalities.

Furthermore we too often forget that we will not be able to resolve environmental challenges unless we make the reduction of inequality central to political action. We must undoubtedly fundamentally rethink the indicators enabling us to measure economic and social progress. To begin with, it is urgent for governments and the media to stop using the concept of 'gross domestic product' (GDP) and concentrate on that of 'national income'. Let me remind you of the two main differences: national income is equal to gross domestic product, minus the incomes which go to foreign countries (or increased by the income entering from foreign countries, depending on the situation of the country), and minus the consumption of capital (which should, in principle, include the consumption of natural capital in all its forms).

To illustrate, let's take a simple example. If 100 billion Euros of hydro-carbons are extracted from the ground (or fish from the seas), then we have an additional 100 billion Euros of GDP (gross domestic product). But as the stock of hydro-carbons (or of fish) has decreased by an equal amount, then national income has not increased by one iota. If, furthermore, the fact of burning the hydro-carbons contributes to making the air unbreathable and the planet uninhabitable then the national income produced in this manner is in reality negative, provided that the social cost of the carbon emissions have been taken into account correctly.

The fact of using national income and national wealth rather than GDP and focussing on distribution and not on averages is not enough to solve all the problems, far from it. It is equally urgent to multiply the indicators specific to climate and the environment (for example, the volume of emissions, the quality of the air or the diversity of the species). But it would be a mistake to imagine that one could conduct the forthcoming debates with these indicators alone, dispensing with any reference to income or wealth. To develop new standards of justice acceptable by the greatest number, it is essential to be able to measure the efforts demanded of various social groups. This requires the ability to be able to compare levels of wealth within a given country as well as between countries and over the course of time. We will not save the environment by consigning all concepts of income or growth to the dustbin.

On the contrary, if ecological parties neglect social issues, they may well, on the contrary, find themselves confined to a privileged electorate and thus enable the maintenance in power of conservatives and nationalists. The challenges of climate change and the rise in inequalities can only be resolved simultaneously. All the more reason, I believe, to combat this dual denial by tackling them with a single voice.


 -- via my feedly newsfeed

Apartheid in the Global Governance System [feedly]

A good review of voting strength in global economic institutions.

Apartheid in the Global Governance System
https://www.globalpolicyjournal.com/blog/14/01/2020/apartheid-global-governance-system

Jason Hickel explores how the voting systems at the WB & IMF contribute to the perpetuation of global inequality.

In my research I have argued that rising global inequality is driven in large part by power imbalances in the global economy, in that rich countries have disproportionate influence when it comes to setting the rules of international trade and finance.   

Nowhere is this problem more apparent than when it comes to voting power in the World Bank and the International Monetary Fund (IMF), two of the key institutions that govern global macroeconomic policy. People tend to assume that representation in these institutions must be fair and democratic, modeled perhaps along the lines of the UN General Assembly.  But quite the opposite is true.  Indeed, they are fundamentally anti-democratic.

The problem starts at the top.  The leaders of the World Bank and IMF are not elected, but are appointed by the US and Europe: according to an unspoken agreement, the president of the World Bank is always an American, while the president of the IMF is always European.

On top of this, voting power in these institutions is skewed heavily in favour of rich countries.  The United States has 16% of the votes, which gives it de facto veto power over all major decisions (decisions need 85% of the vote in order to carry). 

The next largest vote-holders are France, Germany, Japan and the UK – all members of the G7. Middle- and low-income countries, which together constitute some 85% of the world's population, have only about 40% of the vote.

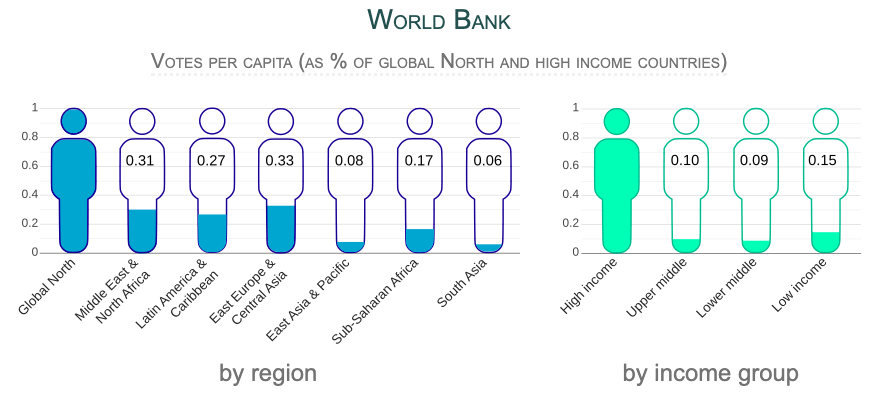
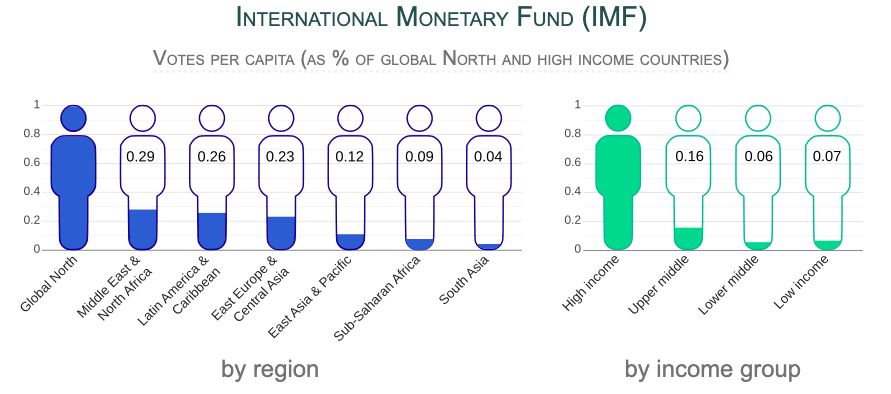
If we look at the voting allocations in per capita terms, the inequalities are revealed to be truly extreme.  For every vote that the average person in the global North has, the average person in the global South has only 1/8th of a vote, or 0.12.  Here is how it breaks down by region and income group in the two institutions.

WB

Graphic by Huzaifa Zoomkawala. Data sources here.

IMF

Graphic by Huzaifa Zoomkawala. Data sources here.

Not only is there minority control over global economic policymaking, there is also a clear racial imbalance at play: on average, the votes of people of colour are worth only a tiny fraction of their counterparts.  If this was the case in any particular country, we would be outraged.  We would call it apartheid, or a racial dictatorship.  And yet a form of global apartheid operates right at the heart of international economic governance, and hardly anybody talks about it.  

In some cases the differences between countries are particularly striking.  Take Bangladesh and Nigeria, both of which were British colonies.  A British person's vote today is worth 41 times more than a Bangladeshi's vote, and 23 times more than a Nigerian's vote - and this is many decades after the end of colonial rule.

This brings us to an important point.  The inequalities that characterize voting power in the WB and IMF have their roots in the colonial period.  After all, these institutions were founded in 1944.  Countries that were colonies at the time – and even countries that were former colonies – were integrated into the system on intentionally unequal terms.  Of the original 44 member states, the G7 held 62% of the total voting power, with well over half of that monopolized by the US. 

It is remarkable, when you think about it, that the institutions that govern global economic policy – and which determine domestic economic policy in countries across the global South, in the form of structural adjustment programmes – are in effect colonial institutions.  They were designed with colonial principles in mind and they remain fundamentally colonial in character to this day, some seven decades after decolonization.

Indeed, the anti-democratic character of the WB/IMF is precisely why they were able to impose structural adjustment in the first place, which ended up devastating global South economies. Such ruinous policies would never have been acceptable under democratic principles.

There have long been calls by global South countries to democratise the World Bank and the IMF.  For decades these were blithely ignored. A reform package was finally introduced in 2010, but it turned out to be little more than window dressing: only 3% of voting power was shifted from rich countries to poor countries (about half of that going to China), and the US retained its veto.

Defenders of this apartheid-style system point out that voting power is allocated according to the monetary contributions that each nation makes to the WB/IMF in the form of share purchases.  Theoretically, bigger economies can make bigger contributions.  Apologists argue that this is a legitimate approach: it makes sense, they insist, that bigger economies should have more say in decisions related to the global economy.  

First of all, it doesn't actually work this way. China is the world's second biggest economy.  India's economy is bigger than France's.  Despite their economic size, they are not allowed to purchase more shares - indeed they are actively prevented from doing so.  The fact that big global South economies have been relegated to minority status in the World Bank and IMF suggests that there is another logic at play altogether – a racial logic, a colonial logic.

In any case, think of the implications of the claim that voting power should be allocated according to income. In any national political system we would reject the notion that the rich should have more voting power than the poor - it would be repulsive.  And yet, astonishingly, such overt plutocracy is routinely promoted by those who defend the WB/IMF system.

Ultimately, the voting system at the WB/IMF contributes to the perpetuation of global inequality.  The system ensures that the very countries that became rich by plundering the global South during the colonial period are now, by dint of their plunder, empowered to determine the rules of the global economy in their own interests, indefinitely.  Inequality begets inequality.


Dr. Jason Hickel is an anthropologist, author, and a Fellow of the Royal Society of Arts.  He has taught at the London School of Economics, the University of Virginia, and Goldsmiths, University of London, where he convenes the MA in Anthropology and Cultural Politics.  He serves on the Labour Party task force on international development, works as Policy Director for /The Rules collective, and sits on the Executive Board of Academics Stand Against Poverty (ASAP).

This first appeared on Jason's blog and was reprinted with permission.


 -- via my feedly newsfeed