https://www.epi.org/blog/racial-disparities-in-income-and-poverty-remain-largely-unchanged-amid-strong-income-growth-in-2019/
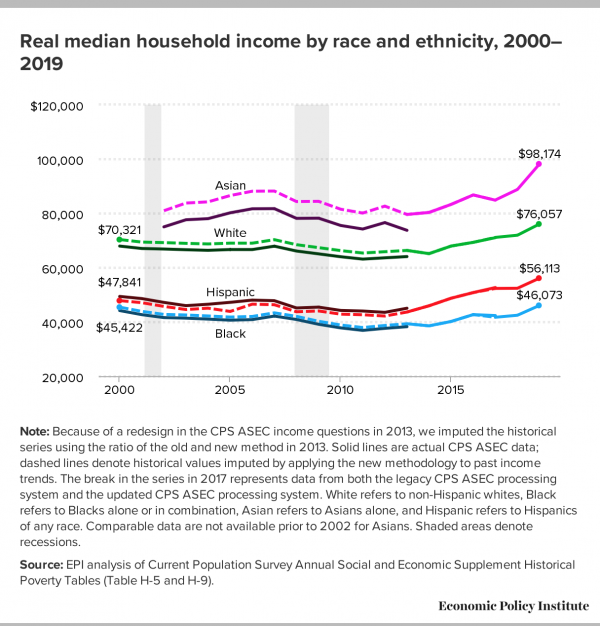
The Census Bureau report on income, poverty, and health insurance coverage in 2019 reveals impressive growth in median household income relative to 2018 across all racial and ethnic groups, but income gaps persist. While the Census cautions that the 2019 income estimates may be overstated due to a decline in response rates for the survey administered in March of this year, real median household income increased 10.6% among Asian households (from $88,774 to $98,174), 8.5% among Black households (from $42,447 to $46,073), 7.1% among Hispanic households (from $52,382 to $56,113), and 5.7% among non-Hispanic white households (from $71,922 to $76,057), as seen in Figure A.
In 2019, the median Black household earned just 61 cents for every dollar of income the median white household earned (up from 59 cents in 2018), while the median Hispanic household earned 74 cents (unchanged from 2018).

Based on EPI's imputed historical income values (see the note under Figure A for an explanation), African American households finally surpassed their pre-recession median income 12 years after the start of the Great Recession in 2007—the last racial group to do so. Compared with household incomes in 2007, median household incomes in 2019 were up 21.1% for Hispanic households, 11.3% for Asian households, 8.2% for non-Hispanic white households, and 6.3% for African American households. Unfortunately, this recovery of income has been cut short by massive job losses, particularly among Black and Hispanicworkers, during the current pandemic and recession.
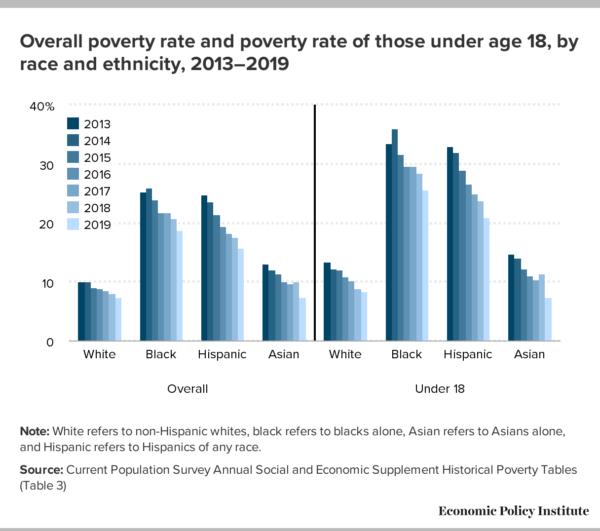
The 2019 poverty rates also reflect the strong income growth between 2018 and 2019, though the Census also cautions that the poverty estimates may be understated due to a decline in response rates. As seen in Figure B, poverty rates for all groups were down, but remained highest among African Americans (18.7%, down 2.0 percentage points), followed by Hispanics (15.7%, down 1.9 percentage points), Asians (7.3%, down 2.8 percentage points), and whites (7.3%, down 0.8 percentage points). African American and Hispanic children continued to face the highest poverty rates—more than one-quarter (25.6%) of African Americans and more than one-fifth (20.9%) of Hispanics under age 18 lived below the poverty level in 2019. African American children were more than three times as likely to be in poverty as white children (8.3%).

The Supplemental Poverty Measure (SPM), an alternative to the long-running official poverty measure, provides an even more accurate measure of a household's economic vulnerability. While the official poverty rate captures only before-tax cash income, the SPM accounts for various noncash benefits and tax credits. The SPM also allows for geographic variability in what constitutes poverty based on differences in the cost of living. According to the 2019 SPM, the official poverty measure understates poverty among Hispanics (the 2019 SPM rate is 18.9% vs. 15.7% by the official poverty measure), Asians (11.7% vs. 7.3%), and non-Hispanic whites (8.2% vs. 7.3%), while the measures produce relatively similar rates for African Americans (18.3% vs. 18.7%).
-- via my feedly newsfeed

No comments:
Post a Comment