Saturday, October 10, 2020

Journal Entry: 10/10/20: I Have a Socialist Moment With Harold Meyerson


It Stops Being Scary When Its the Only Light Around.


The scary word is not the obstacle, IMO. Socialism gets currency as the more reactionary order crumbles from its own irreconcilable fault lines, and simply cannot continue in the old way. We are seeing that here, and now. People do not go to the immense and expensive trouble to make structural changes to their societies, except under duress. The forces mandating the vast accumulations of wealth in the 70's and afterwards, overwhelmed even the highly skilled, liberal and cautionary efforts of Carter, Clinton, and Obama. The decay of an imperial culture, including its lifelong infections of slavery and its legacy of racism, native genocide, and the moral damage inflicted by imperial wars, has been devastating to our karma. Even in the Left, the damage leaves its imprint in the form of endless anarchisms (under many names) and factional labors. Trump is teaching us that is a luxury with which we will have to part. If not, we may, like German social democrats and communists, have to wait for an alliance of foreign armies to save us.

The socialist movements are being reborn again from necessities and failures of the now long-standing austerity regime in US capitalism Along the way it is not infrequently reproducing, or recycling, the socialist birth traumas of earlier times and upheavals in capitalism's history, which resulted, usually, in socialism's advance. Societies that cannot reform the unsustainable chasms of wealth, class and caste in a mandatory multi cultural, multi-racial, multi-national, mixed-economic-system world -- cannot thrive now. Globalization has baked that inevitability in.
Perhaps it was inevitable that the wealth concentration and political corruptions (or nullification) would always walk hand in hand toward anti-democratic and anti-popular and immoral, fascist-like regimes. Perhaps it is inevitable that such regimes if not defeated early, must die by the sword. Perhaps not. Is this a test? Yes. It is.

The Socialist Moment, and How to Extend It

Harold Meyerson reviews (a book and a movie about) Bernie Sanders socialism.


While Joe Biden has been making it unmistakably clear that he’s nobody’s socialist tool, the American socialist movement—most of whose adherents will be voting for Biden—has continued to expand. The Democratic Socialists of America (to which I’ve belonged since the Neolithic Age) now has more than 70,000 members and has launched a campaign to raise that number to 100,000. At its current rate of growth, its membership rolls may well surpass that of the Debs-era Socialist Party, which claimed 118,000 dues-payers at its early-20th-century zenith.

The rebirth of American socialism has come complete with any number of explanatory and exhortatory books, the best of which was published late last month: The Socialist Awakening: What’s Different Now About the Left, a brief, incisive volume by veteran political journalist, longtime democratic socialist, and sometime American Prospect contributor John B. Judis. The book is Judis’s third in a series published by Columbia Global Reports. In it, as in its two predecessors The Populist Explosion and The Nationalist Revival, Judis tracks the consequences of the failures of globalized capitalism to sustain working- and middle-class prosperity and stability since the 2008 collapse, and the concomitant rise of both left and right in the wake of those failures. As is not the case in the other two volumes, however, Judis writes not merely as an analyst of an ideology’s return but as an advocate for its necessity, with particularly shrewd assessments of how the new American socialism can advance, and, alternatively, how it may marginalize itself into irrelevance.

More from Harold Meyerson

Judis focuses on two periods in American socialism’s long history: the Debs Era of 1900 through 1920, and the Bernie Sanders Surge, which began to incubate with the Occupy movement of 2011 but didn’t really take off until Sanders began running for president in 2015. Both were periods in which capital concentrated wealth and power, in which little of either trickled down to most Americans, in which the New Deal’s semi–social democratic reforms had either not yet been enacted or had been discarded in the post-1970 turn toward laissez-faire.

Sanders has always made it plain that socialist leader Eugene V. Debs was his hero, but in Judis’s telling, the key to Sanders’s zeitgeist-changing success was his move away from the socialist insularity that Debs espoused. While nominally remaining a political independent, Sanders won election to Congress on a social democratic platform of greater regulation of capital, greater power for workers, an expansion of social welfare and economic rights, and a pledge that he’d caucus with the Democrats. When he began running for president in 2015, Sanders made clear his model of socialism was the Scandinavian mixed economy. But as Judis recounts, after Columbia University historian Eric Foner sent him an open letter that emphasized a more American pedigree for socialist initiatives, Sanders took the hint. As I recounted in the Prospect, in Sanders’s two speeches that he billed as his definition of socialism—one given at Georgetown University in 2015, the second at George Washington University in 2019—he cited Franklin Roosevelt and Martin Luther King as his forebears in the struggle for socialist reforms.


In keeping with that expansive definition, Judis emphasizes the broad socialist “network” that’s emerged today, which extends well beyond DSA card-carriers. It includes a range of progressive think tanks (like the Economic Policy Institute and the Roosevelt Institute) and magazines; most importantly, it includes not just the avowed socialists in elected office but a host of progressives whose politics are indistinguishable from the socialists’ politics, as Elizabeth Warren’s were from Sanders’s.

Expanding that network, as socialists like union leaders Sidney Hillman, A. Philip Randolph, and Walter Reuther did during the New Deal and the postwar period, will be as important, if not more important, to the social democratization of today’s United States than the growth of DSA per se, Judis contends. What could retard that growth, he continues, would be continuing the hold that a relatively small group of orthodox Trotskyists now have over DSA’s leadership. The majority of DSA members, he argues, are Berniecrats, happy to work for socialist and other progressive candidates seeking office as Democrats. (I believe he’s right about this.) They understand, as Sanders does and as DSA founder Michael Harrington did, that third-party politics are a dead end in the current configuration of the American electoral system, and that socialists have won power in democracies only when allied with other progressives on behalf of social democratic programs. Such an approach is anathema to the neo-Trotskyist cadres in DSA, for whom a kind of socialist identity politics eclipses both class politics and that of a 21st-century popular front.

Judis also makes the case for a socialist version of nationalism, at which many in today’s socialist movement will look askance. So long as democratic nations offer the one kind of government where majority rule holds sway, though, I think Judis has a point. While capitalism has had no trouble going global (in part to escape the regulations enacted by democratic nations), socialism cannot yet call on any planetary democratic body to reform the global economy. Moreover, people’s support for welfare states funded with their taxes, Judis points out, seldom extends beyond their nation’s borders. To advance a slightly different viewpoint, it’s worth noting that the nation that has given the highest share of its GDP in foreign aid—sometimes to insurgent movements, like the African National Congress—was Sweden under the Social Democrats. Of course, that was when Sweden also had the world’s most expansive welfare state for its own citizens.

Judis writes not merely as an analyst of an ideology’s return but as an advocate for its necessity.

As events would have it, the publication of Judis’s book coincides with the premiere of a film that seeks to introduce and normalize socialism to American viewers. Indeed, The Big Scary ‘S’ Word, a film by documentarian Yael Bridge, will have its first festival screening later today.

In Judis’s terminology, The Big Scary ‘S’ Word is a film about the broad socialist network, and broad left history, rather than a look at, say, the American Socialist and Communist Parties, or at DSA today. The focus is on progressives in motion, then and now, and their connection, explicit or implicit, to socialists and socialism, as distinct from the substance of their involvement in the socialist movement as such. Rather than disentangle the socialist and nonsocialist threads that came together to make the civil rights movement, for instance, the picture simply documents the socialism of Martin Luther King. Some of the environmental protests it shows may not have been populated by socialists, but they’re juxtaposed with interviews with Naomi Klein in which she connects a socialist perspective to any serious effort to save the planet. There’s a marvelous segment, replete with old films and photos, on the socialists’ 40-year control of Milwaukee’s city government, but no discussion of the social democratic meliorism of Victor Berger, the Milwaukee socialist leader and a contemporary of Debs who did not share Debs’s antipathy to reformist socialism. For that, you need to consult Judis’s book, which is pitched at a narrower audience than Bridge’s film.

Thursday, October 8, 2020

Journal Entry: 10.8.20 Desolation Row


Larry Summers summarized on CNN: the consequences of Trump's cancellation of any stimulus "until after the election": more unemployment, less output, lower incomes, more death, more poverty, more global dysfunction -- and -- a DOUBLE recession. 

I went to bed right after the fly landed on Pence. At least he was civil. But Kamala Harris wiped him out from the start. Imagine Adolf Eichmann, charged with mass murder in Nazi concentration camps, offering copies of his condolence letters to his victim's families as examples of his pathos for their loss. 200,000 dead from Covid, the worst record in the world, and he offers prayers for them!

Despite Trump voter suppression effort, his campaign appears floundering, especially since the debate, and since his COVID infection. But between now and the first quarter of 2021, when relief might appear, we may be at the mercy of this neo Nazi garbage, with his ability to launch big provocations both nationally and internationally. 

The great Night Soldiers spy series by Alan Furst features a Polish Officer in the Spring and Summer of 1939, torn from his marriage and family hopes and aspirations planned for the Fall, by the Nazi invasion in September. The legendary Polish cavalry rode to defend the nation  against German tanks and aircraft. The marriage was ruined, as was the future. The Polish Officer became both a Russian, and a British spy.


Wednesday, October 7, 2020

Journal Entry: 10-7-20 -- Lipstick On a Pig


Lipstick on a pig

jcase

There will be no stimulus bill until the first quarter of 2021. And even that depends on Biden being elected. Trump decided yesterday to abandon the stimulus talks between Mnuchin and Pelosi. But he was really putting "lipstick on a pig", as a Bloomberg commentator termed it. The neo-fascist Republican block in the House and Senate were always opposed to any "stimulus" other than a tax cut for themselves. For the public, these turds advocate the the old Jesse Helms contempt for the working class -- "the hungry dog hunts harder." The most you will get out of Trump may be an extension of unemployment if he wins -- but who knows what that level of derangement will really produce!

And Trump's actions prove he agrees with "the people are dogs", despite his daily gaslighting ("a specific type of manipulation where the manipulator is trying to get someone else (or a group of people) to question their own reality, memory or perceptions"),   and catfishing ( "a deceptive activity where a person creates a sockpuppet presence or fake identity on a social networking service, usually targeting a specific victim for abuse or fraud"). 

Democrats, especially progressives, want in the order of 6 Trillion: frontloaded to fight the virus and extend UI and PPP benefits, and rescue state and local governments;  backloaded to focus on infrastructure of the kind outlined in the Thrive agenda, a revised green new deal enhanced with addressing inequality, racism and reformed labor relations It has been endorsed by a rising number of unions. It will take winning the House, Senate and the presidency. Biden will have to go bold and big. I am sure he knows this since literally EVERYONE in the advising business is telling him their version of "go big". But doing it will require both skill and hardball tactics against the ultra right, neo-fascist menace.

It helps to have an outline of the actual future, instead of lots of posturing. But between now and the hoped-for first quarter of 2021 Bob Dylan's Desolation Row, and its tragedies, will rule. Communities will have little protection other than themselves. The dangers are high. Outcomes are being driven by both lunacy in high places, AND, grave externalities from climate change, grave social contradictions and conflicts in the US, and many Western nations,  and rising global instability as many states fail in the face of the combined pandemic/depression. It could take 10 years, and world wars, to get to the hoped-for 2021, if externalities deepen the crisis, and its associated horrors.


The Job Openings and Labor Turnover Survey shows hiring failed to improve: Congress must act to fix massive jobs shortfall [feedly]

The Job Openings and Labor Turnover Survey shows hiring failed to improve: Congress must act to fix massive jobs shortfall
https://www.epi.org/blog/the-job-openings-and-labor-turnover-survey-shows-hiring-failed-to-improve-congress-must-act-to-fix-massive-jobs-shortfall/

Last week, the Bureau of Labor Statistics (BLS) reported that, as of the middle of September, the economy was still 10.7 million jobs below where it was in February. Job growth slowed considerably over the last few months and the jobs deficit in September was easily over 12 millionfrom where we would have been if the economy had continued adding jobs at the pre-pandemic pace. Today's BLS Job Openings and Labor Turnover Survey (JOLTS) reports job openings softened from 6.7 million in July to 6.5 million in August while layoffs and quits both dropped. While the slowdown in layoffs is promising, the drop in quits is a concern. Hiring in August was on par with what we experienced in July. The U.S. economy is seeing a significantly slower pace of hiring than we experienced in May or June—hiring is roughly where it was before the recession, which is a big problem given that we have more than 12 million jobs to make up. No matter how it is measured, the U.S. economy is facing a huge job shortfall.

One of the most striking indicators from today's report is the job seekers ratio, that is, the ratio of unemployed workers (averaged for mid-August and mid-September) to job openings (at the end of August). On average, there were 13.1 million unemployed workers while there were only 6.5 million job openings. This translates into a job seeker ratio of two unemployed workers to every job opening. Another way to think about this: for every 20 workers who were officially counted as unemployed, there were only available jobs for 10 of them. That means, no matter what they did, there were no jobs for 6.6 million unemployed workers. And this misses the fact that many more weren't counted among the unemployed. Without congressional action to stimulate the economy, we are facing a slow, painful recovery.

As winter approaches and many families face eviction and hunger, it is essential that Congress provide relief to all of those unemployed workers who have no hope for employment and are desperately trying to make ends meet. The first dose of austerity exhibited by the loss to the vital enhanced unemployment insurance benefit in August is already taking a toll on job creation. At this slowing pace of job growth, it will take years to return to the pre-pandemic labor market.

It didn't have to be this way. With additional aid to state and local governments as well as reinstituting the $600 weekly boost to unemployment insurance (UI), it is likely that job growth could be over 10 million jobs higher through the next year (5.3 million for state and local aid plus 5.1 million for UI extensions). Unfortunately, continued federal inaction will make it far harder in coming months to claw back the jobs lost during the pandemic.

Quick reminders about the Job Openings and Labor Turnover Survey (JOLTS):
  • JOLTS data provide information on all pieces that go into the net change in the number of jobs. These components include hires, layoffs, voluntary quits, and other job separations (which includes retirements and worker deaths). Putting those components together reveals the overall (or net) change.
  • JOLTS data provide information about the end of one month to the end of the next, whereas the monthly employment numbers provide information from the middle of one month to the middle of the next.

 -- via my feedly newsfeed

Tuesday, October 6, 2020

Ted Boettner: Inequality is Robbing Workers of Pay in the Ohio River Valley

Inequality is Robbing Workers of Pay in the Ohio River Valley

https://ohiorivervalleyinstitute.org/inequality-is-robbing-workers-of-pay-in-the-ohio-river-valley/

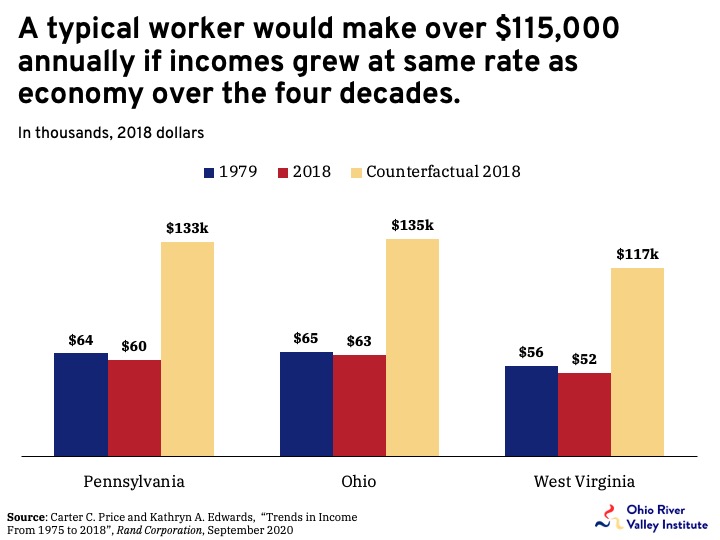
Workers in West Virginia should be making $117,000 a year on average — and they would be too, if only we had pursued the same economic strategies we had in the 1970s. Instead, we've taken power away from workers, lowered taxes on the wealthy, and designed an economic system that redistributes money upward. That $117k figure may sound implausible, but it's not. In fact, it comes from a detailed new study by the Rand Corporation.

The study finds that the upward redistribution of income over the last four decades has taken trillions of dollars from workers. We've know for several decades that income inequality has been growing in the United States, mainly from a lack of bargaining power of workers and other rules that have stacked the deck on working families. This paper looks at the massive growth in income inequality over the last 45 years by comparing growth trends in income (e.g. wages) and gross domestic product (GDP). This research is unique in that it asks what would have happened to income growth for workers in different income brackets had it grown at the same rate as the economy or gross domestic product (GDP) . The paper finds that:

…the cumulative effect of four decades of income growth below the growth of per capita gross national income and estimate that aggregate income for the population below the 90th percentile over this time period would have been $2.5 trillion (67 percent) higher in 2018 had income growth since 1975 remained as equitable as it was in the first two post-War decades. From 1975 to 2018, the difference between the aggregate income for those below the 90th percentile and the equitable growth counterfactual totals $47 trillion.

In other words, the inequality that is baked into our economic system costs workers approximately $2.5 trillion each year. To put this in perspective, the study finds that the typical full-time worker – the one in the middle of the income distribution or median – would have an annual earnings of about $92,000 a year instead of the $50,000 they make today. That's a difference of $42,000 annually.

In the states that make up the upper Ohio River Valley, a similar pattern is found, with typical workers making less today than they did in 1979 after adjusting for inflation (see graph below). For example, a full-time, year-around worker in West Virginia makes $4,000 less today (2018) than they did in 1979. If this worker's income grew at the same rate as the state's GDP from 1979 to 2018, they would have made $65,000 more in income or $117,000 instead of $52,000.


While there are a few limitations of the study, it paints a powerful picture of one of the greatest problems of the past 40 years. Economic inequality is at the root of most of  society's problems. As income gets to an adequate level, almost all of the bad indicators – such as poor health and short life expectancy, higher crime rates and childhood trauma, poverty, and low educational attainment – tend to decline. Scholars are also finding out that income and wealth inequality is bad for economic growthdemocracy, and even the rich.

To combat income and wealth inequality in the United States and in the Ohio River Valley, it is going to take action at the state and federal level. This includes enacting policies that will unrig the system that has favored the rich over the last 40 years, including improving labor standards (e.g. raising the minimum wage and making it easier to join unions), raising taxes on the wealthy,  breaking up monopoly power, transitioning to a clean energy economy, and enacting universal policies, such as Medicare for All, a child allowancefree public child care and pre-ktuition-free college, and many more.

New wealth data show that the economic expansion after the Great Recession was a wealthless recovery for many U.S. households [feedly]

New wealth data show that the economic expansion after the Great Recession was a wealthless recovery for many U.S. households
https://equitablegrowth.org/new-wealth-data-show-that-the-economic-expansion-after-the-great-recession-was-a-wealthless-recovery-for-many-u-s-households/

Overview

The Federal Reserve's 2019 Survey of Consumer Finances, or SCF, released last week, shows that the wealth of many U.S. households never recovered from the shock of the Great Recession more than a decade ago. Although mean (average) wealth of all households in 2019 exceeded mean wealth in 2007 by 9 percent, median (midpoint) wealth declined by 19 percent over the same time period. If housing wealth is excluded, the median wealth of all households in 2019 is about equal to median wealth in 2007.

These several data points show that U.S. households barely recovered their levels of nonhousing wealth over the more than 10 years of economic expansion since the Great Recession of 2007–2009, compared to pre-Great Recession levels. And the data show that households are now less likely to have a home to leverage as a financial asset.

Moreover, disaggregating the data by demographic characteristics shows that many of these households fared worse than the average. Whiter, wealthier, and more educated households fared better, although even these struggled to recover their pre-Great Recession levels of wealth, demonstrating just how broadly felt the slow recovery of wealth has been.

That so many of these households would soon enter the coronavirus recession, which began in February 2020, in worse condition than they entered the Great Recession is a dire warning. This current recession is already deeper and families have fewer resources to draw on to protect themselves from its effects. The upshot: Further aid from Congress is critical to avoid repeating the mistakes made as the United States recovered from the Great Recession.

Disaggregating the 2019 SCF data to discover what kinds of households entered the coronavirus recession with the resources to insulate themselves from job losses, furloughs, or ill health caused by COVID-19, the disease caused by the virus, would help policymakers understand what kinds of households need help now to weather this economic and public health crisis. Notably, however, sample sizes in the Survey of Consumer Finances are not large enough for Hispanic and Black communities to support the fine levels of disaggregation necessary for policymakers to target aid effectively and efficiently.

Furthermore, sample sizes for Asian Americans and Pacific Islanders are so small that the Federal Reserve has to withhold these data from public disclosure entirely, grouping them into a catch-all "other" category to protect the privacy of these households. This is why the Fed should consider oversampling these communities.

The analyses below compare 2007 levels of wealth, from before the Great Recession, to 2019 levels of wealth, and represent peak-to-peak comparisons that tell us whether households with particular demographic characteristics are better- or worse-positioned for the current recession than they were in 2007 for the Great Recession. Most graphs in this column include shaded 95 percent confidence intervals to show levels of statistical uncertainty for these calculations.

White households had a stronger recovery of wealth

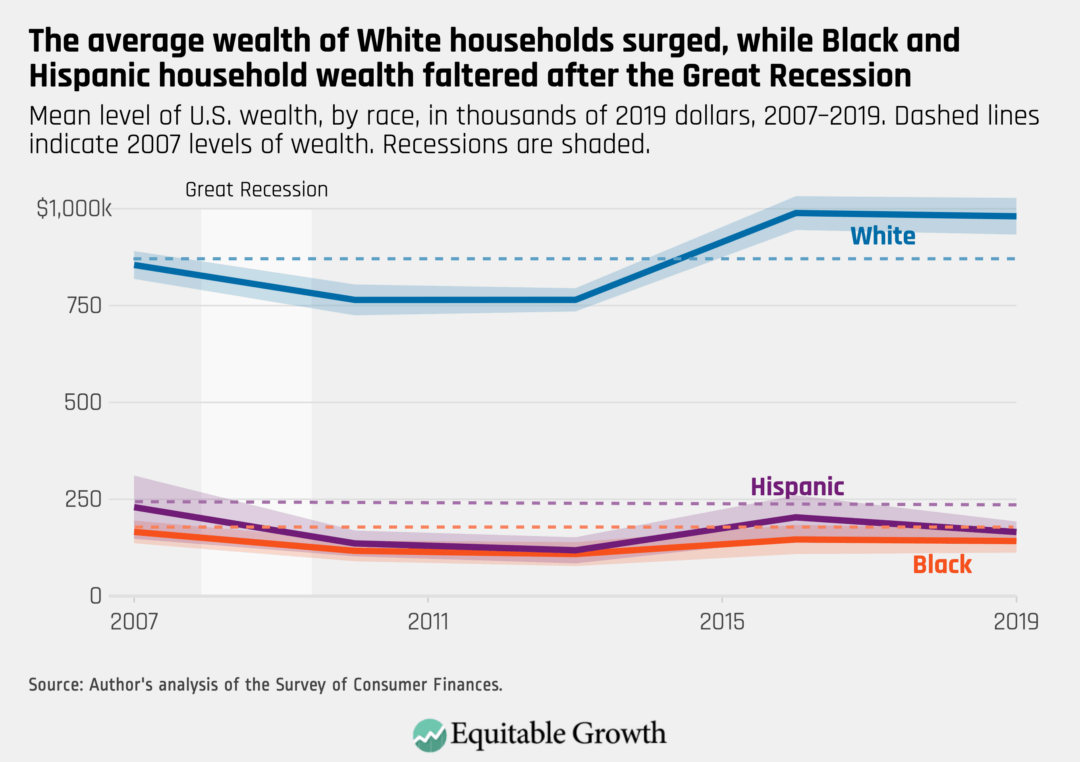
Households that fully recovered their pre-Great Recession levels of wealth are overwhelmingly White. While White households, on average, have 15 percent more wealth in 2019 than in 2007, Black households have 14 percent less wealth, and average wealth for Hispanic households declined by 28 percent. (See Figure 1.)

Figure 1

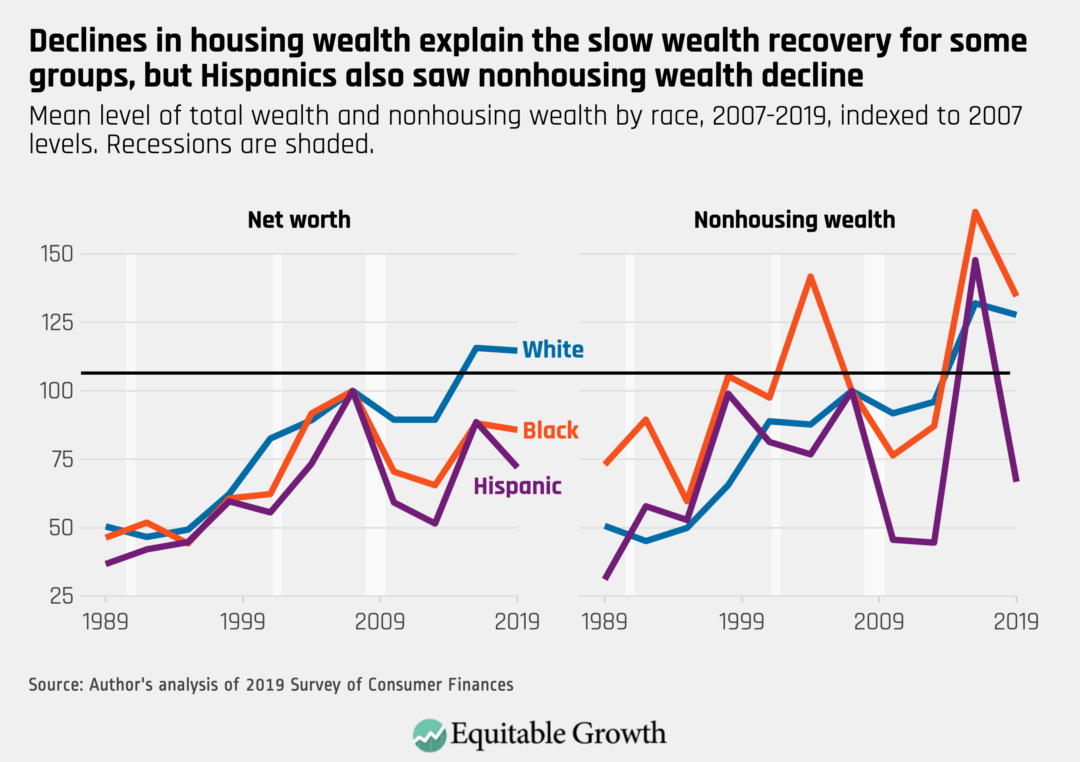
Declines in housing wealth in the United States are responsible for a significant portion of wealth declines since before the Great Recession, but they are not the whole story. The nonhousing wealth of White households between 2007 and 2019 increased by 28 percent after the Great Recession, while it surged 35 percent for Black households and dropped 33 percent for Hispanic households. That average Black wealth declined even though nonhousing wealth surged in the group indicates how important housing wealth is to Black households. (See Figure 2.)

Figure 2

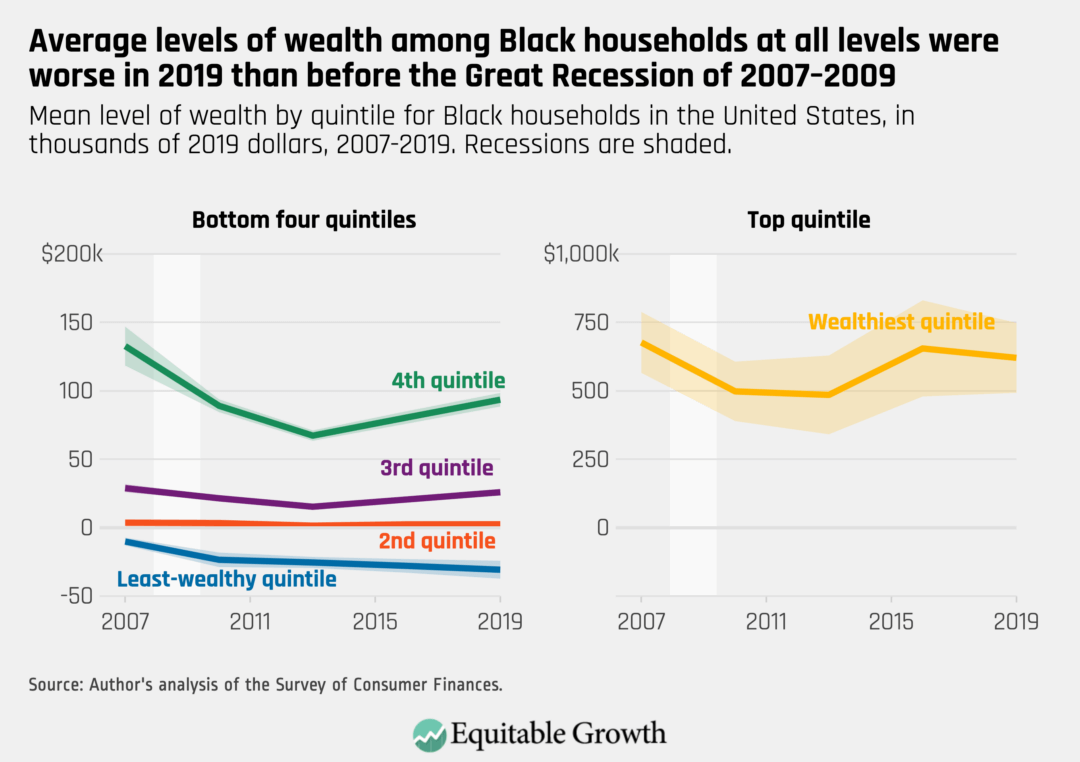
Even high-income Black households did not fully recover what they lost during the Great Recession. Classified by wealth, every quintile of Black households saw declines in their net worth. Middle-quintile Black households saw their net worth decline by 10 percent between 2007 and 2019, for example. (See Figure 3.)

Figure 3

Wealthier households had the strongest recoveries of wealth

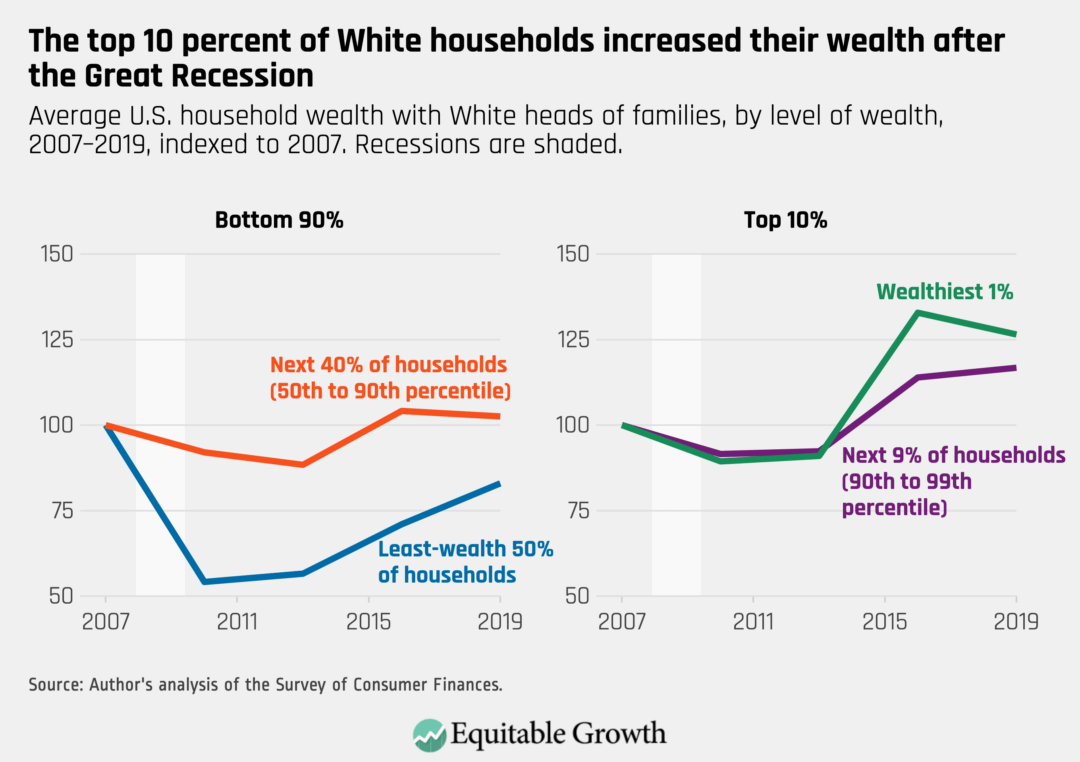
U.S. households headed by White people were more likely to recover or exceed their pre-Great Recession levels of wealth, with much of this growth happening at the top of the wealth distribution. In contrast, households outside the top 10 percent experienced relatively weak recoveries.

In fact, White households in the bottom half of the wealth distribution only recovered about 83 percent of their pre-Great Recession wealth peak. Those in the next 40 percent of the wealth distribution (from the 50th percentile to the 90th percentile) saw very modest gains of about 2.5 percent. Those at the top, however, built a significant amount of wealth. The top 1 percent increased their wealth by 26 percent during the post-Great Recession economic recovery. (See Figure 4.)

Figure 4

Less-educated households struggled to build wealth in the recovery

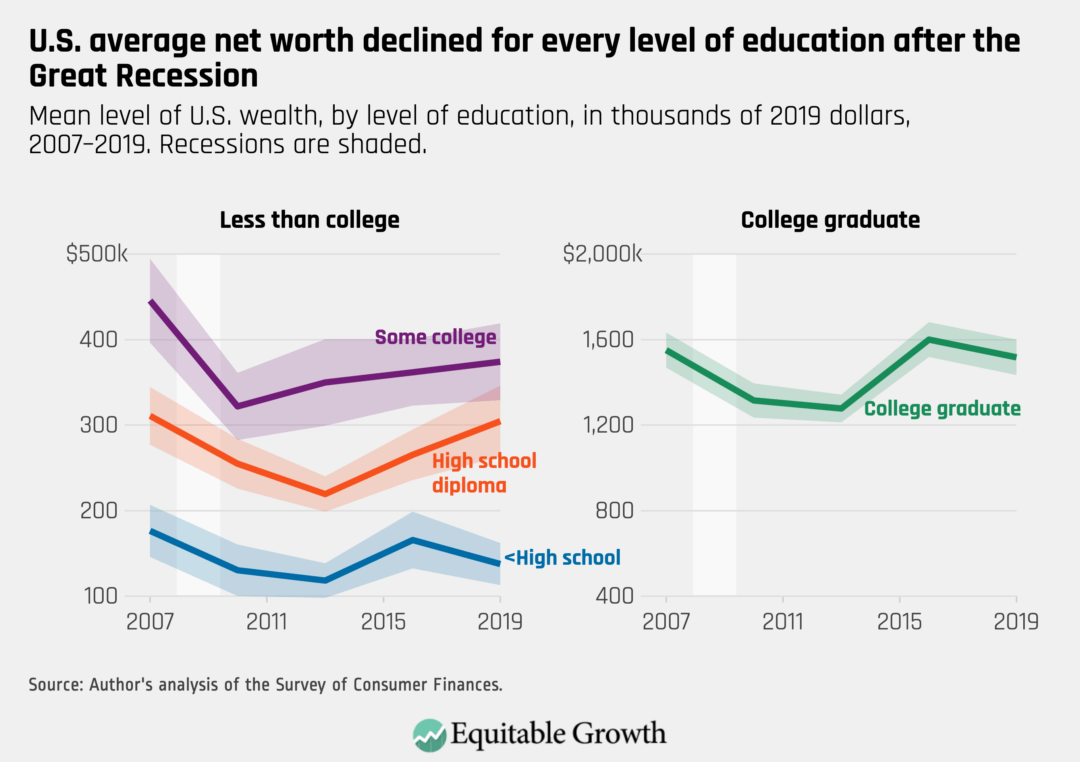
Americans grouped by education experienced a similar divide before and after the Great Recession. Those with a bachelor's degree or more just barely recovered their pre-Great Recession levels of wealth. But Americans in every other educational group saw significant declines in their wealth, although Americans with high school diplomas came closest to recovering. (See Figure 5.)

Figure 5

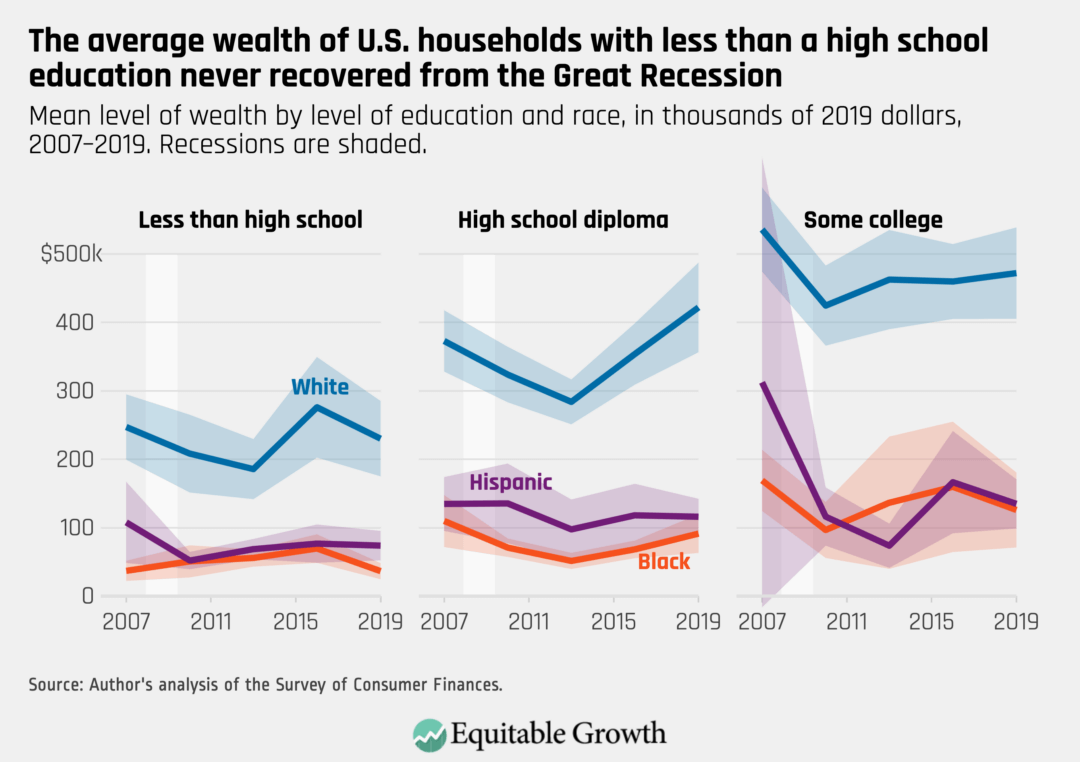
This is true even for White households at lower levels of education. Those White households with a head of the family who had less than a high school diploma or with a GED or high school diploma only narrowly recovered their 2007 levels of wealth by 2019. Sample sizes for White households with a head of the family who had some college experience are relatively small, and it is difficult to draw inferences in this group.

Again, the differences are more stark for households of color. White households with less than a college degree saw their wealth increase by 3 percent between 2007 and 2019. But Black households without a college degree entered 2020 and the coronavirus recession two months later with an average of 17 percent less wealth than what they had in 2007. (See Figure 6.)

Figure 6

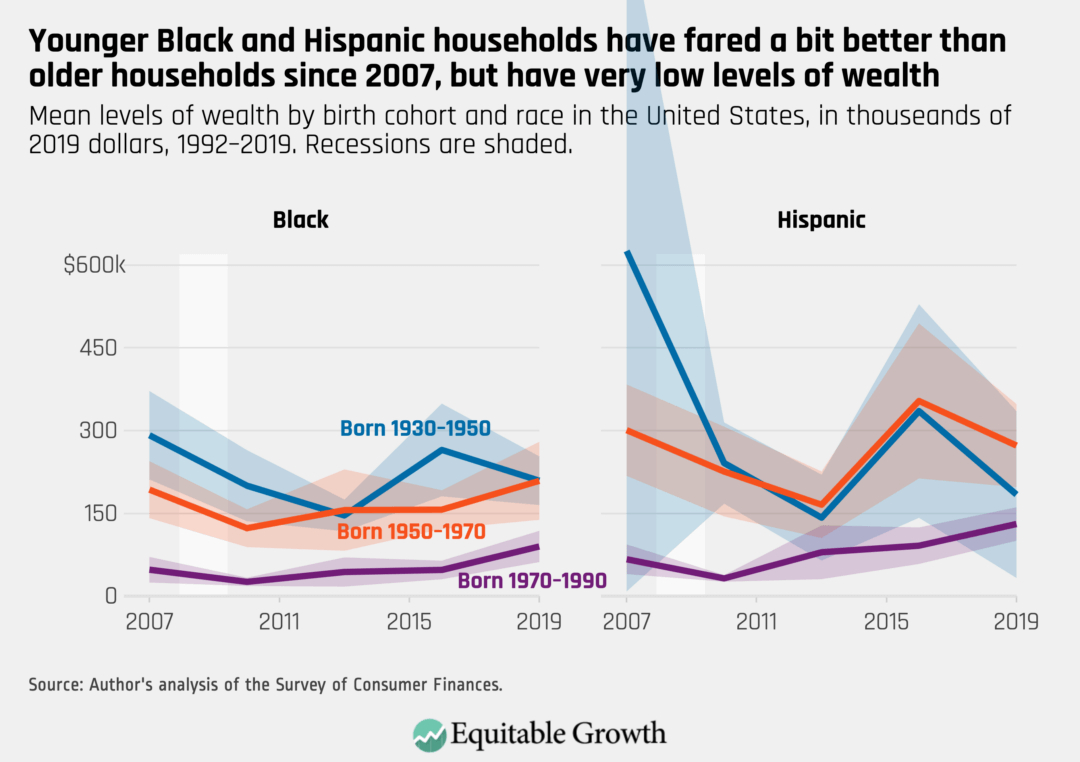
Younger Black households built wealth during the recovery but continue to have very low levels of wealth

From a generational perspective, Black households have levels of wealth far lower than even the youngest White households. A White household where the head of the family was born between 1970 and 1990 had average wealth of about $500,000 in 2019, whereas even the oldest Black households only had average wealth of around $200,000.

Black and Hispanic households of any age had very low levels of wealth entering the Great Recession. But younger generations of both Black and Hispanic households fared better over the course of the recovery after the Great Recession. Black households with heads of families born between 1970 and 1990 increased their wealth by 65 percent between 2007 and 2019, but nonetheless still have very low levels of wealth. (See Figure 7.)

Figure 7

The wealth of many U.S. households is lower entering the coronavirus recession than right before the Great Recession of 2007–2009

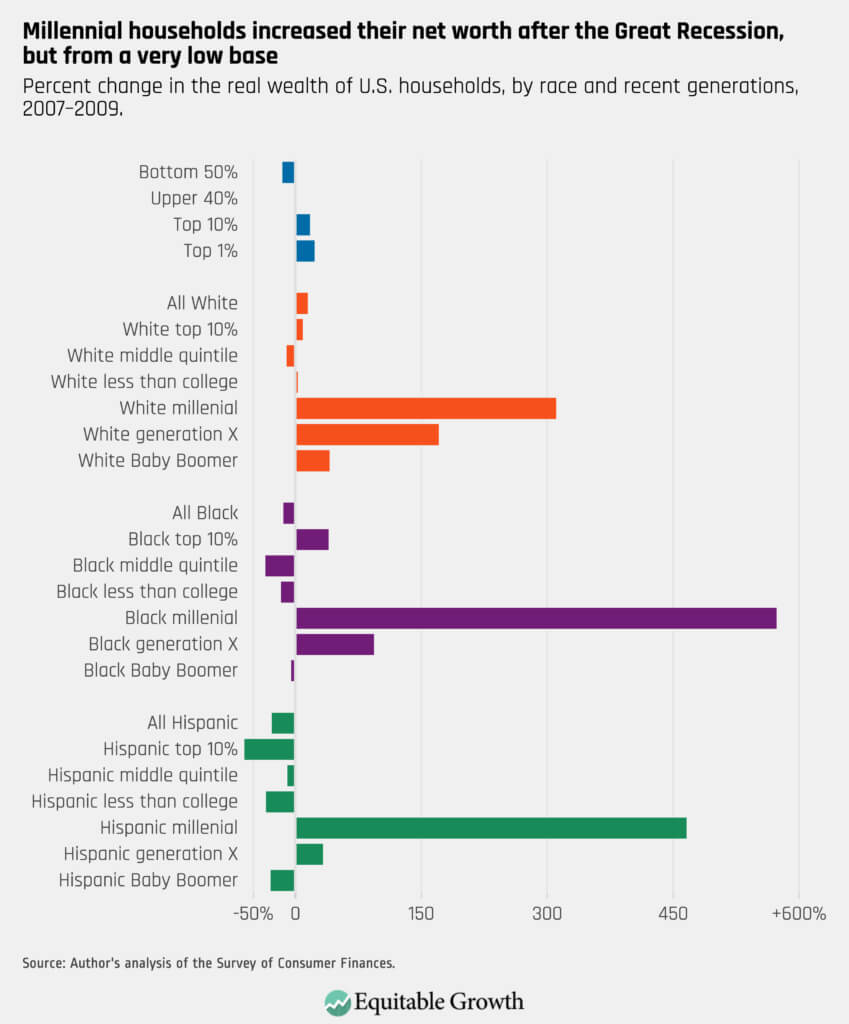
Despite the record-long economic expansion of more than 10 years following the Great Recession, many households never fully recovered, pointing to weaknesses in wage growth and in the availability of high-quality jobs that dogged the recovery for nearly its entire length. Notably, millennial households built a considerable amount of wealth during that recovery, but only because they started with very low base levels of wealth, and they had less housing wealth to lose during the Great Recession. (See Figure 8.)

Figure 8

Conclusion

The lessons learned about U.S. household wealth across a variety of measures after the Great Recession demonstrate that the relative paucity of policymaker action after the economic gains from the American Recovery and Reinvestment Act of 2009 fed into the U.S. economy led to an overall weak recovery in U.S. household wealth. Today, that leaves many Americans struggling through the coronavirus recession. And that's why Congress should not repeat the mistakes made by past Congresses, but rather continue to act forcefully to make sure there is a robust recovery.

Another important takeaway from the data in the Federal Reserve's 2019 Survey of Consumer Finances is that the huge error bars around Hispanic and, to a lesser extent, Black household estimates of wealth in the graphs above demonstrate how uncertain these estimates become when analyzing the data at the intersection of race and education, age, gender, or other demographics. To support better decomposition of groups, the Federal Reserve should consider instituting oversamples of households of color.


 -- via my feedly newsfeed

US Income Inequality, According to CBO [feedly]

US Income Inequality, According to CBO
https://conversableeconomist.blogspot.com/2020/10/us-income-inequality-according-to-cbo.html

 -- via my feedly newsfeed

For a basic overview of income inequality in the United States, the Congressional Budget Office provides a useful overview in its report "The Distribution of Household Income, 2017" (October 2020). Versions of this report have been coming out for about 40 years. The CBO uses what is called the Statistics of Income, which is based on a nationally representative sample of individual income tax returns collected by the Internal Revenue Service. Thus, the data for income in 2017 wasn't first reported on tax returns until 2018, and it takes a couple of years before the late tax returns have arrived and the comprehensive dataset can be compiled. This CBO report is really just about presenting the data: you need to draw your own policy conclusions. 

Here's some basic information on growth of income at different points in the distribution over time. The rise in incomes for households in the bottom fifth or "quintile" of the income distribution, not including taxes and transfer payments, was about 35% from 1979 to 2017. The rise in incomes for the middle quintiles of the income distribution was about the same. But here's the pattern at the top. 

Clearly, income growth at the very top of the distribution has been at higher rates. For perspective, the average income (before taxes and transfers) for those from the 99th percentile up to the 99.9th percentile was $1.11 million in 2017; for those from the 99.9th percentile to the 99.99th percentile, average income was $5.67 million; for those at the 99.99th percentile and above, average income was $48.54 million. 

Interestingly, the source of income that has grown the fastest is what is called "business income"--that is, income from owning or running a business which at the top level includes often includes partnerships in large law firms, running as series of car dealerships, and other substantial enterprises. The CBO writes: 

As a share of income among households in the top 1 percent, business income rose from 11 percent in 1979 to 23 percent in 2017. Meanwhile, average capital income (including capital gains) grew at a slower pace than other forms of income. As a result, it declined as a share of income among households in the top 1 percent of the distribution, from 54 percent of income in 1979 to 41 percent in 2017. Labor income remained roughly constant at about one-third of income among such households from 1979 to 2017.
How have the effects of of federal redistribution changed over time, in terms of taxes and programs that tend to redistribute income? Here's a graph showing average federal tax rates over time by income group, where the average federal tax includes income taxes, payroll taxes that finance Social Security and Medicare, and corporate income taxes attributed to those who receive such income. The general pattern is generally lower federal tax rates as a share of income for those at the bottom, and not much overall change in federal tax rates for those at the top. (More detailed breakdowns of federal tax rates for the top 0.1% and 0.01% look a lot like the top 1%.)

What are the effects of federal tax and spending programs in reducing inequality, and how have these effects changed over time? The Gini coefficient is a way of measuring inequality that varies from 0 to 1, with zero being complete equality of incomes. The top line in this figure show rising inequality over time in market incomes. The second line shows the change in this inequality after taking into account Social Security and Medicare payments. The third line shows the change in inequality after taking into account means-tested federal programs aimed at those with lower incomes. The bottom line shows income inequality after taking in account all of the previous changes plus shifts in taxes. 

One basic theme that emerges from figures like this is that no matter what metric you choose, income inequality is up. However, it's also true that the combination of government programs has ameliorate the rise in market-based income inequality to some extent: for example, measured by market-based incomed, the Gini rises 13 percentage points from 1979 to 2017  (from .472 to .602), but looking at the bottom line that includes all income and transfers, the rise is about 8 percentage points (from .351 to .434).  

Finally, it's also interesting to note that in terms of reducing inequality, a lot of the action happens because of taking Social Security and Medicare into account--that is, it's mainly reducing inequality for elderly Americans. Also, a big chunk of that reduction in inequality--the Medicare portion--doesn't put any income directly into the pockets of the elderly, but instead goes to paying health care providers.