Friday, December 17, 2021

‘Amazon won’t let us leave’: Tornado creates modern Triangle Shirtwaist Factory [feedly]

'Amazon won't let us leave': Tornado creates modern Triangle Shirtwaist Factory
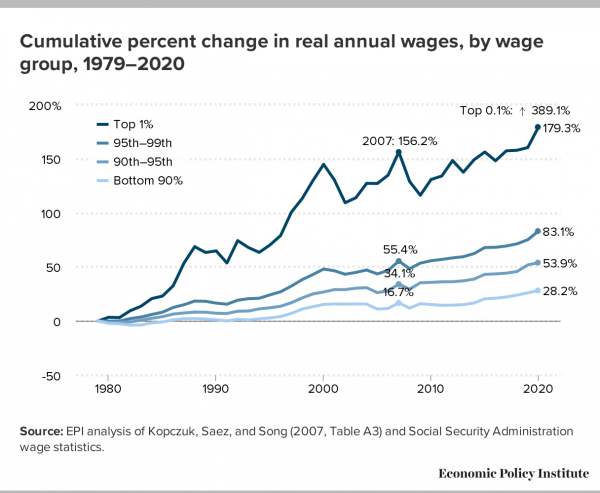
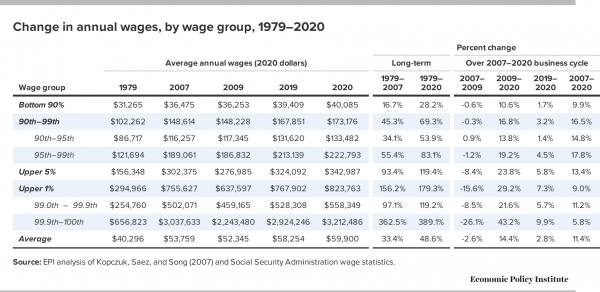
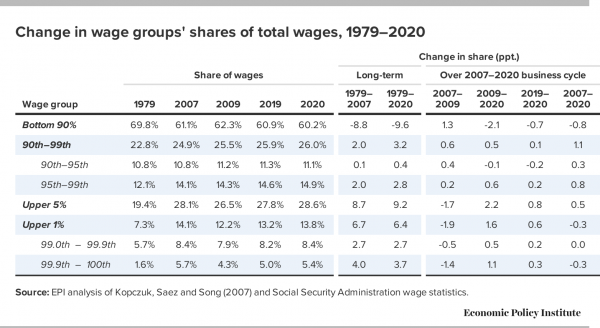
https://www.peoplesworld.org/article/amazon-wont-let-us-leave-tornado-creates-modern-triangle-shirtwaist-factory/

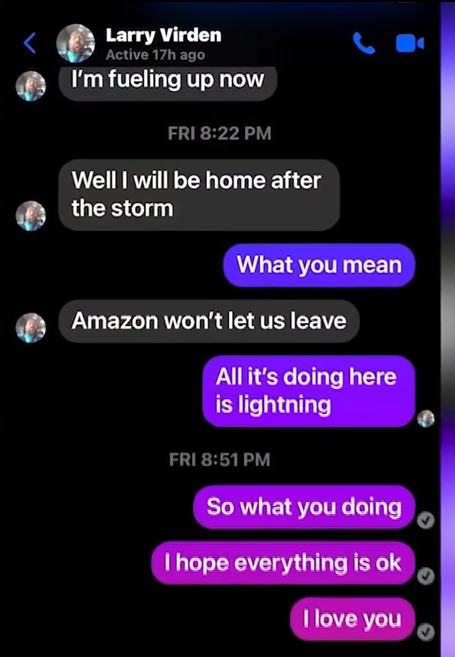
"Amazon won't let us leave." That was the last message 46-year-old Larry Virden sent his girlfriend on the evening of Dec. 10. A short time later, a tornado blasted through Edwardsville, Illinois, and shredded the Amazon fulfillment center warehouse where Virden worked. When the roof of the massive facility came crashing down, he and five co-workers were left dead. Cherie Jones, his partner of 13 years, is now in mourning and explaining to their four children why dad is never coming home.

According to Jones, Virden could have gotten back in time to shelter with his family—if only his employer hadn't ordered workers to stay at the facility. Amazon claims supervisors moved to get as many workers as possible to designated safe spots in the warehouse, but Virden's final text is a rallying cry against the willful anti-worker negligence of the retail behemoth.

'Amazon won't let us leave': A screenshot shared with the media by Larry Virden's girlfriend, Cherie Jones, shows the last text message he sent before a tornado killed him and five co-workers at an Amazon fulfillment center in Edwardsville, Ill., on Dec. 10.

Amazon wasn't the only corporation implicated in tornado-linked worker deaths that night, though. Eight more were killed at the Mayfield Consumer Products Company's candle factory in Mayfield, Ky. There, too, workers wanted to flee an approaching twister, but bosses reportedly told them they'd be fired if they left the plant. The damage in Mayfield was even more devastating than that in Edwardsville; all that's left of the candle factory is a pile of rubble.

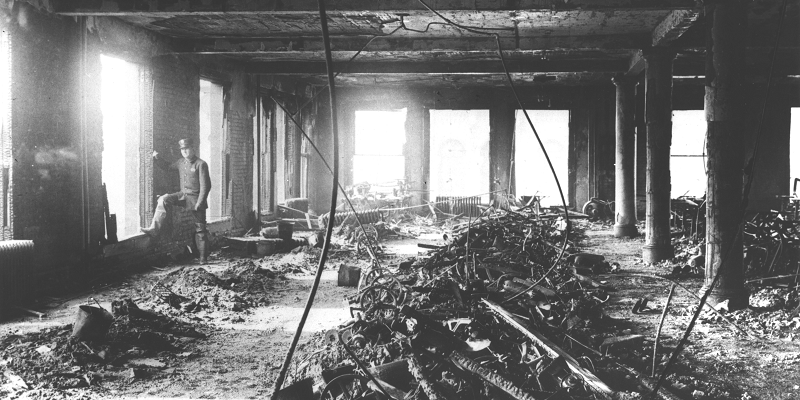
The two sites—which are essentially crime scenes—invite comparisons to the Triangle Shirtwaist Factory fire of 1911. There, 146 garment workers—123 women and girls and 23 men, many of them Italian and Jewish immigrants—were killed when flames engulfed a high-rise clothing plant in New York City's Greenwich Village. Many were burned alive, others suffocated from the smoke, while dozens more desperately jumped or fell from windows.

The Triangle company had chained the doors of the factory closed, a common practice among bosses at the time in order to keep workers from taking breaks or leaving before managers said they could.

Immediately after the tragedy, socialist leader Rose Schneiderman told the members of the Women's Trade Union League: "I would be a traitor to those poor burned bodies if I came here to talk good fellowship…. Too much blood has been spilled…. It is up to the working people to save themselves. The only way they can do that is with a strong working-class movement."

A wave of worker organizing and agitation for workplace safety was sparked by the blaze. Survivors of the fire became major advocates for unions as the only way workers might collectively protect themselves from corporate greed. Fire eyewitness Frances Perkins took up the investigation for the state and was instrumental in putting safety front and center; later she would be the United States' first woman Secretary of Labor under FDR and said the Triangle fire was "the day the New Deal was born."

From the ashes arose the country's first laws mandating fire safety and improved building codes, regulations for working conditions, improved sanitary facilities, limiting of working hours for women and children, and official encouragement for collective bargaining. Everything from minimum wage laws to workers' compensation to the creation of OSHA can be traced back to the long reform drive that followed the disaster. Triangle became a turning point in the struggle to save workers from being literally killed for the sake of profits.

The interior of the Triangle Shirtwaist Factory following the deadly fire of 1911. An estimated 146 workers, mostly women and girls, were killed when they couldn't escape the flames because bosses had chained the doors of the factory shut. | Public Domain / via U.S. Department of Labor

It was chains on doors that condemned people to death in the Triangle fire 110 years ago; orders from supervisors and threats of termination achieved the same outcome in Edwardsville and Mayfield this week. Now, just like then, corporations treat workers like they are disposable.

Amazon's disaster in Illinois is not unique; it is the latest episode in a long-running tragedy. One worker who spoke to People's World, recounting how Amazon kept its New York warehouses operating even during deadly flooding recently, said, "They legitimately don't care if we die. Their profits don't suffer." People's lives are being put on the line needlessly, but corporations and the billionaires who own and run them refuse to take responsibility.

The Amazon workers who are involved with the Amazon Labor Union are taking up the challenge of stopping things like this from happening again. For the employees in its fulfillment centers, Amazon dictates every aspect of their work life—pay, benefits, working conditions, safety measures, access to telephones. The workers have no power to negotiate any of these things, even though it's their labor power which rakes in the billions for Jeff Bezos and the company's other owners.

Amazon, the union says, consistently values its profits over the people who work there. The deaths of workers like Larry Virden in Edwardsville, who were ordered to stay at work even as a deadly storm approached, are proof of that.

Workers in Amazon—and at companies like Mayfield—need unions because a union is the only way that workers can collectively leverage their power to force change. Amazon and other corporations know this, which is why they spend so much effort trying to convince employees not to join up with the union and fire workers who try to organize. And bought-and-paid-for politicians in right-to-work states like Kentucky know it too, which is why they keep anti-union laws on the books.


 -- via my feedly newsfeed

Wednesday, December 15, 2021

Wage inequality continued to increase in 2020: Top 1.0% of earners see wages up 179% since 1979 while share of wages for bottom 90% hits new low [feedly]

Wage inequality continued to increase in 2020: Top 1.0% of earners see wages up 179% since 1979 while share of wages for bottom 90% hits new low
https://www.epi.org/blog/wage-inequality-continued-to-increase-in-2020-top-1-0-of-earners-see-wages-up-179-since-1979-while-share-of-wages-for-bottom-90-hits-new-low/

Key numbers:

  • In 2020, annual wages rose fastest for the top 1.0% of earners (up 7.3%) and top 0.1% (up 9.9%) while those in the bottom 90% saw wages grow by just 1.7%.
  • The top 1.0% earned 13.8% of all wages in 2020, up from 7.3% in 1979.
  • The bottom 90% received just 60.2% of all wages in 2020, the lowest share since data began in 1937 and far lower than the 69.8% share in 1979.
  • Over the 1979–2020 period:
    • Wages for the top 1.0% and top 0.1% skyrocketed by 179.3% and 389.1%, respectively.
    • Wages for the bottom 90% grew just 28.2%.

Newly available wage data from the Social Security Administration allow us to analyze wage trends for the top 1.0% and other very high earners as well as for the bottom 90% during 2020. The upward distribution of wages from the bottom 90% to the top 1.0% that was evident over the period from 1979 to 2019 was especially strong in the 2020 pandemic year, yielding historically high wage levels and shares of all wages for the top 1.0% and 0.1%. Correspondingly, the share of wages earned by the bottom 95% fell in 2020.

Two features of the pandemic economy distorted wage patterns in 2020 and led to faster wage growth, especially at the top. One feature was that inflation grew at a subdued 1.2% rate, boosting the average real wage (but not affecting distribution). A second feature was that, as employment fell (the number of earners fell by 1.7 million, or 1.6%) and unemployment rose (to 8.1%), the composition of the workforce changed. Specifically, job losses were heaviest for lower wage workers so the mix of jobs shifted toward higher paying ones, artificially boosting average wages (see Gould) and generating faster measured wage growth especially in the bottom half.

For last year, the data (Table 1) show annual wages rising fastest for those in the top 1.0% (up 7.3%) and top 0.1% (up 9.9%) while those in the bottom 90% saw wages grow by just 1.7%.

This continuous growth of wage inequality undercuts wage growth for the bottom 90% and reaffirms the need to place generating robust wage growth for the vast majority and rebuilding worker power at the center of economic policymaking. See Mishel and Bivens (2021) for the evidence that an erosion of worker power due to excessive unemployment, eroded collective bargaining, corporate-driven globalization, weaker labor standards, new employer-mandated agreements (such as noncompetes), and supply-chain dominance explains wage suppression and wage inequality growth.

As Figure A shows, the top 1.0% and 0.1% were the clear winners over the 1979–2020 period:

  • The top 1.0% saw their wages grow by 179.3%.
  • Wages for the top 0.1% grew more than twice as fast, up a spectacular 389.1%.
  • The other segments of the top 10% also had faster-than-average wage growth since 1979, up 53.9% and 83.1%, but nowhere near as fast as the wage growth at the top.
  • In contrast, those in the bottom 90% had annual wages grow by 28.2% from 1979 to 2020.

This disparity in wage growth reflects a sharp long-term rise in the share of total wages earned by those at the very top: the top 1.0% earned 13.8% of all wages in 2020, up from 7.3% in 1979. That marks the second highest share of earnings for the top 1.0% since the earliest year, 1937, when data became available (matching the tech bubble share of 13.8% in 2000 and below the share of 14.1% in 2007). The share of wages for the bottom 90% fell from 69.8% in 1979 to just 60.2% in 2020.

These are the results of EPI's updated series on wages by earning group, which is developed from published Social Security Administration (SSA) data and updates the wage series from 1947–2004 originally published by Kopczuk, Saez, and Song (2010). This data, unlike the usual source of our other wage analyses (the Current Population Survey), allow us to estimate wage trends for the top 1.0% and top 0.1% of earners, as well as those for the bottom 90% and other categories among the top 10% of earners. This wage data is not top-coded, meaning the underlying earnings reported are actual earnings and not "capped" or "top-coded" for confidentiality. These SSA wage data are W-2 earnings which include realized stock options and vested stock awards.

Figure A
Figure A

One constant wage dynamic in every period since 1979 has been that the wages for the bottom 90% are continuously redistributed upwards.

It is worth noting that our series on the wage growth of the bottom 90% corresponds closely to the Social Security Administration's series on median annual earnings: Between 1991 and 2020, the real median annual wage grew 23.5%, not far below the 28.2% growth for the bottom 90%.

It is also noteworthy that the wage growth for the bottom 90% over the 1979–2019 period (ending at the end of the last recovery rather than the bottom of a new recession) was almost entirely concentrated in the two periods of sustained low unemployment representing 11 of the 40 years: the bottom 90%'s wage growth in the 1995–2000 and 2013–2019 periods represented 90% of all the wage growth ($7,320 of $8,144) over the entire 1979–2019 period. The $676, or 1.7%, wage growth for the bottom 90% over 2019–2020 probably represents the special circumstances of the pandemic recession and low inflation. The shift of wages away from the bottom 90% meant that their wages rose 26.0% rather than the 44.6% increase obtained on average over the 1979–2019 period, some 18.6 percentage points faster growth. Thus, growing inequality of wages zapped wage growth for the bottom 90% by about 0.5% each year.

Table 1
Table 1

These disparities in long-term wage growth reflect a major redistribution upwards of wages since 1979, as noted earlier. The bottom 90% earned 69.8% of all earnings in 1979 but only 60.2% in 2020 (Table 2). In contrast, the top 1.0% nearly doubled its share of earnings from 7.3% in 1979 to 13.8% in 2020. The growth of wages for the top 0.1% is the major dynamic driving the top 1.0% earnings as the top 0.1% more than tripled its earnings share from 1.6% in 1979 to 5.4% in 2020, accounting for 58% of the increased wage share of the top 1.0%.

Table 2
Table 2

 -- via my feedly newsfeed

Saturday, December 11, 2021

Friday, December 10, 2021

The US Treasury Review of Economic Sanctions [feedly]

The US Treasury Review of Economic Sanctions
https://conversableeconomist.wpcomstaging.com/2021/12/09/the-us-treasury-review-of-economic-sanctions/

The use of economic sanctions by the United States has increased tenfold in the last 20 years. Is this because sanctions are working so well as a foreign policy tool? Or is it because imposing economic sanctions feels like a cost-free non-military response when there is a demand to "do something"? The Treasury 2021 Sanctions Review (October 2021) doesn't seek to answer the big picture questions, but it provide some useful background on the current status of US economic sanctions and what steps could help to make them more effective.

Here's a figure showing the rise in US use of economic sanctions since 2000 as tallied by the US Treasury's Office of Foreign Assets Control (OFAC)'s List of Specially Designated Nationals and Blocked Persons:

Here's a figure showing how the countries affected by sanctions have shifted over time.

The total count here is 37 existing sanctions programs administered and enforced by the Office of Foreign Assets Controls (OFAC). The 9,421 total sanctions at present includes over 12,000 OFAC designations and nearly 3,000 OFAC delistings, As the report explains, being listed means that "their property and interests in property are blocked.
When property is blocked (or `frozen'), title to the blocked property remains with the owner of the property and any funds constituting or arising from blocked property must be placed into a blocked, interest-bearing account at a U.S. financial institution. Blocking immediately imposes an across-the-board prohibition against transfers or dealings of any kind with
regard to the property."

In other words, if you are under these sanctions you still own your assets (at least for the present), but you can't do anything with them

The Treasury report describes what it views as some success stories of economic sanctions: freezing and seizing billions of dollars from front companies controlled by the Cali drug cartel, which contributed to breaking the organization up in 2014; preventing tens of billions of dollars from being taken by local officials in Libya after the fall of the Qaddafi regime in 2011; and the designations of over 1,600 terrorist entities and individuals, which have impaired their ability to raise money through front groups. But as the number of economic sanctions has proliferated, it's natural to wonder if they are working.

There's a skeptical case to be made here. A 2019 report from the Government Accounting Office found that the government rarely does any asssessment of whether sanctions have worked. Daniel Drezner estimates that when studies are done of economic sanctions, they seem to work less than half the time. He writes that the US has imposed "decades-long sanctions on Belarus, Cuba, Russia, Syria, and Zimbabwe with little to show in the way of tangible results." The US Treasury report is not in the business of criticizing past US applications of economic sanctions, but it does quote former Treasury Secretary Jack Lew: "We must guard against the impulse to reach for sanctions too lightly or in situations where they have negligible impact."

Instead, the Treasury report suggests some guidelines to follow for applications of economic sanctions in the future. As you read them, they may seem obvious. But remember that the reason for the guidelines is that these steps have not been happening in any systematic way.

Treasury will adopt the use of a structured policy framework in order to inform its recommendations on the use of sanctions. This framework should reflect key policy considerations and ask whether a sanctions action:

a) Supports a clear policy objective within a broader U.S. government strategy …
b) Has been assessed to be the right tool for the circumstances …
c) Incorporates anticipated economic and political implications for the sanctions target(s), U.S. economy, allies, and third parties and has been calibrated to mitigate unintended impacts …
d) Includes a multilateral coordination and engagement strategy …
e) Will be easily understood, enforceable, and, where possible, reversible …

Without this kind of process, economic sanctions will work in some cases, but much of the time will end up as just an exercise in unproductive political flexing.


 -- via my feedly newsfeed