https://www.epi.org/blog/wage-inequality-continued-to-increase-in-2020-top-1-0-of-earners-see-wages-up-179-since-1979-while-share-of-wages-for-bottom-90-hits-new-low/
Key numbers:
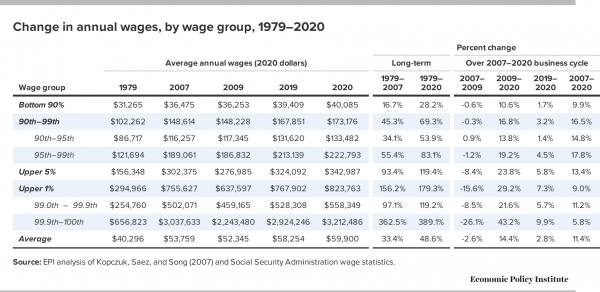
- In 2020, annual wages rose fastest for the top 1.0% of earners (up 7.3%) and top 0.1% (up 9.9%) while those in the bottom 90% saw wages grow by just 1.7%.
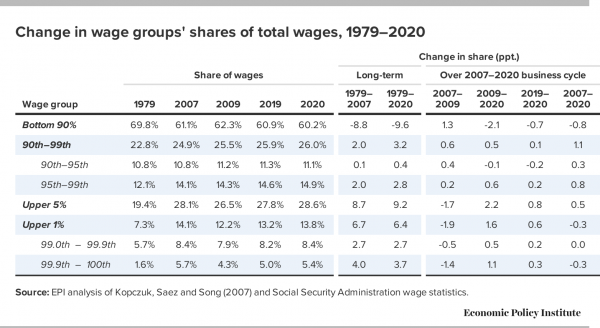
- The top 1.0% earned 13.8% of all wages in 2020, up from 7.3% in 1979.
- The bottom 90% received just 60.2% of all wages in 2020, the lowest share since data began in 1937 and far lower than the 69.8% share in 1979.
- Over the 1979–2020 period:
- Wages for the top 1.0% and top 0.1% skyrocketed by 179.3% and 389.1%, respectively.
- Wages for the bottom 90% grew just 28.2%.
Newly available wage data from the Social Security Administration allow us to analyze wage trends for the top 1.0% and other very high earners as well as for the bottom 90% during 2020. The upward distribution of wages from the bottom 90% to the top 1.0% that was evident over the period from 1979 to 2019 was especially strong in the 2020 pandemic year, yielding historically high wage levels and shares of all wages for the top 1.0% and 0.1%. Correspondingly, the share of wages earned by the bottom 95% fell in 2020.
Two features of the pandemic economy distorted wage patterns in 2020 and led to faster wage growth, especially at the top. One feature was that inflation grew at a subdued 1.2% rate, boosting the average real wage (but not affecting distribution). A second feature was that, as employment fell (the number of earners fell by 1.7 million, or 1.6%) and unemployment rose (to 8.1%), the composition of the workforce changed. Specifically, job losses were heaviest for lower wage workers so the mix of jobs shifted toward higher paying ones, artificially boosting average wages (see Gould) and generating faster measured wage growth especially in the bottom half.
For last year, the data (Table 1) show annual wages rising fastest for those in the top 1.0% (up 7.3%) and top 0.1% (up 9.9%) while those in the bottom 90% saw wages grow by just 1.7%.
This continuous growth of wage inequality undercuts wage growth for the bottom 90% and reaffirms the need to place generating robust wage growth for the vast majority and rebuilding worker power at the center of economic policymaking. See Mishel and Bivens (2021) for the evidence that an erosion of worker power due to excessive unemployment, eroded collective bargaining, corporate-driven globalization, weaker labor standards, new employer-mandated agreements (such as noncompetes), and supply-chain dominance explains wage suppression and wage inequality growth.
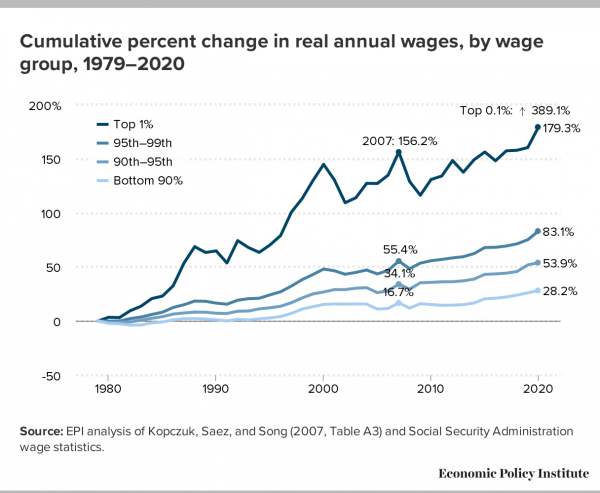
As Figure A shows, the top 1.0% and 0.1% were the clear winners over the 1979–2020 period:
- The top 1.0% saw their wages grow by 179.3%.
- Wages for the top 0.1% grew more than twice as fast, up a spectacular 389.1%.
- The other segments of the top 10% also had faster-than-average wage growth since 1979, up 53.9% and 83.1%, but nowhere near as fast as the wage growth at the top.
- In contrast, those in the bottom 90% had annual wages grow by 28.2% from 1979 to 2020.
This disparity in wage growth reflects a sharp long-term rise in the share of total wages earned by those at the very top: the top 1.0% earned 13.8% of all wages in 2020, up from 7.3% in 1979. That marks the second highest share of earnings for the top 1.0% since the earliest year, 1937, when data became available (matching the tech bubble share of 13.8% in 2000 and below the share of 14.1% in 2007). The share of wages for the bottom 90% fell from 69.8% in 1979 to just 60.2% in 2020.
These are the results of EPI's updated series on wages by earning group, which is developed from published Social Security Administration (SSA) data and updates the wage series from 1947–2004 originally published by Kopczuk, Saez, and Song (2010). This data, unlike the usual source of our other wage analyses (the Current Population Survey), allow us to estimate wage trends for the top 1.0% and top 0.1% of earners, as well as those for the bottom 90% and other categories among the top 10% of earners. This wage data is not top-coded, meaning the underlying earnings reported are actual earnings and not "capped" or "top-coded" for confidentiality. These SSA wage data are W-2 earnings which include realized stock options and vested stock awards.
One constant wage dynamic in every period since 1979 has been that the wages for the bottom 90% are continuously redistributed upwards.
It is worth noting that our series on the wage growth of the bottom 90% corresponds closely to the Social Security Administration's series on median annual earnings: Between 1991 and 2020, the real median annual wage grew 23.5%, not far below the 28.2% growth for the bottom 90%.
It is also noteworthy that the wage growth for the bottom 90% over the 1979–2019 period (ending at the end of the last recovery rather than the bottom of a new recession) was almost entirely concentrated in the two periods of sustained low unemployment representing 11 of the 40 years: the bottom 90%'s wage growth in the 1995–2000 and 2013–2019 periods represented 90% of all the wage growth ($7,320 of $8,144) over the entire 1979–2019 period. The $676, or 1.7%, wage growth for the bottom 90% over 2019–2020 probably represents the special circumstances of the pandemic recession and low inflation. The shift of wages away from the bottom 90% meant that their wages rose 26.0% rather than the 44.6% increase obtained on average over the 1979–2019 period, some 18.6 percentage points faster growth. Thus, growing inequality of wages zapped wage growth for the bottom 90% by about 0.5% each year.
These disparities in long-term wage growth reflect a major redistribution upwards of wages since 1979, as noted earlier. The bottom 90% earned 69.8% of all earnings in 1979 but only 60.2% in 2020 (Table 2). In contrast, the top 1.0% nearly doubled its share of earnings from 7.3% in 1979 to 13.8% in 2020. The growth of wages for the top 0.1% is the major dynamic driving the top 1.0% earnings as the top 0.1% more than tripled its earnings share from 1.6% in 1979 to 5.4% in 2020, accounting for 58% of the increased wage share of the top 1.0%.
-- via my feedly newsfeed

No comments:
Post a Comment