Tuesday, January 14, 2020

Piketty: After the climate denial, the inequality denial [feedly]

amen to this analysis.


After the climate denial, the inequality denial

Thomas Piketty

https://www.lemonde.fr/blog/piketty/2020/01/14/after-the-denial-of-climate-change-the-inequality-denial/

In the wake of the denial of global warming, now on the wane, at least superficially, are we at present witnessing the denial of the rise in inequality?

This is obvious in the case of the French government where all the efforts undertaken since 2017 appear to be guided by the idea that the country is suffering from a surfeit of equality. Hence the tax rewards for the wealthiest when the government came into office; hence similarly its inability to understand the demand for justice expressed in the social movement at the moment. In real terms, a universal retirement pension scheme is possible, but only on condition that everything is done to improve the small and medium pensions, even if this involves increased efforts on the part of the highest salaries and the wealthiest. Those who are at the top of the scale must understand that aging and the end of life mean new challenges in terms of dignity and equality.

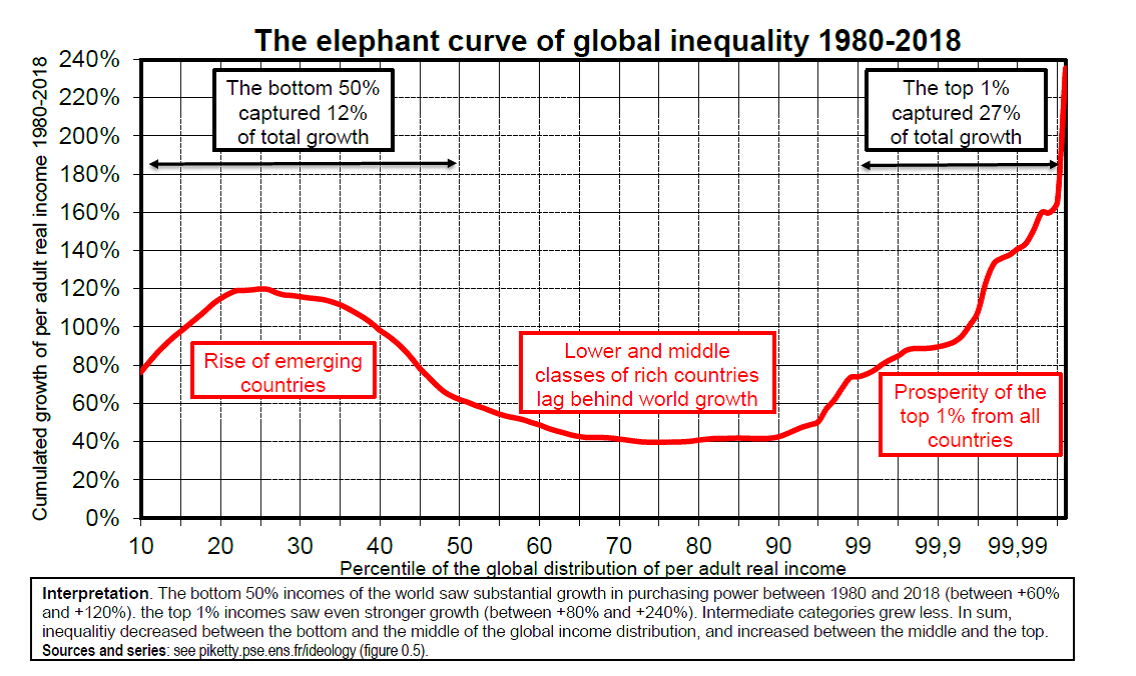
More generally speaking, while the demand for justice is expressed in numerous protest mobilisations all over the world, in the media associated with business circles we witness an attempt to relativise the rise in inequality over recent decades. True, nobody expects the weekly publication, The Economist, to be in the lead in a campaign for equality. But this is no reason to manipulate the facts, once they have been established.

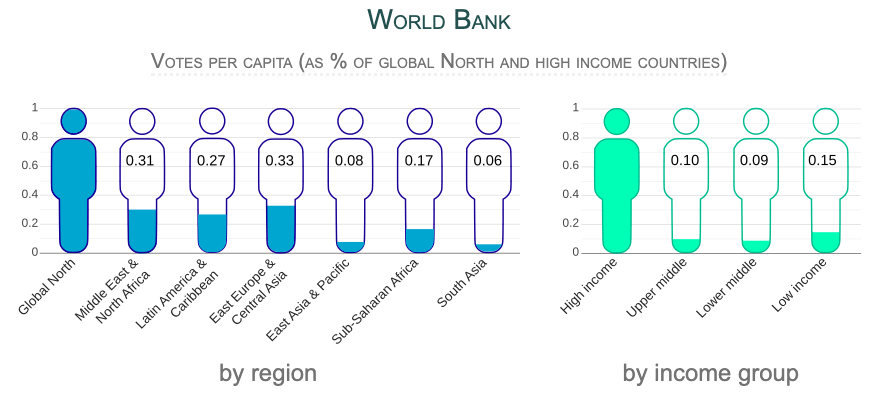
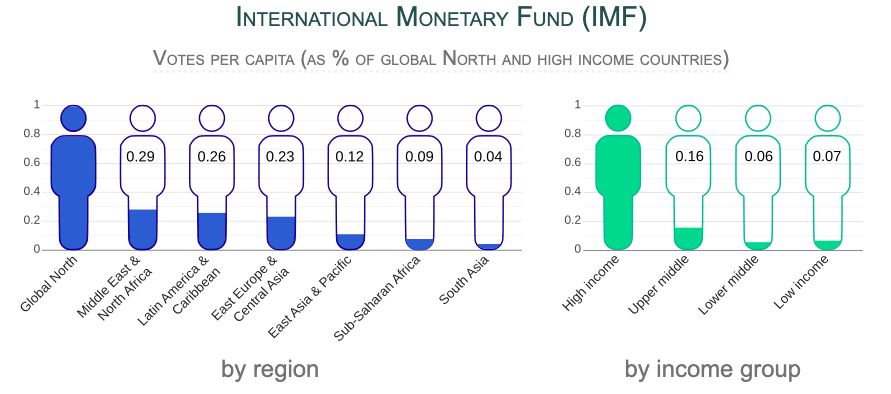
It is all the more regrettable because the governments of the rich countries have not made any genuine attempt to promote transparency concerning the distribution of wealth since the crisis in 2008. Given all the declarations on tax havens, the automatic transmission of banking data etc., one would have expected that financial opacity would have decreased. In theory, all countries should now be equipped to collect and publish banking and fiscal data enabling them to follow the development of the distribution of wealth according to the level of income and of wealth, in particular for the top incomes. With the suppression in several countries of progressive-type taxes on wealth and on the income from capital, in several instances (in particular in France, but also equally in Germany, in Sweden or in the United States) we even see a decline in the public data available.

Too frequently, researchers, as do public administrations, find themselves using the rankings published in magazines, data which do indeed indicate the growing prosperity of the wealthiest but which do not fulfil the conditions of transparency and rigour one has the right to expect to inform a reasoned democratic debate on these essential issues. We are supposedly living in the age of "big data".  This is undoubtedly true for the major private monopolies which have the right to unashamedly gain access to our personal data. But as far as public statistics on the distribution of wealth and its necessary redistribution are concerned, in reality we live in an age of considerable opacity which is perpetuated by all those who oppose the reduction of inequalities.

Furthermore we too often forget that we will not be able to resolve environmental challenges unless we make the reduction of inequality central to political action. We must undoubtedly fundamentally rethink the indicators enabling us to measure economic and social progress. To begin with, it is urgent for governments and the media to stop using the concept of 'gross domestic product' (GDP) and concentrate on that of 'national income'. Let me remind you of the two main differences: national income is equal to gross domestic product, minus the incomes which go to foreign countries (or increased by the income entering from foreign countries, depending on the situation of the country), and minus the consumption of capital (which should, in principle, include the consumption of natural capital in all its forms).

To illustrate, let's take a simple example. If 100 billion Euros of hydro-carbons are extracted from the ground (or fish from the seas), then we have an additional 100 billion Euros of GDP (gross domestic product). But as the stock of hydro-carbons (or of fish) has decreased by an equal amount, then national income has not increased by one iota. If, furthermore, the fact of burning the hydro-carbons contributes to making the air unbreathable and the planet uninhabitable then the national income produced in this manner is in reality negative, provided that the social cost of the carbon emissions have been taken into account correctly.

The fact of using national income and national wealth rather than GDP and focussing on distribution and not on averages is not enough to solve all the problems, far from it. It is equally urgent to multiply the indicators specific to climate and the environment (for example, the volume of emissions, the quality of the air or the diversity of the species). But it would be a mistake to imagine that one could conduct the forthcoming debates with these indicators alone, dispensing with any reference to income or wealth. To develop new standards of justice acceptable by the greatest number, it is essential to be able to measure the efforts demanded of various social groups. This requires the ability to be able to compare levels of wealth within a given country as well as between countries and over the course of time. We will not save the environment by consigning all concepts of income or growth to the dustbin.

On the contrary, if ecological parties neglect social issues, they may well, on the contrary, find themselves confined to a privileged electorate and thus enable the maintenance in power of conservatives and nationalists. The challenges of climate change and the rise in inequalities can only be resolved simultaneously. All the more reason, I believe, to combat this dual denial by tackling them with a single voice.


 -- via my feedly newsfeed

Apartheid in the Global Governance System [feedly]

A good review of voting strength in global economic institutions.

Apartheid in the Global Governance System
https://www.globalpolicyjournal.com/blog/14/01/2020/apartheid-global-governance-system

Jason Hickel explores how the voting systems at the WB & IMF contribute to the perpetuation of global inequality.

In my research I have argued that rising global inequality is driven in large part by power imbalances in the global economy, in that rich countries have disproportionate influence when it comes to setting the rules of international trade and finance.   

Nowhere is this problem more apparent than when it comes to voting power in the World Bank and the International Monetary Fund (IMF), two of the key institutions that govern global macroeconomic policy. People tend to assume that representation in these institutions must be fair and democratic, modeled perhaps along the lines of the UN General Assembly.  But quite the opposite is true.  Indeed, they are fundamentally anti-democratic.

The problem starts at the top.  The leaders of the World Bank and IMF are not elected, but are appointed by the US and Europe: according to an unspoken agreement, the president of the World Bank is always an American, while the president of the IMF is always European.

On top of this, voting power in these institutions is skewed heavily in favour of rich countries.  The United States has 16% of the votes, which gives it de facto veto power over all major decisions (decisions need 85% of the vote in order to carry). 

The next largest vote-holders are France, Germany, Japan and the UK – all members of the G7. Middle- and low-income countries, which together constitute some 85% of the world's population, have only about 40% of the vote.

If we look at the voting allocations in per capita terms, the inequalities are revealed to be truly extreme.  For every vote that the average person in the global North has, the average person in the global South has only 1/8th of a vote, or 0.12.  Here is how it breaks down by region and income group in the two institutions.

WB

Graphic by Huzaifa Zoomkawala. Data sources here.

IMF

Graphic by Huzaifa Zoomkawala. Data sources here.

Not only is there minority control over global economic policymaking, there is also a clear racial imbalance at play: on average, the votes of people of colour are worth only a tiny fraction of their counterparts.  If this was the case in any particular country, we would be outraged.  We would call it apartheid, or a racial dictatorship.  And yet a form of global apartheid operates right at the heart of international economic governance, and hardly anybody talks about it.  

In some cases the differences between countries are particularly striking.  Take Bangladesh and Nigeria, both of which were British colonies.  A British person's vote today is worth 41 times more than a Bangladeshi's vote, and 23 times more than a Nigerian's vote - and this is many decades after the end of colonial rule.

This brings us to an important point.  The inequalities that characterize voting power in the WB and IMF have their roots in the colonial period.  After all, these institutions were founded in 1944.  Countries that were colonies at the time – and even countries that were former colonies – were integrated into the system on intentionally unequal terms.  Of the original 44 member states, the G7 held 62% of the total voting power, with well over half of that monopolized by the US. 

It is remarkable, when you think about it, that the institutions that govern global economic policy – and which determine domestic economic policy in countries across the global South, in the form of structural adjustment programmes – are in effect colonial institutions.  They were designed with colonial principles in mind and they remain fundamentally colonial in character to this day, some seven decades after decolonization.

Indeed, the anti-democratic character of the WB/IMF is precisely why they were able to impose structural adjustment in the first place, which ended up devastating global South economies. Such ruinous policies would never have been acceptable under democratic principles.

There have long been calls by global South countries to democratise the World Bank and the IMF.  For decades these were blithely ignored. A reform package was finally introduced in 2010, but it turned out to be little more than window dressing: only 3% of voting power was shifted from rich countries to poor countries (about half of that going to China), and the US retained its veto.

Defenders of this apartheid-style system point out that voting power is allocated according to the monetary contributions that each nation makes to the WB/IMF in the form of share purchases.  Theoretically, bigger economies can make bigger contributions.  Apologists argue that this is a legitimate approach: it makes sense, they insist, that bigger economies should have more say in decisions related to the global economy.  

First of all, it doesn't actually work this way. China is the world's second biggest economy.  India's economy is bigger than France's.  Despite their economic size, they are not allowed to purchase more shares - indeed they are actively prevented from doing so.  The fact that big global South economies have been relegated to minority status in the World Bank and IMF suggests that there is another logic at play altogether – a racial logic, a colonial logic.

In any case, think of the implications of the claim that voting power should be allocated according to income. In any national political system we would reject the notion that the rich should have more voting power than the poor - it would be repulsive.  And yet, astonishingly, such overt plutocracy is routinely promoted by those who defend the WB/IMF system.

Ultimately, the voting system at the WB/IMF contributes to the perpetuation of global inequality.  The system ensures that the very countries that became rich by plundering the global South during the colonial period are now, by dint of their plunder, empowered to determine the rules of the global economy in their own interests, indefinitely.  Inequality begets inequality.


Dr. Jason Hickel is an anthropologist, author, and a Fellow of the Royal Society of Arts.  He has taught at the London School of Economics, the University of Virginia, and Goldsmiths, University of London, where he convenes the MA in Anthropology and Cultural Politics.  He serves on the Labour Party task force on international development, works as Policy Director for /The Rules collective, and sits on the Executive Board of Academics Stand Against Poverty (ASAP).

This first appeared on Jason's blog and was reprinted with permission.


 -- via my feedly newsfeed

Tim Taylor: The Evolution of Exchange Rate Markets [feedly]

fascinating and accessible discussion of exchange rates by Tim Taylor, refuting an early assertion by John Stuart Mill of "money's insignificance". Keynes, and Lenin, said: "the easiest way to undermine capitalism is to debauch its currency."


The Evolution of Exchange Rate Markets
http://conversableeconomist.blogspot.com/2020/01/the-evolution-of-exchange-rate-markets.html

Back in 1848, John Stuart Mill made a classic argument that money was insignificant to the essential nature of an economy, because it was only a facilitator for what really matters--the actual transactions. Mill wrote (Principles of Political Economy, Book III, Ch. VII):
There cannot, in short, be intrinsically a more insignificant thing, in the economy of society, than money; except in the character of a contrivance for sparing time and labour. It is a machine for doing quickly and commodiously, what would be done, though less quickly and commodiously, without it: and like many other kinds of machinery, it only exerts a distinct and independent influence of its own when it gets out of order.
In a globalized economy, one might similarly argue that the exchange rate market is an insignificant thing. What really matters, one might claim, is the real flows of imports and exports, or the patterns of international financial investments. However, the exchange rate market involves trades totaling  $6.6 trillion per dayThis is vastly more than needed to finance exports and imports, or to finance foreign direct investment and portfolio investment. Instead, the foreign exchange market is clearly being driven by financial transactions: specifically, those who are hedging against shifts in exchange rates, those who are trying to make a profit by trading in exchange rate markets, or both. It cannot be viewed as, in Mill's language, an intrinsically insignificant thing.

The go-to source for information about exchange rate markets is the Triennial Survey conducted by the Bank for International Settlements (an international organization run by the central banks and monetary authorities of 60 different countries).  The BIS Quarterly Review for December 2019 offers a five-paper symposium with details on the size and operation of exchange rate markets. Here, I'll mention some of the highlights from the overview paper by  Philip Wooldridge, "FX and OTC derivatives markets through the lens of the Triennial Survey."  The five papers that follow in the issue are:
A basic question in the issue is how to account for the fact that the size of exchange rate markets expanded by roughly 30% from $5.1 trillion per day in the April 2016 survey to $6.6 trillion per day in the April 2019 survey. Again, this rise cannot be explained by a rise in exports and imports, or by a rise in international foreign direct investment and portfolio investment, which aren't nearly large enough to be explain a foreign exchange market of this size.

One shift is that exchange rate trading is happening with shorter-term financial instruments. As a result, they need to be traded more often during a calendar year. Wooldridge writes:
The trading of short-term instruments grew faster than that of long-term instruments. This mechanically increased reported turnover because such contracts need to be replaced more often. Schrimpf and Sushko (2019a) emphasise that the trading of FX swaps, which is concentrated in maturities of less than a week, rose from $2.4 trillion in April 2016 to $3.2 trillion in April 2019 and accounted for most of the overall increase in FX trading.
Another shift is that exchange market trades involving currencies of emerging market countries is on the rise:
While globally trading continued to be dominated by the major currencies, in particular the US dollar and the euro, in FX markets the trading of emerging market currencies grew faster than that of major currencies. As discussed by Patel and Xia (2019), the share of emerging market currencies in global FX turnover rose to 23% in April 2019 from 19% in 2016 and 15% in 2013.
In my reading, the biggest underlying changes relate to what Wooldridge calls "electronification," which is the pattern that more exchange rate transactions are happening through electronic or automated trading. The cost of exchange rate transactions has fallen, but the cost of the information technology infrastructure for carrying out those transactions has risen. 

This shift helps to explain the pattern just mentioned, that exchange rates markets have become more likely to operate through a series of short-term transactions. In addition, more of the exchange rate market is happening in a few major financial centers. Wooldridge writes: 
"In FX markets, London, New York, Singapore and Hong Kong SAR increased their collective share of global trading to 75% in April 2019, up from 71% in 2016 and 65% in 2010. Trading in OTC interest rate derivatives markets was also increasingly concentrated in a few financial centres, especially London. Schrimpf and Sushko (2019a) attribute this geographical concentration to network externalities. For example, it is more cost-effective to centralise counterparty and credit relationships, or technical and legal infrastructures, in a handful of hubs than to spread them across many countries. The faster pace of trading also increased the advantages of locating traders' IT systems physically close to those of the platforms on which they trade."
In addition, electronification of exchange rate markets has made it possible for investors who want to do high-frequency automated trading to participate, including hedge funds and what are called "platform-traded funds" (which operate in a way similar to exchange-traded funds). Of course, this change fits with the other patterns in exchange rate markets, like more short-term trades and a greater concentration of this trading in big financial centers. 

For those of us who will always bear the emotional scars from the meltdowns of financial markets during the Great Recession, the rapid growth of exchange rate market raises natural concerns over whether this rapid rise in exchange rate markets should raise concerns about financial risks that could in theory spill over into the rest of the global economy. At least so far, these concerns seem fairly muted. 

Behind the financial scenes, exchange rate transactions are ultimately handled by "dealers," of whom there are about 75 in the world at present. What if some of the major dealers become involved in a pattern of trading where they are exposed to risk, and end up going broke? However, a large share of exchange rate transactions are now carried out through central "clearinghouse" financial institutions.  The clearinghouse helps to match up buyers and sellers for transactions in exchange rate markets. The result is that while the number of exchange market transactions has risen, the amount of money truly at risk (once offsetting transactions are taken into account, has actually declined. Wooldridge writes: 
The marked pickup in the trading of FX and OTC derivatives between the 2016 and 2019 surveys did not lead to an increase in outstanding exposures. To be sure, since 2015 the notional principal of outstanding OTC derivatives has trended upwards, and at end-June 2019 it reached its highest level since 2014. However, their gross market value - a more meaningful measure of amounts at risk than notional principal - has trended downward since 2012. 
Just to be clear, I'm not saying that trying to trying to make money in foreign exchange markets or trying to hedge against movements in foreign exchange markets is low-risk. Foreign exchange markets are well-known for making sharp and unexpected movements in the short-term and medium-term, and for sticking at levels that seem "too low" or "too high" for unexpectedly long periods of time. Indeed, these features explain why the size of exchange rate markets is so large, as investors are trying either to hedge against these movements or to make a profit by anticipating them. But the rise of central clearninghouses for these markets seems to have reduced the risk that a meltdown originating in failures of the main global exchange rate dealiers will bleed into the rest of the global economy.

 -- via my feedly newsfeed

Dean Baker: The Economic Impact of War [feedly]

The Economic Impact of War
http://cepr.net/publications/op-eds-columns/the-economic-impact-of-war

Dean Baker
Truthout, January 13, 2020

See article on original site

With the surprise assassination of Qassim Suleimani, it's hard not to wonder if Trump was trying to start a full-fledged war for an election year economic boost. To be clear, economics is not ever a justification for war, but it is important to understand the impact war can have on the economy.

The basic story with spending on a war, or any other military spending, is that it provides a boost to demand in the economy. In this sense, it is like anything else that would provide a boost in demand, such as increased spending on health care, child care or housing.

If we think about spending another 1 percent of GDP on a war (roughly $220 billion this year), in addition to current spending, it would have approximately the same impact on the economy as spending another $220 billion in any other area of the economy. There will always be some differences, because some spending will lead to more employment per dollar than others, and there will be differences in the composition of employment. However, the immediate effect on output will be similar.

Whether this or any war means a net boost to demand and growth depends on the amount of slack in the economy. In an economy with lots of slack, as was the case with the U.S. economy immediately following the Great Recession, a boost of spending due to a war or anything else would have undoubtedly led to an increase in demand and employment.

We saw this in a really big way with World War II, where we were spending more than 40 percent of GDP (over $8 trillion in today's economy) at the peak. This led to huge increases in output and employment, as the unemployment rate fell to less than 2 percent.

This sort of massive increase in military spending was possible because of the enormous amount of unemployment resulting from the Great Depression. Of course, even as we put to work unemployed workers and unused productive capacity, the increase in spending was so large that we still needed rationing and wage and price controls to prevent runaway inflation.

But it is wrong to say that World War II was necessary to get the United States out of the Great Depression. We could have had a massive increase in spending on infrastructure, health care or any number of other areas that would have provided a comparable boost. There just was not the political support needed to undertake big spending increases outside of a war.

In the current political situation, that is also true. There is no way that the Republican-controlled Senate would support a substantial increase in spending on social programs, even if the House approved it. And, there is no way that even House approval could be taken for granted. This could change after the 2020 election, but there is no doubt that if we are to see any large-scale increase in spending in 2020, it will be because of war or the fear of war.

Whether this provides a boost to the economy is difficult to determine, since the 3.5 percent rate is quite low compared to rates we have seen over the last 50 years. Can we push down the unemployment rate another 0.5 percentage points to 3 percent, or perhaps even lower, without triggering a serious problem with inflation?

Anyone who claims to know the answer to that one has not been following the data closely. A few years ago, most economists argued that inflation would start to become a problem if the unemployment rate fell below 5 percent. That was obviously wrong. We still don't see evidence of inflationary pressures, but that doesn't mean the unemployment rate can go still lower without any problems.

This brings up the other part of the story. If we do start to see inflationary pressures, the Federal Reserve will move to slow the economy by raising interest rates. This will slow home building, reduce consumption fueled by mortgage refinancing, and also, to a lesser extent, reduce public and private investment. In that story, the increase in spending associated with a war doesn't lead to a gain in employment and growth, it just pulls away resources from productive areas of the economy.

Insofar as we have less public and private investment, that will mean the economy will be less productive in the future. That's a story where a war will slow growth, at least over the longer term.

This is a major difference between spending on a war and spending in areas like education, health care and clean energy. These forms of spending will have positive long-term effects on the economy, so they can be net long-term gainers even if the economy is near its capacity.

So the final answer on Trump using a war as a way to boost the economy: It is not clear that it will offer even a short-term benefit. What is clear is that war will carry a long-term cost, even before we start to consider all the deaths and ruined lives among the victims.


 -- via my feedly newsfeed

Calculated Risk: Paul Volcker on the "Existential test" facing America [feedly]

Bill McBride is a longtime expert on the housing  market, especially, being a voice warning of what became the mortgage bubble leading to the 2008 crash.
He took his warnings from Paul Volcker, an architect of the post war financial system, who, in his last testaments, clearly saw that that model is badly failing, and huge risks are piling up.

Paul Volcker on the "Existential test" facing America
http://www.calculatedriskblog.com/2020/01/paul-volcker-on-existential-test-facing.html

Fifteen years ago, in February 2005, I excerpted from a speech by former Fed Chair Paul Volcker at Stanford. That prescient speech about housing and excessive borrowing is available on YouTube. Some of Volcker's comments were: "Altogether, the circumstances seem as dangerous and intractable as I can remember. … Homeownership has become a vehicle for borrowing and leveraging as much as a source of financial security."

I shared Volcker's concerns back then.

Sadly Paul Volcker passed away in December.   Just a few months before his death, he wrote an "afterword to the forthcoming paperback edition of his autobiography". Here are a few excerpts (via the Financial Times):
By the late summer of 2018, it was already clear that the US and the world order it had helped establish during my lifetime were facing deep-seated political, economic, and cultural challenges.

Nonetheless, I drew reassurance from my mother's reminder that the US had endured a brutal civil war, two world wars, a great depression, and still emerged as the leader of the "free world", a model for democracy, open markets, free trade, and economic growth. That was, for me, a source of both pride and hope. Today, threats facing that model have grown more ominous, and our ability to withstand them feels less certain. …

Today … Nihilistic forces ... seek to discredit the pillars of our democracy: voting rights and fair elections, the rule of law, the free press, the separation of powers, the belief in science, and the concept of truth itself.

Without them, the American example that my mother so cherished will revert to the kind of tyranny that once seemed to be on its way to extinction — though, sadly, it remains ensconced in some less fortunate parts of the world.
...
Seventy-five years ago, Americans rose to the challenge of vanquishing tyranny overseas. We joined with our allies, keenly recognising the need to defend and sustain our hard-won democratic freedoms. Today's generation faces a different, but equally existential, test. How we respond will determine the future of our own democracy and, ultimately, of the planet itself.
emphasis added
Once again I share Volcker's concerns. Although most of my writing this year will be on the economy, I will be writing about U.S. politics this year.

If you aren't sure what is coming, see this post concerning the mid-term election.  

 -- via my feedly newsfeed

Robert Scott: China trade deal will not restore 3.7 million U.S. jobs lost since China entered the WTO in 2001 [feedly]

For many years, Robert Scott's trade writing at the EPI has been a foundation of the AFL-CIO's criticism of trade deals. The job losses documented, however, omit mention of the jobs created, mostly in services, and non union of course, but there WERE, and ARE offsetting jobs created. Scott loses credibility in the econ profession by such omissions. Likewise on NAFTA, the job losses were accelerating for years BEFORE NAFTA. I can testify to the fate of machine tools and textiles New England. Further, ANY trade agreement is going to partially realign work and investment in the trading partners. The important question is: is there a net gain in income and growth for all partners. Also important are any losers in the change compensated and/or retrained for the modified division of labor?Lastly -- nationalism on trade can be sucker bait for fascists like Trump. Does Scott's remedies address this? I do not think so.

Interested in other comments on this.


China trade deal will not restore 3.7 million U.S. jobs lost since China entered the WTO in 2001
https://www.epi.org/blog/china-trade-deal-will-not-restore-3-7-million-u-s-jobs-lost-since-china-entered-the-wto-in-2001/

he White House has announced plans for a ceremony to sign a "phase one" trade deal with China on Wednesday, although details of the agreement have yet to be announced. As one analyst noted, this deal may not amount to more than a hill of soybeans. It is unlikely to significantly reduce massive U.S. job losses due to growing U.S. trade deficits—the difference between imports and exports—which are dominated by trade deficits in manufactured goods. As shown in a forthcoming EPI report to be released later this month, growing U.S. trade deficits with China eliminated 3.7 million U.S. jobs between 2001 and 2018 alone (see Figure A), including 2.8 million jobs in manufacturing (details will be provided in the forthcoming report).

Figure A

Trade deficits and jobs losses with China continued to grow during the first two years of the Trump administration—despite the administration's heated rhetoric and imposition of tariffs. The U.S. trade deficit with China rose from $347 billion in 2016 to $420 billion in 2018, an increase of 21.0%. U.S. jobs displaced by those China trade deficits increased from nearly 3.0 million jobs lost in 2016 to 3.7 million jobs lost in 2018, an increase of more than 700,000 jobs lost or displaced in the first two years of the Trump administration.

Although the bilateral trade deficit with China has declined in 2019 (through November), the overall U.S. trade deficit in non-oil goods, which is dominated by trade in manufactured and farm products, has continued to increase, suggesting that trade diversion has grown in importance. These are important topics for future research.

While growing exports support some American jobs, growing imports eliminate existing jobs and prevent new job creation—as imports displace goods that otherwise would have been made in the United States by domestic workers. As a result, growing trade deficits result in increasing U.S. job losses. The top half of Table 1 shows just how much the trade deficit has grown: The U.S. trade deficit with China increased from $83.0 billion in 2001 to $420 billion in 2018. While U.S. exports to China increased in this period, growing exports were overwhelmed by the massive growth of imports from China, which increased by $437 billion in this period. 

U.S. trade deficits with China displaced 956,700 jobs in 2001 when China entered the World Trade Organization (WTO) and the number of jobs lost due to the trade deficit increased to 4,661,400 in 2018, leading to a net 3.7 million jobs lost, as shown in the bottom half of Table 1.

Table 1

The single most important ca

use of growing trade deficits with China is its history of currency manipulation and dollar misalignment that has persisted for more than two decades. And yet, the reported deal will provide extremely unfavorable terms for the United States on exchange rates, essentially locking in the current exchange rate. This deal is a step backwards on currency manipulation and misalignment.

Despite all of the tariffs and other restrictions imposed on China trade by the Trump administration, the bilateral trade deficit continued to grow between 2016 and 2018, resulting in the loss of more than 700,000 U.S. job opportunities. It remains to be seen whether bilateral and global trade balances improve in the wake of the phase one trade agreement with China, and future trade deals to come. But the phase one trade deal does not appear to address the key structural concerns with the long-term imbalance in trade between the United States and China.


 -- via my feedly newsfeed

Sunday, January 12, 2020

Calculated Risk: Comments on December Employment Report [feedly]

CR's first release of annual econ graphs on important trends is beautiful

Comments on December Employment Report
http://www.calculatedriskblog.com/2020/01/comments-on-december-employment-report.html

he headline jobs number at 145 thousand for December was below consensus expectations of 160 thousand, and the previous two months were revised down 14 thousand, combined. The unemployment rate was unchanged at 3.5%.

Earlier: December Employment Report: 145,000 Jobs Added, 3.5% Unemployment Rate

In December, the year-over-year employment change was 2.108 million jobs including Census hires.

Seasonal Retail Hiring

Typically retail companies start hiring for the holiday season in October, and really increase hiring in November. Here is a graph that shows the historical net retail jobs added for October, November and December by year.

Click on graph for larger image.

This graph really shows the collapse in retail hiring in 2008. Since then seasonal hiring has increased back close to more normal levels. Note: I expect the long term trend will be down with more and more internet holiday shopping.

Retailers hired 76 thousand workers (NSA) net in December.   Note: this is NSA (Not Seasonally Adjusted).

In October, November and December combined, retailers hired more seasonal workers than in the previous two years.

Average Hourly Earnings

Wage growth was below expectations. From the BLS: 
"In December, average hourly earnings for all employees on private nonfarm payrolls rose by 3 cents to $28.32. Over the last 12 months, average hourly earnings have increased by 2.9 percent."
This graph is based on "Average Hourly Earnings" from the Current Employment Statistics (CES) (aka "Establishment") monthly employment report. Note: There are also two quarterly sources for earnings data: 1) "Hourly Compensation," from the BLS's Productivity and Costs; and 2) the Employment Cost Index which includes wage/salary and benefit compensation.

The graph shows the nominal year-over-year change in "Average Hourly Earnings" for all private employees.  Nominal wage growth was at 2.9% YoY in December. 

Wage growth had been generally trending up, but weakened in 2019.

Prime (25 to 54 Years Old) Participation

Since the overall participation rate has declined due to cyclical (recession) and demographic (aging population, younger people staying in school) reasons, here is the employment-population ratio for the key working age group: 25 to 54 years old.

In the earlier period the participation rate for this group was trending up as women joined the labor force. Since the early '90s, the participation rate moved more sideways, with a downward drift starting around '00 - and with ups and downs related to the business cycle.

The 25 to 54 participation rate was increased in December to 82.9%, and the 25 to 54 employment population ratio increased to 80.4%.

Part Time for Economic Reasons 

From the BLS report:
"The number of persons employed part time for economic reasons, at 4.1 million, changed little in December but was down by 507,000 over the year. These individuals, who would have preferred full-time employment, were working part time because their hours had been reduced or they were unable to find full-time jobs."
The number of persons working part time for economic reasons decreased in December to 4.148 million from 4.288 million in November.   The number of persons working part time for economic reason has been generally trending down. 

These workers are included in the alternate measure of labor underutilization (U-6) that decreased to 6.7% in December.

Unemployed over 26 Weeks

This graph shows the number of workers unemployed for 27 weeks or more. 

According to the BLS, there are 1.186 million workers who have been unemployed for more than 26 weeks and still want a job. This was down from 1.219 million in November.

Summary:

The headline jobs number was below expectations, and the previous two months were revised down.  The headline unemployment rate was unchanged at 3.5%; wage growth was well below expectations.  Overall this was a disappointing report.

In 2019, the economy added 2.108 million jobs, down from 2.679 million jobs during 2018 (although 2018 will be revised down with benchmark revision to be released in February 2020).   So job growth has slowed.  

 -- via my feedly newsfeed