Tuesday, February 13, 2018

No, the stock market isn’t throwing a tantrum because the economy is “overstimulated” [feedly]

No, the stock market isn't throwing a tantrum because the economy is "overstimulated"
http://www.epi.org/blog/no-the-stock-market-isnt-throwing-a-tantrum-because-the-economy-is-overstimulated/

Conventional wisdom is firming up quickly around the story that recent stock price declines are a result of the market realizing (in proper Wile E. Coyote fashion) that the economy has overheated. This conclusion is far too premature and ignores plenty of contrary evidence.

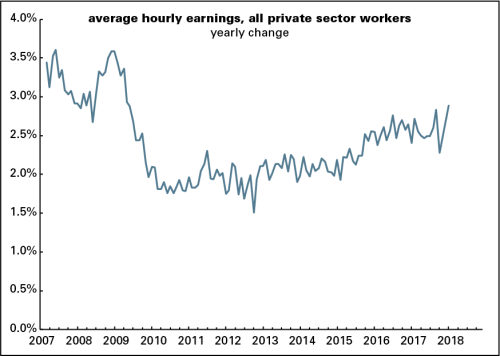
The story goes that the 2.9 percent year-over-year wage growth in last Friday's jobs report is a signal that a tsunami of inflation is heading our way. This would force the Fed to step in and stop the inflationary wave by sharply hiking interest rates. Higher interest rates, in turn, can depress stock prices both by restraining overall growth and by attracting people towards buying bonds rather than stocks. The fiscal stimulus provided by the Tax Cuts and Jobs Act (TCJA) and new higher spending caps is thought to add fuel to an already raging economic fire (side note: the TCJA is expensive in budgetary terms, but is so inefficient as fiscal stimulus that its effect is very easy to overstate).

People have gotten way ahead of the facts on this. Yes, the unemployment rate is low, but it's certainly been this low or lower for a longer span of time without the economy overheating. In 1999 and 2000, the unemployment rate averaged 4.1 percent for two years (and sat below 4 percent for five months), and core inflation nudged up for sure but never broke 2 percent (and the Fed had not even specified a 2 percent target in those years).

Other quantity-side labor market indicators, like the share of "prime-age" adults (between 25 and 54) with a job, have recovered steadily for years, but are still firmly below pre-Great Recession levels—and have certainly not reached historically low levels.

Friday's 2.9 percent wage growth is certainly on the high side of what we've seen during this recovery, but it's hardly out-of-sample large: in July 2016 and September 2017 wage growth was 2.8 percent. Further, 2.9 percent nominal wage growth is just not that high—it is actually consistent with wages pulling overall price inflation below the Fed's 2 percent target, so long as productivity growth is running at over 0.9 percent. In recent years, productivity growth has been below 1 percent, but there are certainly signs that it may be rebounding—which is exactly what you'd expect (and want) if the labor market really was tightening up and nudging up wages. We really need to see more than one month of 2.9 percent wage growth to declare the economy on fire; remember, this wage growth measure the preceding three months averaged just 2.5 percent.

For the Fed, the ultimate measure of whether the economy is overheating is greater than 2 percent inflation in the prices for personal consumption expenditures, excluding volatile food and energy prices. Does this look like an economy overheating to you?

Am I completely positive we're not at (or at least very, very near) full employment? No, but nobody can be positive that we are, unless they're determined to ignore lots of data signals. Since there is uncertainty, and because the benefits of tightening labor markets and more people getting jobs are so huge, we need to continue to probe just how low unemployment can go without sparking inflation. What we certainly don't need to do is let a stock market freakout convince us that no further progress can be made on this front. This is really important. There will be long lasting damage if we prematurely declare the economy overheated and enact policy measures to rein it in. Millions of workers will be needlessly locked out of work. Tens of millions will get smaller raises.

Finally, it's important to note that it's not just OK if we begin exceeding the Fed's inflation target for an extended period of time, it's an absolutely necessary part of recovery. We've been below the target for most of the past eight years. If we let the Fed pull back on the economy and hold inflation at no higher than 2 percent, this means the Fed will have turned the target into a hard ceiling, not a long-run average. For years the Fed has maintained that their target is an average, not a ceiling. This means that periods of sub-2 percent inflation should be matched by periods where inflation exceeded 2 percent. To change this policy approach to one that says no inflation rate of over 2 percent will ever be allowed would make us less able to deal with the next recession effectively.

To see why it would be damaging to convince people that the Fed will never allow inflation to exceed their 2 percent target, remember that when the Fed cuts interest rates, it is trying to lower the inflation-adjusted cost of borrowing. This "real" interest rate is what people and businesses make decisions based on. This real rate is just the nominal rate that the Fed sets minus the expected rate of inflation. Say that your bank offers you a 2 percent interest rate on a mortgage in an economy where prices (including your salary) are expected to rise 2 percent each year. In this case, you'd be effectively paying zero interest in inflation-adjusted terms, as the money you pay the bank each succeeding year is worth less by exactly the amount of interest you must pay. Now inflation falls to 1 percent, but your mortgage interest rate remains at 2 percent. In this case, your mortgage payment just got more onerous in inflation-adjusted terms.

Say that the Fed allows the inflation to drift up to 2 percent and then holds it firmly there in coming years. In this case, the average inflation rate over the past decade will turn out to be well less than 2 percent, and this could well ratchet our expectation of inflation downwards. This lower expected inflation means that then any given nominal rate that the Fed sets is associated with a higher real interest rate. This is a real problem given that we have run into zero interest rates often in the past, even as the economy continues to suffer. A higher rate of expected inflation gives the Fed more room to cut real rates even when nominal rates hit zero.

So, no, it's not obvious that the economy is overstimulated, and it would be unwise and damaging to act like it is, as it would leave people out of work and with less leverage to gain raises as well as hamstring the Fed's ability to fight the next recession.


 -- via my feedly newsfeed

The Trump administration’s infrastructure plan remains empty talk and will be paid for by cuts to programs that help working people [feedly]

The Trump administration's infrastructure plan remains empty talk and will be paid for by cuts to programs that help working people
http://www.epi.org/blog/the-trump-administrations-infrastructure-plan-remains-empty-talk-and-will-be-paid-for-by-cuts-to-programs-that-help-working-people/

The Trump administration has released another variation of their long-dormant infrastructure plan. Just like the previous version, the plan amounts to empty talk. To understand why, one must examine the fiscal year 2019 budget proposal, released alongside their infrastructure proposal. While the administration trumpets an infrastructure plan, their budget radically cuts federal investments.

Even their trumpeting of the stand-alone infrastructure plan is hugely misleading. Instead of the $1 trillion being claimed by the administration (already pared back from the $1.5 trillion they claimed they'd be investing in infrastructure in earlier discussions), the plan only calls for $200 billion in federal funds. Finding the rest of the $1 trillion will be left overwhelmingly to states and localities, despite the fact that they already bear the brunt of paying for public infrastructure spending. In total, state and local governments account for 77 percent of public infrastructure spending in the United States. They account for 62 percent of capital investment and 88 percent of operations and maintenance. It is odd to argue that the United States needs a substantial infrastructure push to deal with past underinvestment, and then to propose that the same system that yielded this underinvestment—relying too much on state and local governments—should just be continued. If we want a real investment in infrastructure, continuing to kick the problem to state and local governments won't solve anything.

The Trump administration will claim that their plans are different because they will leverage the private sector. This claim doesn't change anything. Private entities will not build infrastructure for free, but will expect a return on investment. That means state and local governments will have to pay for the infrastructure with taxes, tolls, or other user fees. And if state and local governments predictably dodge the task of financing and funding projects directly, public-private partnerships come with their own set of problems, as natural monopoly characteristics can leave the private partner in a position to hike tolls and degrade service quality.

Notably, the fiscal year 2019 budget appears to have gotten rid of one of the more egregious cuts in last year's budget—at least on paper. Last year's president's budget would have starved the highway trust fund by limiting its spending to current baseline revenues. But because the trust fund is reliant on a dedicated tax—the federal gasoline tax— and because this tax hasn't been increased since 1993, this meant trust fund spending would plummet. This year's budget doesn't raise the gas tax or identify any other funding source. But it does ignore the problem and pretends as if the trust fund will continue to be able to pay out money for infrastructure projects. The current trust fund gap is $138 billion, so almost 70 percent of even the meager federal commitment called for in today's stand-alone infrastructure proposal would just fill an existing hole in future investments.

The infrastructure plan is paid for by unspecified budget cuts. And whichever of the myriad cuts from the administration's fiscal year 2019 budget is chosen would be disastrous.

The vast majority of public investment is funded by the nondefense discretionary (NDD) portion of the budget. This year's budget follows last year's in gutting NDD spending and thus, public investment in the long run. Last year's president's budget called for NDD budget authority to reach an unprecedented low of 1.4 percent of GDP by 2027 (for historical comparisons, see here). The new budget follows in the previous budget's path, and NDD spending would reach 1.3 percent of GDP by 2028.

The administration's fiscal year 2019 budget also offers up gutting of social programs as one of its cuts. The budget would cut the Supplemental Nutrition Assistance Program (SNAP) by $213 billion. The budget also includes large cuts to Medicaid and Medicare, though because it lacks necessary information exactly how large is unclear. On this, we shouldn't be surprised if in the end it's intended to look much like the House and Senate budget resolution's from last year, which called for cuts of around $500 billion to Medicare and $1.5 trillion to Medicaid.

The Trump administration's infrastructure plan remains nothing but smoke and mirrors, with the addition that now it will be paid for by cuts to programs that working families rely on.


 -- via my feedly newsfeed

Monday, February 12, 2018

Re: Fwd: [socialist-econ] Henwood: Bosses get Raises, workers get Stiffed

To cut and past the NYT, I find that Edge works better than other browsers.

On 2/12/2018 6:34 PM, John Case wrote:
via sam -- the times bar on text cut and paste makes me want  to boycott them


On Mon, Feb 12, 2018 at 4:46 PM, John Case <jcase4218@gmail.com> wrote:
Bosses get Raises, workers get Stiffed


Stock markets have been swooning, in no small part because last Friday's U.S. employment report showed that average hourly earnings (AHE)—the average wage, excluding benefits, received by private sector workers—rose smartly in January. This prompted fears that inflationary pressures are mounting, wages will eat into profits, and the Federal Reserve might raise interest rates more aggressively than had been thought as recently as last Thursday. Or, as the New York Times put it in a headline, with its patented mix of dullness and alarm:

NYT scare headline

What these scaremongers aren't telling you is that it's only bosses that are getting the raises.

Here's a graph of the yearly growth in AHE.

AHE - all worker

You may notice that this series begins in March 2007. That's because the Bureau of Labor Statistics (BLS) only started reporting hourly earnings for "all workers" in March 2006. It has been reporting monthly AHE stats for "nonsupervisory" or "production" workers since 1964. Nonsupervisory workers—defined by the BLS as "those who are not owners or who are not primarily employed to direct, supervise, or plan the work of others"—are about 82% of the private sector workforce, a share that has hardly changed over the last 53 years.

Most Wall Street analysts have been focusing on the all worker series, because it's broader, and because many of them have a hard time thinking about more than one thing at a time. And if you're looking to alarmed about something, you can find a rising trend in the graph above. Yearly wage growth (not adjusted for inflation) hit a post-recession low of 1.5% in October 2012; in January 2018, it rose to 2.9%, the highest in almost nine years. Yes, the number is noisy, but there's no mistaking the rising trend.

But those who've been panicking about a wage explosion haven't bothered to look at the nonsupervisory series. That has shown no rising trend at all over the last two years. AHE for nonsupervisory workers were up 2.4% for the year ending in January—just as they were in December, and less than September 2017's 2.6%. In January 2016, the gain was 2.4%. In other words, for more than four out of five private sector workers, there's been no acceleration in wage growth—which, by the way, is barely ahead of inflation.

The BLS doesn't report AHE for supervisory workers. But since we know the nonsupervisory share of the workforce and the all-worker and nonsupervisory AHE numbers, we can estimate what the supervisory wage looks like with some middle-school math. Here's a graph:

AHE - sup vs nonsup

For the year ending in January, supervisory wages were up 3.9%, compared with 3.0% in December. Over the last three months, supervisory wages are up 6.4% at an annual rate. (In January, nonsupervisory wages averaged $22.34, and the lbo-news estimate of supervisory earnings was $47.35.) In 2015 and 2016, both series moved pretty much together, but the boss sector began pulling ahead of the bossed in early 2017, and the gap has been widening since.

The series does bounce around a lot, and it's quite possible that some of the January spike will be reversed in February. But the central point is this: the alarming acceleration in wages is not a mass phenomenon. It's for the $95,000 a year set, not the $45,000 crew.*

________________________________

*Yearly earnings are based on 2,000 hours a year times the relevant hourly wage.
--
John Case
Harpers Ferry, WV

The Winners and Losers Radio Show
7-9 AM Weekdays, The Enlighten Radio Player Stream, 
Sign UP HERE to get the Weekly Program Notes.
--
You received this message because you are subscribed to the Google Groups "Socialist Economics" group.
To unsubscribe from this group and stop receiving emails from it, send an email to socialist-economics+unsubscribe@googlegroups.com.
To post to this group, send email to socialist-economics@googlegroups.com.
Visit this group at https://groups.google.com/group/socialist-economics.
To view this discussion on the web visit https://groups.google.com/d/msgid/socialist-economics/CADH2idLVMLMD%2BR4Q-M090G5RQj1QYm90JidhKCi%3DkY4wkW%2BTHw%40mail.gmail.com.
For more options, visit https://groups.google.com/d/optout.


--
John Case
Harpers Ferry, WV

The Winners and Losers Radio Show
7-9 AM Weekdays, The Enlighten Radio Player Stream, 
Sign UP HERE to get the Weekly Program Notes.
--
You received this message because you are subscribed to the Google Groups "Socialist Economics" group.
To unsubscribe from this group and stop receiving emails from it, send an email to socialist-economics+unsubscribe@googlegroups.com.
To post to this group, send email to socialist-economics@googlegroups.com.
Visit this group at https://groups.google.com/group/socialist-economics.
To view this discussion on the web visit https://groups.google.com/d/msgid/socialist-economics/CADH2idJovFYQ2ousfSqs0n1%2BgcU3QY%3DprPvAVViXRMcB%2B_jSmw%40mail.gmail.com.
For more options, visit https://groups.google.com/d/optout.

Fwd: [socialist-econ] Henwood: Bosses get Raises, workers get Stiffed

via sam -- the times bar on text cut and paste makes me want  to boycott them


On Mon, Feb 12, 2018 at 4:46 PM, John Case <jcase4218@gmail.com> wrote:
Bosses get Raises, workers get Stiffed


Stock markets have been swooning, in no small part because last Friday's U.S. employment report showed that average hourly earnings (AHE)—the average wage, excluding benefits, received by private sector workers—rose smartly in January. This prompted fears that inflationary pressures are mounting, wages will eat into profits, and the Federal Reserve might raise interest rates more aggressively than had been thought as recently as last Thursday. Or, as the New York Times put it in a headline, with its patented mix of dullness and alarm:

NYT scare headline

What these scaremongers aren't telling you is that it's only bosses that are getting the raises.

Here's a graph of the yearly growth in AHE.

AHE - all worker

You may notice that this series begins in March 2007. That's because the Bureau of Labor Statistics (BLS) only started reporting hourly earnings for "all workers" in March 2006. It has been reporting monthly AHE stats for "nonsupervisory" or "production" workers since 1964. Nonsupervisory workers—defined by the BLS as "those who are not owners or who are not primarily employed to direct, supervise, or plan the work of others"—are about 82% of the private sector workforce, a share that has hardly changed over the last 53 years.

Most Wall Street analysts have been focusing on the all worker series, because it's broader, and because many of them have a hard time thinking about more than one thing at a time. And if you're looking to alarmed about something, you can find a rising trend in the graph above. Yearly wage growth (not adjusted for inflation) hit a post-recession low of 1.5% in October 2012; in January 2018, it rose to 2.9%, the highest in almost nine years. Yes, the number is noisy, but there's no mistaking the rising trend.

But those who've been panicking about a wage explosion haven't bothered to look at the nonsupervisory series. That has shown no rising trend at all over the last two years. AHE for nonsupervisory workers were up 2.4% for the year ending in January—just as they were in December, and less than September 2017's 2.6%. In January 2016, the gain was 2.4%. In other words, for more than four out of five private sector workers, there's been no acceleration in wage growth—which, by the way, is barely ahead of inflation.

The BLS doesn't report AHE for supervisory workers. But since we know the nonsupervisory share of the workforce and the all-worker and nonsupervisory AHE numbers, we can estimate what the supervisory wage looks like with some middle-school math. Here's a graph:

AHE - sup vs nonsup

For the year ending in January, supervisory wages were up 3.9%, compared with 3.0% in December. Over the last three months, supervisory wages are up 6.4% at an annual rate. (In January, nonsupervisory wages averaged $22.34, and the lbo-news estimate of supervisory earnings was $47.35.) In 2015 and 2016, both series moved pretty much together, but the boss sector began pulling ahead of the bossed in early 2017, and the gap has been widening since.

The series does bounce around a lot, and it's quite possible that some of the January spike will be reversed in February. But the central point is this: the alarming acceleration in wages is not a mass phenomenon. It's for the $95,000 a year set, not the $45,000 crew.*

________________________________

*Yearly earnings are based on 2,000 hours a year times the relevant hourly wage.
--
John Case
Harpers Ferry, WV

The Winners and Losers Radio Show
7-9 AM Weekdays, The Enlighten Radio Player Stream, 
Sign UP HERE to get the Weekly Program Notes.

--
You received this message because you are subscribed to the Google Groups "Socialist Economics" group.
To unsubscribe from this group and stop receiving emails from it, send an email to socialist-economics+unsubscribe@googlegroups.com.
To post to this group, send email to socialist-economics@googlegroups.com.
Visit this group at https://groups.google.com/group/socialist-economics.
To view this discussion on the web visit https://groups.google.com/d/msgid/socialist-economics/CADH2idLVMLMD%2BR4Q-M090G5RQj1QYm90JidhKCi%3DkY4wkW%2BTHw%40mail.gmail.com.
For more options, visit https://groups.google.com/d/optout.


--
John Case
Harpers Ferry, WV

The Winners and Losers Radio Show
7-9 AM Weekdays, The Enlighten Radio Player Stream, 
Sign UP HERE to get the Weekly Program Notes.

Henwood: Bosses get Raises, workers get Stiffed

Bosses get Raises, workers get Stiffed


Stock markets have been swooning, in no small part because last Friday's U.S. employment report showed that average hourly earnings (AHE)—the average wage, excluding benefits, received by private sector workers—rose smartly in January. This prompted fears that inflationary pressures are mounting, wages will eat into profits, and the Federal Reserve might raise interest rates more aggressively than had been thought as recently as last Thursday. Or, as the New York Times put it in a headline, with its patented mix of dullness and alarm:

NYT scare headline

What these scaremongers aren't telling you is that it's only bosses that are getting the raises.

Here's a graph of the yearly growth in AHE.

AHE - all worker

You may notice that this series begins in March 2007. That's because the Bureau of Labor Statistics (BLS) only started reporting hourly earnings for "all workers" in March 2006. It has been reporting monthly AHE stats for "nonsupervisory" or "production" workers since 1964. Nonsupervisory workers—defined by the BLS as "those who are not owners or who are not primarily employed to direct, supervise, or plan the work of others"—are about 82% of the private sector workforce, a share that has hardly changed over the last 53 years.

Most Wall Street analysts have been focusing on the all worker series, because it's broader, and because many of them have a hard time thinking about more than one thing at a time. And if you're looking to alarmed about something, you can find a rising trend in the graph above. Yearly wage growth (not adjusted for inflation) hit a post-recession low of 1.5% in October 2012; in January 2018, it rose to 2.9%, the highest in almost nine years. Yes, the number is noisy, but there's no mistaking the rising trend.

But those who've been panicking about a wage explosion haven't bothered to look at the nonsupervisory series. That has shown no rising trend at all over the last two years. AHE for nonsupervisory workers were up 2.4% for the year ending in January—just as they were in December, and less than September 2017's 2.6%. In January 2016, the gain was 2.4%. In other words, for more than four out of five private sector workers, there's been no acceleration in wage growth—which, by the way, is barely ahead of inflation.

The BLS doesn't report AHE for supervisory workers. But since we know the nonsupervisory share of the workforce and the all-worker and nonsupervisory AHE numbers, we can estimate what the supervisory wage looks like with some middle-school math. Here's a graph:

AHE - sup vs nonsup

For the year ending in January, supervisory wages were up 3.9%, compared with 3.0% in December. Over the last three months, supervisory wages are up 6.4% at an annual rate. (In January, nonsupervisory wages averaged $22.34, and the lbo-news estimate of supervisory earnings was $47.35.) In 2015 and 2016, both series moved pretty much together, but the boss sector began pulling ahead of the bossed in early 2017, and the gap has been widening since.

The series does bounce around a lot, and it's quite possible that some of the January spike will be reversed in February. But the central point is this: the alarming acceleration in wages is not a mass phenomenon. It's for the $95,000 a year set, not the $45,000 crew.*

________________________________

*Yearly earnings are based on 2,000 hours a year times the relevant hourly wage.
--
John Case
Harpers Ferry, WV

The Winners and Losers Radio Show
7-9 AM Weekdays, The Enlighten Radio Player Stream, 
Sign UP HERE to get the Weekly Program Notes.

Friday, February 9, 2018

Sam Webb: Democracy at risk

Democracy at risk

I lived through Watergate, but I can't recall that I felt that democratic norms, institutions, and traditions were in such danger as they are now. Not for a long time, maybe never has the country experienced the likes of what we are living through at this moment.

Nearly every day there is something new. The Nunes memo, released a few days ago with the full support of Trump, is but the latest. And notwithstanding denials from House leader Paul Ryan, its obvious intention is to set the table to fire Depute Attorney General Rod Rosenstein and shutdown the Mueller investigation.

The aim of these constant lacerations to the fabric of democracy by Trump and his enablers isn't to "smash the state," but to recast it into his own personal fiefdom — a fiefdom that is corrupt, bellicose, hyper nationalist, racist, misogynist, nativist, billionaire friendly, and hostile to democracy, the rule of law, an independent media, and even a scintilla of opposition from within or beyond the state.

Needless to say, this is no time for summer patriots. Indeed, resistance to this assault on democracy is the overarching challenge today. Nothing else rises to its importance. To cede this ground will surely foreclose any hope of moving to the higher ground of substantive justice, equality, peace, and sustainability later on.

One difference that immeasurably contributes to the present peril is the willingness of the Republican to do Trump's bidding. During Watergate that wasn't the case. Some daylight existed between Nixon and some of his Republican counterparts in Congress. It wasn't everyone, but enough to allow the investigation of Nixon to go forward without extreme interference and partisan attack. That isn't the case now. The GOP is the zealous fullback for Trump's brand of authoritarian and obstructionist politics.

But this shouldn't surprise anyone. The Republican Party is a party of the extreme right. And has been for nearly four decades. What is more, Trump, is, more than anything else, a product of this retrograde movement that is animated by power — not free markets, not small government, not collective security — first of all. Their accommodation to his brand of authoritarian politics, therefore, didn't require any back flips. If anything, it is the logical end game of right wing extremism.

In making this pact, however, the GOP is endangering the foundations of democracy as well as making a big bet that it won't come back to bite them in November and long after.

But they could be very wrong here. The elections could turn into a Democratic wave as voters, worried sick over Trump overreach, chaotic governance, and authoritarian tendencies and well aware of Republican complicity, go to the polls and elect a new Congress that will stand up to Trump and address other pressing concerns as well.

To further disadvantage Trump and his Republican counterparts this fall, as the party in power, they now own the persistence of wage stagnation, a tax "cut" that will likely fall far short of its hype for most voters, and an economy that is still growing slowly by historical standards.
Moreover, it seems that immigration won't turn into the game changing election issue that Republicans think it will be. It riles up their base for sure, but it doesn't play out in the same way across the rest of the electorate. In fact, it will become one only if the Democrats sign a Devil's bargain with Trump and the GOP on immigration this winter or spring. Nothing would be more deflating for the Democratic Party base and the larger democratic movement opposing Trump.

In these circumstances, an obvious question is: what can we do to register our strenuous opposition to systematic breaches of our country's democratic forms, rights, and institutions — not least of which is attempts to shutdown the Mueller investigation — by Trump and his fifth column in the Congress?

For those of us who are at a distance from the seats of power nor leaders of the Democratic Party or the anti-Trump movement, the answers aren't so hard to divine.

Call Congress people. Talk to family, friends, coworkers, and strangers. Letters to the editor. Make a fuss on social media as well as in community organizations, churches, unions, student councils, etc. Join (and help organize if possible) the collective actions that bring together the far flung, diverse, and majoritarian coalition that opposes Trump. And, above all, become activists in the coming elections.

And, all the while, we should keep in mind that that Trump is the most unpopular president after one year in office in our country's history. In other words, we're the many.


--
John Case
Harpers Ferry, WV

The Winners and Losers Radio Show
7-9 AM Weekdays, The Enlighten Radio Player Stream, 
Sign UP HERE to get the Weekly Program Notes.

Tuesday, February 6, 2018

Links, High vs. Low Wages


----
Links, High vs. Low Wages // Jared Bernstein | On the Economy
http://jaredbernsteinblog.com/links-high-vs-low-wages/

The stock market opened way down, continuing last Friday's selloff, though it has climbed back since the open–implying the return of volatility–as skittish investors continue to fear the sequence I describe in this AM's WaPo: tight labor market, wage pressures, higher interest rates, inflation, lower profit margins. Underneath these swings is an unsustainable, inequitable economic model with serious political implications.

BTW, in discussing last Friday's 2.9% wage pop–which I tried to put in perspective here (Don't Fear Wage Growth! Embrace It!)–many of us noted that the wage gains of the 80% of the workforce that's blue-collar production workers or non-mangers in service jobs went up only 2.4% (call this the PNS wage, for production, non-supervisory). Well, given that we know the average private sector wage, the PNS wage, as well as PNS employment, we can back out the white-collar (WC) wage. (Caveat: I once asked BLS is they viewed this as kosher and they didn't say 'yes.' Nor did they say 'no' or explain why not. At any rate, it's gotta be ballpark, I think.)

Over the past year, here are the three rates of nominal wage growth:

All: 2.9%
PNS: 2.4%
WC: 3.9%

It's a noisy series and I'd want to see other evidence before concluding there's much here, but the figure below shows the ratio of the backed-out WC wage to the PNS wage. It's been growing lately and spiked last month, implying rising wage inequality.

Source: BLS, my calculations.

Wage inequality was already on my watch list, of course, but this is worth keeping on eye on. See this WSJ piece for more sectoral detail.


----

Read in my feedly.com