In between checking weather updates here in Houston, I finally got around to reading the new working paper by Jan De Loecker and Jan Eeckhout (DE), on "The Rise of Market Power and the Macroeconomic Implications". The authors find that the markup of price over marginal cost charged by public US firms has been rising steadily since 1960, and in particular after 1980. It has generated a lot of commentary already, as in this post by Noah Smith, this post by Karl Smith, and this from Tyler Cowen. A lot of the discussion so far has been about how to interpret their results, and whether it indicates a rise in "market power", and that devolved somewhat into a discussion of how to define "market power" in the first place.
I want to jump in with some of my own thoughts on the paper, but I'm going to avoid getting into this "market power" interpretation thing. I'm more interested in what DE's results have to say about the productivity slowdown. Let's start with how DE get these numbers in the first place.
Estimating markups
Here's the thing; you can't observe these markups. While the price of a specific good might be knowable, the marginal cost of that good is not. The average cost of producing that good - total costs divided by number of goods sold - is not the same thing as the marginal cost. I'd be willing to bet that a lot of firms would be hard-pressed themselves to tell you the marginal cost of an additional good. And that doesn't even get into the issue with multi-product firms, where their aggregated financials cannot tell you about the specific prices and costs associated with specific products.
So when DE are talking about estimating markups, they are extracting the markup of a firms "price" over the firms "marginal cost", where the price is some agglomeration of the prices of their various products, and the cost is some agglomeration of the cost of their various inputs. That's not a knock on the approach, but it should be kept in mind.
How do you extract this markup if you don't have the exact costs, or even prices? DE assume that firms are cost-minimizers, a less forceful assumption than strict profit maximization. Whether firms are pricing their goods to maximize profits or not is immaterial to DE, but they assume that firms are trying to produce their goods or services using the lowest-cost combination of inputs.
You can see the logic involved in the firm's decision pretty easily. If a firm's markup is the price relative to marginal cost, then for the marginal good it produces, it should be that
Rev=Markup×MC×Inputswhere Rev is the revenue from that marginal good, Markup is the … markup, MC is the cost of an additional bundle of inputs, and Inputs are the bundles of inputs it takes to produce that marginal good. Simply rearrange this to
Markup=RevMC×Inputsand you've got it. DE have data on firm-level revenues, and they have data on firm-level costs for inputs. There is an extra step, which is that this kind of condition should hold for each separate input (i.e. labor and capital) as opposed to "Inputs" the way I've described it. All this does is insert a parameter into this expression that weights revenues by how important that specific input is to production. If we were working with labor, for instance, we might say that the revenue attributable to laboris only 60% of total revenues, and so divide 0.6 times revenues by the cost of labor to arrive at the markup. For the purposes of this post, though, I think you can easily stick with the idea that markups are obtained from ratios of revenues to costs.
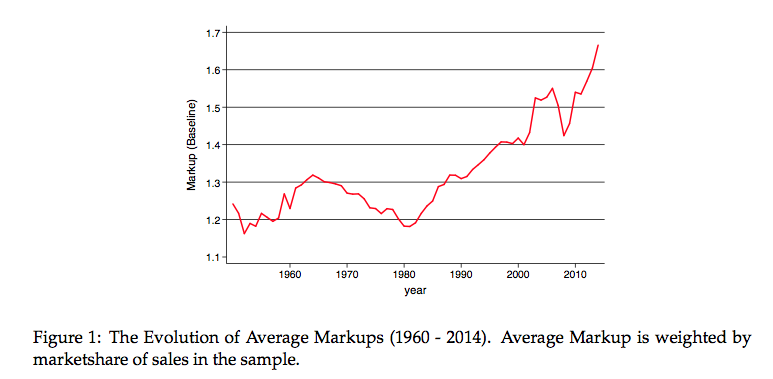
DE do this for all the public firms they have data for, for all the years running from 1960 to recently. The figure below is the central result, which is that markups rose steadily from 1960's - when they were about 1.18 on average - to today, when they are about 1.67 on average.
This is one of those papers where it shocks you that no one has done this before. This paper takes some relatively off-the-shelf techniques, and uses them to generate an incredibly interesting set of estimates. Granted, the authors are some of the people who put those techniques up on the shelf in the first place, but the innovation in this paper is the application to the long panel of US public firms, not the techniques. The results in this figure are what have generated a lot of commentary.
Let's start with the big empirical caveats. If you want to disbelieve DE's results, then you'd have to think hard about the effect of these:
The sample is only public firms. Probably the biggest question mark. The average markup charged by all firms in the economy may not have changed much over time, but if there was a distinct change in the choice to either go public, or stay public, starting around 1980, and that change was related to markup sizes, then this could just be sample selection. For example, you could argue that as investors became laser-focused on quarterly earnings, this meant that the only firms willing to go public or stay public were those with large markups that could generate the expected earnings growth. All the low markup firms are private, and so don't show up in the DE dataset.
Industry production functions are assumed to be identical for all firms and over time. I mentioned above that DE actually use specific inputs in the calculation, and for that they need these weights (like the 60% for labor I mentioned). To get those, they estimate production functions for each industry using their data. And that estimation assumes that the weights are identical for all firms in an industry (i.e. American and United each have a weight of 44% on labor) and over time (i.e. United's weight on labor is 44% every year from 1960 forward). DE have an appendix where they relax this assumption, and show that the growth in markups over time (but not their level) is unchanged, so this is unlikely to be driving the results.
Cost minimization may not hold. This doesn't seem like a strong assumption, and it is certainly weaker than assuming full profit maximization. But it is an assumption. If the firms in the DE dataset are not operating to minimize costs (perhaps they just care about maximizing market share or executive compensation?) then the first order condition DE use would be picking up something other than the true markup. I don't have a great sense of how the bias would work here, or a great sense of whether this could be a big or a small problem. But it could be a problem.
If you are willing to take the DE results as indicative of what is happening in the US as a whole, then the second half of their paper is for you. Here, they break down several secular trends in the economy (e.g. declining labor shares, declining productivity growth) and show how the rise in markups can account for them. As the association of markups with productivity is something I've been banging around on for a few years - you could start with this post and work backwards - let me focus on that.
Productivity Accounting
The presence of markups - and changes in markups - have implications for measured productivity growth. And DE corroborate that, while offering the data to be more precise about the effects. But they do it using a slightly different line of attack than I have in the past, so let me digress for a moment to try and link this all together.
There are two ways we could describe aggregate output. The first is using a production function, like
Y=TXwhere T is technology and X is an index of inputs. Technology, T, is the for-realisies measure of how good we are at transforming inputs into useful output. It is what we really would like to measure. Based on this production function, we could back out technology as
T=YX.Leave that aside for the moment, we'll come back to it.
We can also describe aggregate output using incomes, meaning we can write
Y=Π+wXwhere Π are economic profits, and w is the "wage" of inputs. For those wages, think of something like a weighted average of actual wages (to labor) and payments to capital and/or natural resource.
What are profits? Well, let's assume that there is a markup, μ, which recall measures the ratio of price to marginal cost. If μ=1.5, then firms are charging 50% over cost. So profits are equal to 50% of costs. Another way of saying this is that profits are μ−1 times costs,
Y=(μ−1)wX+wX=μwXor total output can be expressed as the markup times the wage times the inputs used. We're still the world of pure accounting, by the way. No behavioral assumptions have been made.
Now, go back and compare the original production function version of output, Y=TX, to this markup version, Y=μwX. From these, it shows us that we could write
T=μw.Or technology is equivalent to the markup times the wage. I like to think of this expression this way: technology (or an increase in technology) can be used for one of two things (a) raising the markup or (b) raising the wage paid to inputs. One quibble with DE is that they say something along the line of "if markups go up, this raises technology", which should more accurately be phrased "if markups go up, this implies that tecnology was higher", which eliminates the implicit causal statement.
So we've got two ways to backing out technology, T, from the data. Either use T=Y/X, or use T=μw. In terms of growth rates, the first says that the growth rate of technology (using little hats to denote growth rates) is ^T=^Y−^X, and the second says that ^T=^μ+^w.
That's great, but when we go to the data is it quite plausible that we make mistakes. That is, we go to the data and calculate residual productivity, P. And unless we are exactly right about how the world works, our measure of P may not be equal to T. Here's what I mean. Take the production function version of things, which I've talked about a lot before.
^P=^Y−^Xwrong=^Y−^X+(^X−^Xwrong)=^T+(^X−^Xwrong)The growth rate of productivity is the growth rate of output minus the growth rate of a possibly mismeasured index of input use. This mismeasurement may be because we really don't know how to count units of capital or human capital correctly, or because we are weighting those counts incorrectly. The point I've made in a few posts in the past is that by ignoring markups, you could may be making a weighting mistake, and this would lead to ^Xwrong>^X, so productivity growth understates technological growth.
If you instead were going to try and measure productivity growth using the real wage, then you could get something like
^P=^μwrong+^X=(^μwrong−^μ)+^μ+^X=^T+(^μwrong−^μ)where you might be making an error about how fast markups are growing. If you do, and in particular if you assume ^μwrong<^μ, which you might do if you assumed markups were unchanging over time, then your productivity growth term understates technological growth.
And this is what DE essentially do in the very last part of the paper. They say that by falsely assuming markups are constant, productivity growth measured using changes in real wages is understating true technological growth. When they make an adjustment to allow for the real growth in markups they observe, they find that true technological growth was around 3-4% per year over the last few year, as opposed to almost 0% growth in measured productivity.
This is a massive difference, and suggests that (a) technological progress is clipping along very nicely, thank you, and (b) that almost all of the gains from this are being leveraged into higher markups rather than higher real wages to inputs like labor. Entirely consistent with stories of increased market power and concentration.
There isn't a glaring issue with the analysis that DE do here, but they could go further with it. The papers that establish the discrepancies between growth in productivity, P, and technology, T, point out that much of the problem stems from trying to do this at the aggregate level alone. If you had individual firm-level (or plant-level) data on technological growth, then you could add those up directly (suitably weighted by their size), to arrive at T directly. No need to back it out from aggregate information on inputs used, or wages.
And DE have all the data to do this. When they estimate the production functions that allow them to recover the markups, they also recover an estimate of technology for each firm. It would be straightforward to find technological growth from the "bottom-up", and compare it to what we get using aggregate methods. This would give us (a) a true(r) measure of technological growth and (b) help identify what precisely we are doing wrong with the aggregate measures of productivity growth. I'll let DE add that to the near-infinite list of things that people have suggested they do with this data.
Why are markups higher?
From the perspective of productivity, and for most of the other secular trends DE talk about, the source of the markup is irrelevant. Arguing about whether markups represent market power or not, or whether monopolistic competition is equivalent to market power, adds nothing to the discussion of the implications. They would matter if we were talking about how to change markups. But at this stage DE are simply documenting the growth in markups and showing that these can be associated with a number of phenomena.
As much of the discussion about the markups has circled around market power, let me point out two additional possible sources of markups, and growth in markups. First, scale. If there are increasing returns to scale, then the markup will be above one. Think of a firm with big fixed costs. They have to charge above marginal cost in order to recover those fixed costs. You could imagine that what has changed over time is that the firms in the DE dataset invested in some fixed costs that gave them increasing returns to scale, and the markups are covering those costs. The problem with this explanation is that you wouldn't expect labor's and capital's share of output to be declining over time in this case, which they are. So perhaps it doesn't matter much.
Second, it could be us. That is, the markup could be rising because consumers are getting more particular about their bundle of purchases. Whether these firms are true monopolists, or involved in monopolistic competition, or compete in some kind of strategic game with one another, the more inelastic our demand gets for their product, the bigger the markups they can charge. I think of this as a caveat of structural change. As our basic material needs get met more easily over time, we get pickier about the goods and services we consume, making our demand more inelastic. This could explain some of the rise in markups.
If you take seriously the DE findings, then decomposing this rise in markups into different sources is the natural next step. The other step is to find ways to confirm that this rise in markups is robust to non-public, and possibly non-US, firms. Tracking similar changes across countries would help eliminate or confirm some explanations (US-specific anti-trust policies). Nevertheless, I found the DE paper an intriguing (and very large) step forwards.
-- via my feedly newsfeed

No comments:
Post a Comment