Wednesday, December 9, 2020

Bloomberg: China's State-Backed Virus Vaccine Has 86% Efficacy, Says UAE [feedly]

China's State-Backed Virus Vaccine Has 86% Efficacy, Says UAE
https://www.bloomberg.com/news/articles/2020-12-09/uae-says-sinopharm-vaccine-has-86-efficacy-against-covid-19

China's state-backed coronavirus vaccine protected 86% of people against Covid-19 in trials conducted in the United Arab Emirates, state media there reported, giving credence to the quickly developed shot that Beijing intends to distribute around the developing world.

The data was from trials that included 31,000 volunteers in the UAE, which found the vaccine was highly effective in preventing moderate and severe cases of Covid-19 and had no serious safety concerns, according to the report, which cited the country's Ministry of Health and Prevention.

That's expected to pave the way for full public use of the vaccine and a re-opening of the Gulf nation's economy, the ministry said. In an early sign of how the vaccine could be a gamechanger, Abu Dhabi officials said that they would start working with local authorities to "resume all activities within two weeks," including economic, tourism and cultural operations.

The emirate's public health authority didn't immediately respond to requests for comment, but a recorded message offered the option of booking an appointment for the shot at its primary health-care centers.

Developed by Sinopharm unit China National Biotec Group Co., the vaccine has already been administered to hundreds of thousands of people under emergency authorization in China, but it's yet to receive public use approval from any drug regulators. CNBG did not immediately respond to requests for comment.

China's Vaccine Web

Almost 100 countries have vaccine links with the Asian giant so far

Data compiled by Bloomberg

With an 86% efficacy rate, the vaccine would almost meet the high bar set by Western front-runners, but those companies have disclosed more detail. It's part of President Xi Jinping's promise to make any Chinese shot a "global public good" as part of the effort to rehabilitate the Asian country's image after the pandemic emerged from its city of Wuhan.

The protection rate of CNBG's shot is also higher than the results from the vaccine developed by AstraZeneca Plc and the University of Oxford. Data last month showed their shot was 70% effective on average in a late-stage study.

The CNBG vaccine could become a more favorable option to vaccinate large swathes of the developing world. While mRNA vaccines from Pfizer Inc. and Moderna Inc. showed higher efficacy of more than 90%, those present distribution challenges for some nations as they require deep-freeze facilities and trucks. CNBG's vaccine can be transported and stored at normal refrigerated temperatures.

Inactivated Vaccines

The Chinese vaccine, made using an inactivated version of the coronavirus to prime human immune systems to fight it, was among the first candidates that raced into the crucial final stage of human trials. While Pfizer and Moderna are among developers relying on novel technology, manufacturers have decades of experience with the method that the Chinese company is using.

Still, those inactivated vaccines can require multiple booster shots to achieve strong immunity, and production means handling large amounts of the virus. In theory, mRNA vaccines should be much faster to manufacture, because they require only tiny volumes of raw material to produce millions of doses.

Nearly a year into the pandemic, over 68 million people have been infected and and more than 1.5 million killed. Countries like Indonesia and Pakistan have already signed deals with CNBG and others are now likely to emerge, given the vaccine's suitability for developing countries.

China has two other developers conducting final-stage trials globally. One of them, Beijing-based Sinovac Biotech Ltd., is in the midst of analyzing data from its Phase III trial in Brazil and could release efficacy data within days.

— With assistance by Farah Elbahrawy, Dong Lyu, Abeer Abu Omar, Claire Che, and James Paton


 -- via my feedly newsfeed
Monday, December 7, 2020

Enlighten Radio:Talkin Socialism: The R sweep in Appalachia -- How Did it Happen?

The Red Caboose has sent you a link to a blog:


Blog: Enlighten Radio
Post: Talkin Socialism: The R sweep in Appalachia -- How Did it Happen?
Link: https://www.enlightenradio.org/2020/11/talkin-socialism-r-sweep-in-appalachia.html

--
Powered by Blogger
https://www.blogger.com/

Greg Mankiw: On the Low Rate of Interest [feedly]

I would normally not post Mankiw, who makes a living trying to refute socialism. But his discussion of interest rates, what is known, and what is unknown -- is factual and helpful, I think, for those seeking understanding INTEREST -- a key measure of returns on capital: after labor (the availability of 'human capital'), capital circulation, is the mother of capitalism!

On the Low Rate of Interest

Greg Mankiw (Harvard, fmr Chair of Economic Advisors under Bush, num 1 selling college econ textbook)
http://gregmankiw.blogspot.com/2020/12/on-low-rate-of-interest.html

In the evolution of the U.S. economy over the past four decades, one fact stands out as especially puzzling: the large and fairly steady decline in interest rates.

Consider what has happened to three key benchmarks. In September 1981, the 10-year Treasury note yielded over 15 percent. Today, it yields less than 1 percent. Over the same period, the critical short-term rate set by the Federal Reserve, the federal funds rate, has fallen to nearly zero from about 16 percent, and the rate on 30-year mortgages has dropped below 3 percent from over 18 percent.

What accounts for this decline, and what does it imply for personal and public decision-making? Some answers are clear, but many more are elusive.

One reason for the interest rate decline is a drop in inflation expectations. As the economist Irving Fisher noted almost a century ago, when bond investors expect high inflation, they anticipate that repayment will be made in significantly less valuable dollars, and they demand a higher interest rate to compensate. When expected inflation falls, as it has over the past 40 years, interest rates typically do as well.

ADVERTISEMENT

Continue reading the main story

But this so-called Fisher effect is only a piece of the puzzle. According the University of Michigan's survey of consumers, expected inflation fell 4.3 percentage points from September 1981 to September 2020, explaining only about a third of the decline in interest rates. The remaining question is why inflation-adjusted interest rates — what economists call real interest rates — have declined so substantially.

It may be tempting to blame the Fed and specifically its recent chairs, Jerome H. Powell and Janet L. Yellen, whom President-elect Joseph R. Biden Jr. has nominated to become Treasury secretary. After all, the Fed sets interest rates, doesn't it?

  • Gift Subscriptions to The Times, Cooking and Games.
Starting at $25.

In the short run, yes, but not in the long run. The Fed aims to set interest rates at levels that will produce full employment and stable prices. This level is sometimes called the natural rate of interest. The natural rate is determined not by the central bank but by deeper market forces that govern people's supply of savings and businesses' demand for capital. When the Fed sets low rates, it is acting more like a messenger, telling us that the economy needs them to maintain equilibrium.

Several hypotheses might explain the decline in the natural rate of interest:

  • As income inequality has risen over the past few decades, resources have shifted from poorer households to richer ones. To the extent that the rich have higher propensities to save, more money flows into capital markets to fund investment.

  • The Chinese economy has grown rapidly in recent years, and China has a high saving rate. As this vast pool of savings flows into capital markets, interest rates around the world fall.

  • Events like the financial crisis of 2008 and the current pandemic are vivid reminders of how uncertain life is and may have increased people's aversion to risk. Their increased precautionary saving and especially their greater demand for safe assets drive down interest rates.

  • Since the 1970s, average economic growth has slowed, perhaps because of a slower technological advance. A decline in growth reduces the demand for new capital investment, pushing down interest rates.

  • Old technologies, such as railroads and auto factories, required large capital investments. New technologies, like those developed in Silicon Valley, may be less capital-intensive. Reduced demand for capital lowers interest rates.

  • Some economists, most notably the New York University professor Thomas Philippon, have suggested that the economy is less competitive than it once was. Businesses with increasing market power not only raise their prices but also invest less. Again, reduced demand for capital puts downward pressure on interest rates.

Which of these hypotheses is right? The question is an active area of research. Very likely, a combination of these forces is at work.

Some of the implications of low interest rates are already clear. For example, a balanced portfolio of half stocks and half bonds has historically earned a return of 8.2 percent, or about 5 percent after inflation. My guess is that a more plausible projection is an inflation-adjusted return of about 3 percent.


 -- via my feedly newsfeed

In the United States, it’s not what you know but who your parents know [feedly]

In the United States, it's not what you know but who your parents know
https://equitablegrowth.org/in-the-united-states-its-not-what-you-know-but-who-your-parents-know/

In the United States, an individual's income tends to be closely related to their parents' income. This fact—that children born into poverty in this country are likely to remain in poverty as adults—runs counter to the American ideal of equality of opportunity. Furthermore, this pattern raises the concern that the U.S. economic system fails to provide all individuals with the opportunity to reach their full potential.

Individuals from disadvantaged backgrounds may earn less because they lack opportunities to develop skills that are rewarded in the U.S. labor market, or because structural barriers in the labor market prevent them from fully deploying their skills. The vast majority of research in economics focuses on the development channel, finding that families, neighborhoods, and schools all play an important role in shaping the development of skills. Yet an individual's income is not just determined by their skills ("what you know"), but also by the opportunities they have to deploy those skills in the marketplace.

Recent evidence suggests that the firm at which an individual is employed is also an important determinant of earnings. Furthermore, more than half of all jobs are found through a social contact, and thus, access to jobs at high-paying firms depends, in part, on who you know.

This is why parents also can affect how the skills of their children are deployed in the U.S. labor market, by using their connections to provide access to high-paying firms. In a recent working paper, "The Intergenerational Transmission of Employers and the Earnings of Young Workers," I study one way in which parents might do this by focusing on the connections that operate within the parent's current employer.

My paper has three main findings. First, it is not uncommon for an individual to work for a parent's employer. I study the experiences of 17 million young workers by linking survey data from the 2000 decennial census, which measures the relationship between parents and children, to administrative data from the Longitudinal Employer-Household Dynamics program, which measures the earnings of the individual, as well as characteristics of their employer. I find that 7 percent of individuals work for a parent's employer at their first job and 29 percent do so at some point between the ages of 18 and 30.

There are a number of explanations for why someone might work at the same firm as a parent. For example, parents and their children may tend to work for the same employer if there is a single employer that dominates the local labor market. However, individuals who work for a parent's employer are no more likely to work at large firms and tend to be located in urban areas. Rather, several pieces of evidence suggest that parents use their connections to help children who would have otherwise struggled to find a decent-paying job.

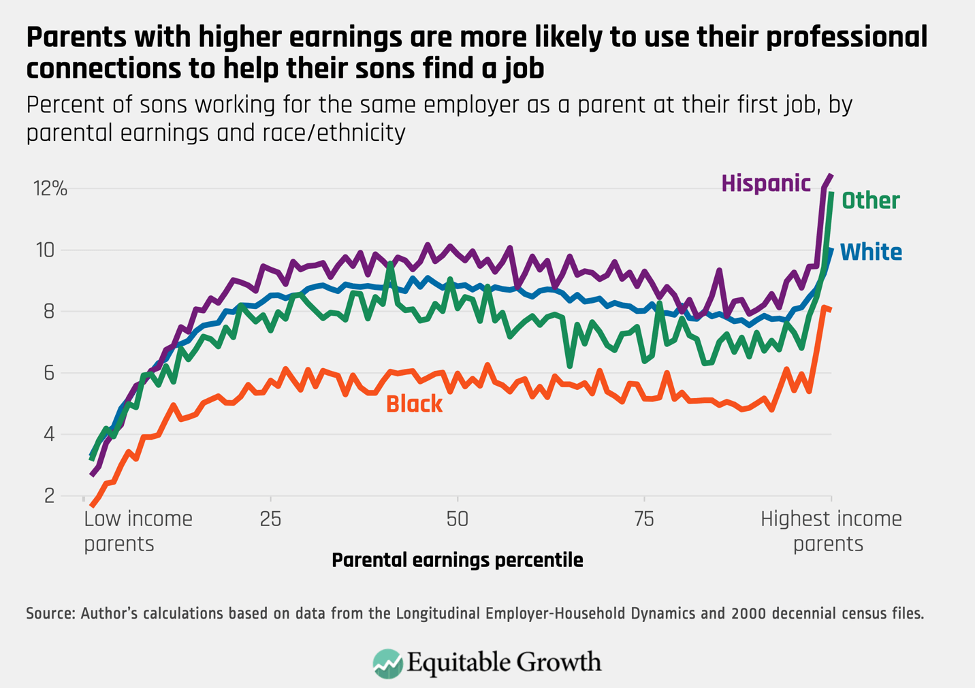
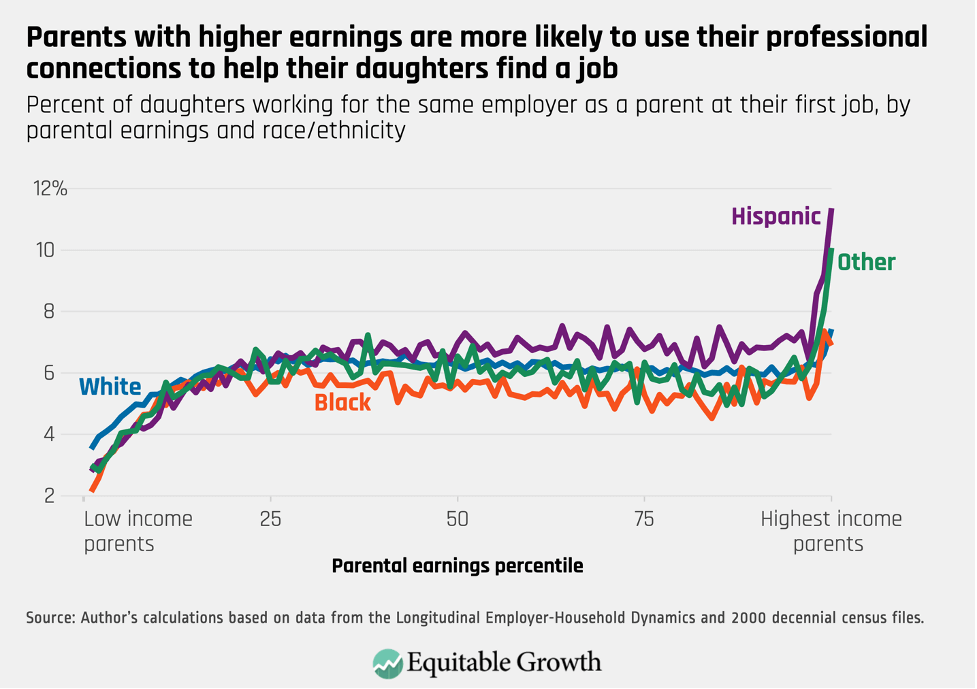
Figure 1 below presents the proportion of daughters who find their first job at the same employer as a parent, broken out by parental earnings and race/ethnicity. The estimates indicate that individuals with higher-earning parents are more likely to work for the employer of a parent, which could be attributable to the fact that parents with higher earnings are more likely to be employed and more likely to hold a position of authority within the firm. Figure 2 demonstrates that the same pattern is evident for sons.

Figure 1

Figure 2

Second, there are large earnings benefits associated with working for a parent's employer. Estimating the causal effect of working for a parent's employer is difficult because individuals who work for a parent's employer are likely different from those who do not. I address this concern by using an instrumental variables estimator that exploits exogenous variation in the availability of jobs at the parent's employer. Intuitively, some individuals will only find a job at their parent's employer when there are many job opportunities at that firm (the firm is hiring intensively).

My empirical strategy compares individuals who are looking for a job in times when their parent's employer is hiring intensively to individuals who are looking for a job in times when their parent's employer is not hiring intensively. This comparison provides a way of estimating the causal effect of working for a parent's employer since the only difference between the two groups (after controlling for differences across the parents' employers and local labor market conditions) is that one group is more likely to work for their parent's employer.

I find that working for a parent's employer increases an individual's initial earnings at a first job by 31 percent, and individuals with higher-earning parents experience a larger increase in earnings. By looking at the characteristics of the employers, I find compelling evidence that the individual-level earnings gains are explained by parents providing access to higher-paying firms. For example, parents provide access to jobs in construction, which tend to pay much better than jobs at fast-food restaurants. The earnings benefits persist for years after the individual starts their first job, suggesting that parents provide access to jobs that have higher starting wages and also offer better opportunities for career advancement.

Third, the close relationship between an individual's earnings and their parents' earnings is partly attributable to individuals with higher-earning parents being more likely to work for a parent's employer and benefit more when they do. The magnitude of the effect is modest—the association between an individual's earnings and their parents' earnings would be about 10 percent weaker if no one worked for the employer of a parent. But it is important to keep in mind that parents may have other connections through friends, classmates, or former co-workers.

In this way, my results raise the possibility that parental labor market networks (more broadly defined) are an important channel through which parents shape the earnings of their children. When cutting the results by race/ethnicity, sex, and parental earnings, I find that non-Black males with high-earning parents benefit more from working for a parent's employer than any other group, further exacerbating racial disparities in earnings.

Both within academic and policy spheres, the prevailing narrative surrounding economic opportunity focuses on the development of skills. Educational programs such as Head Start, which provides access to early childhood education, and the Pell Grant program, which helps low-income students and their families pay for college, are both examples of programs that promote the development of skills for individuals from disadvantaged backgrounds. Yet my results highlight that even with equal skills, individuals from disadvantaged backgrounds will tend to earn less because their parents are less able to use their connections to provide their children with access to high-paying jobs. This is just one example of how structural inequities in the U.S. labor market are an important channel through which equality of opportunity is undermined and why, therefore, a focus solely on improving education and skills is insufficient to ensuring true equality of opportunity.

These dynamics are particularly important in the current U.S. economic environment. I find that less-educated workers searching for jobs in periods of high unemployment are most likely to rely on parental connections. So, as policymakers begin to think about how to power the economic recovery from the current coronavirus recession, closing the skills gap is likely to be an insufficient solution to eliminating disparities in earnings across groups. Instead, education-focused policies should be combined with additional efforts that aim to directly address disparities in access to jobs—for example, programs that provide job guarantees or mentorship opportunities.


 -- via my feedly newsfeed

The coronavirus recession continues to threaten low-wage U.S. workers due to stalled jobs recovery [feedly]

The coronavirus recession continues to threaten low-wage U.S. workers due to stalled jobs recovery
https://equitablegrowth.org/the-coronavirus-recession-continues-to-threaten-low-wage-u-s-workers-due-to-stalled-jobs-recovery/

Today's U.S. Bureau of Labor Statistics Jobs Report demonstrates a stalled jobs recovery following the deep and rapid economic decline brought about by the coronavirus pandemic. The unemployment rate has decreased slightly to 6.7 percent, but still remains higher than the 3.5 percent unemployment rate in February prior to the start of the coronavirus recession.

The workers who have been hit the hardest continue to be Black workers (10.3 percent), and Latinx workers (8.4 percent). Women workers saw a decrease in unemployment (6.1 percent) that was accompanied by a slight decline in labor force participation (57.1 percent). These workers are also disproportionately low-wage workers as the service sector industries in which most of these workers are employed are among the hardest hit. To put this in context, when the deepest effects of the pandemic hit the economy in April, the unemployment rate reached a post-World War era high of 14.7 percent and the prime-age employment-to-population ratio plummeted to 69.7 percent—a 10 percentage point drop from the previous month.

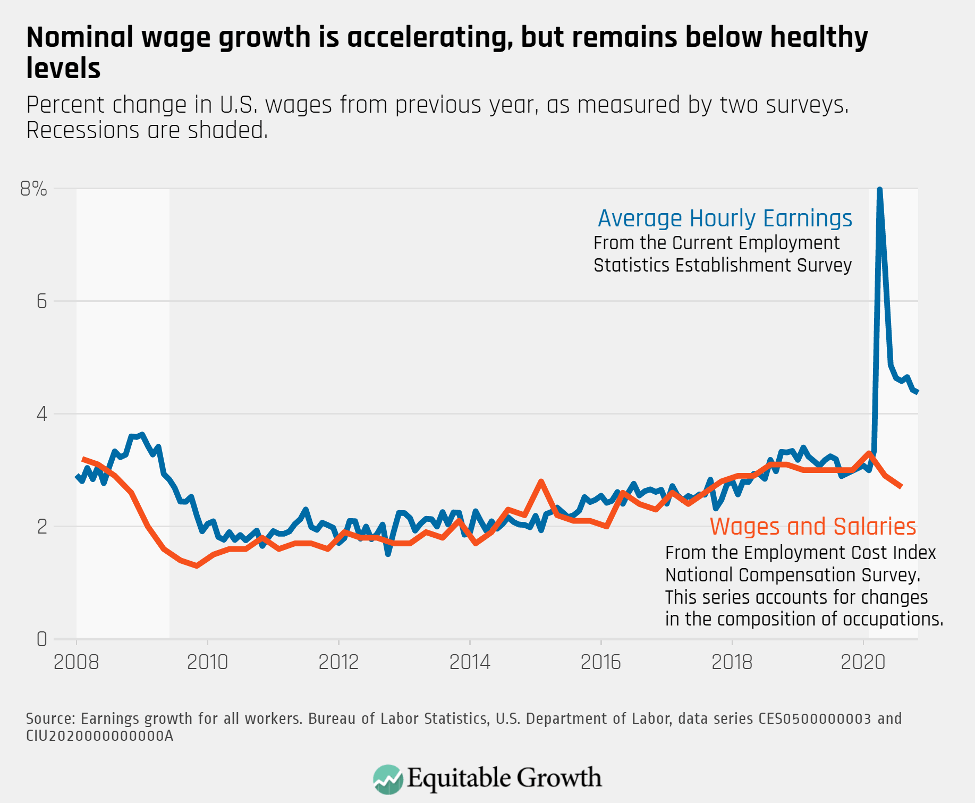
The same month, however, one important economic indicator pointed to another direction. Seemingly contradicting one of the main laws of economic theory, just as labor demand plummeted—when economists would expect wages to decline in tandem—average hourly earnings jumped 8 percent in April relative to the same month of 2019. This massive rate of growth is not even observed during booms:  Using this same measure, average wage growth did not surpass 3.8 percent at any point during the 2009–2020 economic expansion. This month wage growth normalized somewhat, with an average worker in the private sector earning $29.58 $an hour, a 4.19 percent increase from the year before. 

The Bureau of Labor Statistics provides a disclaimer in the Employment Situation Summary that "the large employment fluctuations over the past several months—especially in industries with lower-paid workers–complicate the analysis of recent trends in average hourly earnings." While higher-wage workers are more likely to be able to telecommute during the current public health crisis, low-wage workers are more likely to lose their jobs. The coronavirus recession has led to a unique contraction of the service sector, changing the composition of employment in the overall U.S. labor market. 

As research by Peter Ganong at the University of Chicago Harris School of Public Policy and  Pascal Noel and Joe Vavra at the University of Chicago Booth School of Business shows, unemployment this year is greater for low-income workers. They estimate that workers' whose pre-job loss weekly earnings put them in the bottom 20 percent of earnings distribution were experiencing a jobless rate of 16 percent between April and July of 2020. Those in the top 20 percent of the income ladder, by contrast, were experiencing an unemployment rate below 4 percent.

As lower-income workers disproportionately lost their jobs, higher-earning workers were more likely to remain employed, which taken together mechanically increases average earnings. Similarly, research by the Federal Reserve Bank of San Francisco shows that in these first months of the coronavirus recession, workers in the bottom quartile of the earnings distribution represented about 1 in 2 of all transitions out of employment. 

When looking at other metrics of wage growth, another picture emerges. Accounting for changes in the composition of occupations by measuring wage and salary growth for a fixed set of jobs, the Employment Compensation Index of the National Compensation Survey shows that rather than accelerating, wage growth has slowed down. (See Figure 1.)

Figure 1

At the onset of the pandemic there was some expectations that the earnings of essential and front-line workers would rise. According to the hypothetical premise of "compensating wage differentials" in labor economics, employers need to make more attractive offers in order to convince workers to do risky or undesirable jobs. In the early months of the health and economic crises, there was some evidence that this would be the case. Companies such as Amazon.com Inc., Costco Wholesale Corp, and Walmart Inc. offered front-line and essential workers—cashiers, warehouse, and fast-food workers, for example—hazard pay, bonuses, and sick paid leave.

That is largely no longer the case. Many workers on the front lines and concerned about getting sick are no longer receiving extra compensation. According to a poll commissioned by the Economic Policy Institute, in mid-May only about 30 percent of respondents working outside from home were receiving some kind of hazard pay, even as more than 50 percent were concerned about contracting the coronavirus and falling ill from COVID-19, the disease caused by the virus. Throughout the late summer and fall, even as the health crisis continued to put workers at risk, many businesses cut those benefits.

As the public health crisis worsens, states are maintaining partial opening or strengthening so-called lockdowns to limit the surge of the pandemic. Economist Trevon Logan at The Ohio State University estimates that hour reductions during peak hours for bars after 10 p.m. as well as limited capacity requirements in restaurants and bars are translating into at least a 50 percent wage cut for many service workers.

It's important for economists and policymakers alike to consider where the U.S. labor market is today compared to prior to the pandemic. Back then, wage growth had finally started to ramp-up for the first time in years. As many states and cities increased their minimum wage and the labor market tightened, wage growth accelerated the most for the lowest earners, yet significant income inequality and differences in unemployment rates by race remained persistent. Now, after the coronavirus recession caused an unprecedented number of jobs lost and widespread pay cuts, elevated unemployment rates will likely exert downward pressure on wages as workers find fewer jobs options and grow increasingly desperate as unemployment benefits expire.

This is why it's essential to put forward policies that help maintain labor standards, including increasing earnings through minimum wage increases and ensuring workplace safety amid the pandemic so that an eventual recovery is robust and resilient, rather than further entrenching economic inequality. Recent research and today's Job Report further emphasizes the need to center economic policies around the well-being of the hardest hit workers to ensure they won't have to wait another 10 years for strong wage growth.


 -- via my feedly newsfeed

Calculated Risk: Seven High Frequency Indicators for the Economy [feedly]

Some interesting numbers on travel and entertainment. These numbers get updated frequently, so it will be a good place to track the impact of vaccines on very COVID vulnerable businesses and occupations.  

Seven High Frequency Indicators for the Economy
http://feedproxy.google.com/~r/CalculatedRisk/~3/9wEAxoawCoI/seven-high-frequency-indicators-for.html

These indicators are mostly for travel and entertainment.    It will interesting to watch these sectors recover as the vaccine is distributed.   

IMPORTANT: Be safe now - if all goes well, we could all be vaccinated by Q2 2021.

----- Airlines: Transportation Security Administration -----

The TSA is providing daily travel numbers.

 Click on graph for larger image.

This data shows the seven day average of daily total traveler throughput from the TSA for 2019 (Blue) and 2020 (Red).

The dashed line is the percent of last year for the seven day average.

This data is as of December 6th.

The seven day average is down 65.5% from last year (34.5% of last year).  (Dashed line)

There had been a slow increase from the bottom, but has declined following the Thanksgiving week holiday.

----- Restaurants: OpenTable -----

The second graph shows the 7 day average of the year-over-year change in diners as tabulated by OpenTable for the US and several selected cities.

Thanks to OpenTable for providing this restaurant data:

This data is updated through December 5, 2020.

This data is "a sample of restaurants on the OpenTable network across all channels: online reservations, phone reservations, and walk-ins. For year-over-year comparisons by day, we compare to the same day of the week from the same week in the previous year."

Note that this data is for "only the restaurants that have chosen to reopen in a given market". Since some restaurants have not reopened, the actual year-over-year decline is worse than shown.

Note that dining is generally lower in the northern states - Illinois, Pennsylvania, and New York - but declining in the southern states.

----- Movie Tickets: Box Office Mojo -----

This data shows domestic box office for each week (red) and the maximum and minimum for the previous four years.  Data is from BoxOfficeMojo through December 3rd.

Note that the data is usually noisy week-to-week and depends on when blockbusters are released.

Movie ticket sales have picked up slightly over the last couple of months, and were at $16 million last week (compared to usually around $200 million per week).

Some movie theaters have reopened (probably with limited seating).

----- Hotel Occupancy: STR -----

This graph shows the seasonal pattern for the hotel occupancy rate using the four week average

The red line is for 2020, dash light blue is 2019, blue is the median, and black is for 2009 (the worst year since the Great Depression for hotels - prior to 2020).

This data is through November 28th. Hotel occupancy is currently down 28.5% year-over-year.

Notes: Y-axis doesn't start at zero to better show the seasonal change.

Since there is a seasonal pattern to the occupancy rate, we can track the year-over-year change in occupancy to look for any improvement. This table shows the year-over-year change since the week ending Sept 19, 2020:

 -- via my feedly newsfeed

Sunday, December 6, 2020

Why Some of the Shift to Telecommuting Will Stick [feedly]


Why Some of the Shift to Telecommuting Will Stick

https://conversableeconomist.blogspot.com/2020/12/why-some-of-shift-to-telecommuting-will.html

It seems to me that the tone of the discussion surrounding the pandemic-induced shift telecommuting has been changing. Last spring and early summer, a lot of the discussion was about about how well it was working, how much time it was saving, how much employees preferred it, and so on. But then the discussions tend to express more concerns. In the words of a recent Wall Street Journal article, "Companies Start to Think Remote Work Isn't So Great After All Projects take longer. Collaboration is harder. And training new workers is a struggle. 'This is not going to be sustainable.'" Bloomberg reported on the results from a study done on teleworkers by researchers at the Harvard Business School:  "The Pandemic Workday Is 48 Minutes Longer and Has More Meetings. A study of 3.1 million workers around the world found an uptick in emailing, too."

What factors will determine whether the shift to telecommuting sticks? Jose Maria Barrero, Nicholas Bloom, and Steven J. Davis present some results from a series of nationally representative surveys of US workers done from May to October 2020, in "Why Working From Home Will Stick" (December 2020, University of Chicago Becker Friedman Institute Working Paper 2020-174). The authors argue that teleworking will remain substantially higher after the pandemic: they estimate a rise from about 5% of work-days were supplied from home before the pandemic, and it will be something like 22% even after the pandemic is done. Based on the survey data, they suggest five reasons why some of the shift to working from home will persist:

First, reduced stigma. A large majority of respondents report perceptions about working from home have improved since the start of the pandemic among people they know. With fewer people viewing working from home as "shirking from home," workers and their employers will be more willing to engage in it. 

Second, ... COVID-19 compelled firms to experiment with a new production mode – working from home – and led them to acquire information that leads some of them to stick with the new mode after the forcing event ends. 

Third, our survey reveals that the average worker has invested over 13 hours and about $660 dollars in equipment and infrastructure at home to facilitate working from home. We estimate these investments amount to 1.2 percent of GDP. In addition, firms have made sizable investments in back-end information technologies and equipment to support working from home. Thus, after the pandemic, workers and firms will be positioned to work from home at lower marginal costs due to recent investments in tangible and intangible capital. 

Fourth, about 70 percent of our survey respondents express a reluctance to return to some pre-pandemic activities even when a vaccine for COVID-19 becomes widely available, for example riding subways and crowded elevators, or dining indoors at restaurants. ...

Fifth, ... the massive expansion in working from home has boosted the market for working from equipment, software and technologies, spurring a burst of research that supports working from home, in particular, and remote interactivity, more broadly.
Here are a few reactions: 

1) More work-days happening from home would be bad news for dense urban areas. The authors write: "We estimate that 4 the post-pandemic shift to working from home (relative to the pre-pandemic situation) will lower post-COVID worker expenditures on meals, entertainment, and shopping in central business districts by 5 to 10 percent of taxable sales." 

2) The workers who are well-positioned to benefit from working form home often tend to have higher incomes and workplace status. Workers in retail or manufacturing or many other other jobs don't have a work-from-home option. For new workers getting hired, on-the-job learning and professional connections are almost certainly harder to create when you're one more face in a checkerboard of continual online meetings. In that sense, the additional perk of sometimes working from home is likely to create a separation between a more favored class of  workers that has access to this option and other workers who do not. 

3) There's a conflict in what workers and employers saying about productivity during the pandemic. In this survey data, workers typically report being more productive from home. But employers often report that productivity is lower when people are working at home (for example, see "What Jobs are Being Done at Home During the Covid-19 Crisis? Evidence from Firm-Level Surveys," by Alexander W. Bartik, Zoe B. Cullen, Edward L. Glaeser, Michael Luca & Christopher T. Stanton, NBER Working paper #27422 , June 2020). One possible reason for this gap is that many of those working from home are happy to be doing it, and they are overestimating their productivity. Another possible reason is that workerks tend to focus on their productivity in doing specific day-to-day tasks, but employers are also looking at activities like the benefits of training or brainstorming that may be facilitated by more informal face-to-face interactions. 

4) Finally, there's a lot of research on the "economics of density," which tends to find that workers who are grouped together have higher productivity. After all, there's a reason why cities and downtown areas with concentrated employment came into existence in the first place, and why they have been the engines of economic growth over time. The after-effects of the pandemic will test this connection. If those who work closely in a physical sense continue to have higher pay and productivity, then those who work from home are likely to gain flexibility but suffer some career slowdowns, because they aren't where the action is. Perhaps employers and firms have now learned how to gain the benefits of physical closeness via web-based conference calls. Or maybe not. 

For an overview of these arguments about the economics of density, the Summer 2020 issue of the Journal of Economic Perspectives has a useful Symposium on the Productivity Advantages of Cities: 
For a previous post on this topic from last spring, see "Will Telecommuting Stick?"(May 26, 2020).

 -- via my feedly newsfeed