Friday, May 24, 2019

Gabiel Zucman: Where the wealthy hide their money

The Wealth Detective Who Finds the Hidden Money of the Super Rich

Thirty-two-year-old French economist Gabriel Zucman scours spreadsheets to find secret offshore accounts.

Gabriel Zucman started his first real job the Monday after the collapse of Lehman Brothers. Fresh from the Paris School of Economics, where he'd studied with a professor named Thomas Piketty, Zucman had lined up an internship at Exane, the French brokerage firm. He joined a team writing commentary for clients and was given a task that felt absurd: Explain the shattering of the global economy. "Nobody knew what was going on," he recalls.

At that moment, Zucman was also pondering whether to pursue a doctorate. He was already skeptical of mainstream economics. Now the dismal science looked more than ever like a batch of elaborate theories that had no relevance outside academia. But one day, as the crisis rolled on, he encountered data showing billions of dollars moving into and out of big economies and smaller ones such as Bermuda, the Cayman Islands, Hong Kong, and Singapore. He'd never seen studies of these flows before. "Surely if I spend enough time I can understand what the story behind it is," he remembers thinking. "We economists can be a little bit useful."

relates to The Wealth Detective Who Finds the Hidden Money of the Super Rich
Featured in Bloomberg Businessweek, May 27, 2019. Subscribe now.
PHOTOGRAPHER: CAYCE CLIFFORD FOR BLOOMBERG BUSINESSWEEK

A decade later, Zucman, 32, is an assistant professor at the University of California at Berkeley and the world's foremost expert on where the wealthy hide their money. His doctoral thesis, advised by Piketty, exposed trillions of dollars' worth of tax evasion by the global rich. For his most influential work, he teamed up with his Berkeley colleague Emmanuel Saez, a fellow Frenchman and Piketty collaborator. Their 2016 paper, "Wealth Inequality in the United States Since 1913," distilled a century of data to answer one of modern capitalism's murkiest mysteries: How rich are the rich in the world's wealthiest nation? The answer—far richer than previously imagined—thrust the pair deep into the American debate over inequality. Their data became the heart of Vermont Senator Bernie Sanders's stump speech, recited to the outrage of his supporters during the 2016 Democratic presidential primary.

Zucman and Saez's latest estimates show that the top 0.1% of taxpayers—about 170,000 families in a country of 330 million people—control 20% of American wealth, the highest share since 1929. The top 1% control 39% of U.S. wealth, and the bottom 90% have only 26%. The bottom half of Americans combined have a negative net worth. The shift in wealth concentration over time charts as a U, dropping rapidly through the Great Depression and World War II, staying low through the 1960s and '70s, and surging after the '80s as middle-class wealth rolled in the opposite direction. Zucman has also found that multinational corporations move 40% of their foreign profits, about $600 billion a year, out of the countries where their money was made and into lower-tax jurisdictions.

Share of U.S. Wealth Held by the Top 1%

Data: Gabriel Zucman

Like many economists, Zucman and Saez have embraced the political implications of their research. Unlike many, they champion policy recommendations that are bold and aggressive. Before Massachusetts Senator Elizabeth Warren started her 2020 presidential campaign by proposing a wealth tax, she consulted the pair, who estimated that her tax would bring in $2.8 trillion over the next decade. She conferred with them again before floating a corporate tax on profits above $100 million, which they calculated would raise more than $1 trillion over 10 years. Sanders came looking for their advice on his estate tax plan, which would establish rates as high as 77% on billionaires. And when New York Representative Alexandria Ocasio-Cortez proposed on 60 Minutes to hike the top marginal tax rate to as much as 70% on income above $10 million, Zucman and Saez were fast out with a New York Timesop-ed in support.

The pair has now written a cookbook of sorts for any 2020 candidate looking to soak the rich. The Triumph of Injustice, to be published by W.W. Norton & Co. early next year, focuses on how wealth disparity can be fought with tax policy. The tools Zucman has identified to date challenge a series of assumptions, fiercely held by many economists and policymakers, about how the world works: That unfettered globalization is a win-win proposition. That low taxes stimulate growth. That billionaires, and the superprofitable companies they found, are proof capitalism works. For Zucman, the evidence suggests otherwise. And without taking action, he argues, we risk an economic and political backlash far more destabilizing than the financial crisis that sparked his work.

The Wealth Detective
    The Wealth Detective

    America's top wealth detective probes the secrets of the super rich in a tidy, white-walled office with an enviable view of the San Francisco Bay. His methods are unusually brute-force compared with those of recent-vintage U.S. economists, relying not on powerful computers, regression analyses, or predictive models, but on simple, voluminous spreadsheets compiling the tax tables, macroeconomic datasets, and cross-border-flow calculations of central banks. He does it on his own, only rarely outsourcing to graduate students.

    "You can conduct this detective work only if you do it to a large extent yourself," he says. "The wealth is not visible in plain sight—it's visible in the data." Lately, he adds, the Bay Area humming outside his window, "I see more of Silicon Valley in my Excel spreadsheets, especially in the amount of profits booked in Bermuda and Ireland."

    Born and raised in Paris, Zucman is the son of two doctors. His mother researches immunology, and his father treats HIV patients. Politics was a frequent dinnertime topic. He says the "traumatic political event of my youth" occurred when he was 15. Jean-Marie Le Pen, founder of the far-right National Front party, edged out a socialist candidate to win a spot in the final round of 2002 presidential voting. Zucman remembers joining the spontaneous protests that followed. "A lot of my political thinking since then has been focused on how we can avoid this disaster from happening again," he says. "So far, we've failed." (Le Pen's daughter made the presidential runoff in 2017 and won almost twice as many votes as her father.)

    Zucman met his future wife, Claire Montialoux, in 2006, in a university economics class. She's now finishing her Ph.D. dissertation, which shows how the U.S.'s expansion of the minimum wage in the late 1960s and '70s helped black workers, narrowing the racial earnings gap. "We share the same vision for why we are doing social sciences," Zucman says. "The ultimate goal is how can we do better?"

    His own graduate work in Paris saw him compile evidence that the world's rich were stowing at least $7.6 trillion in offshore accounts, accounting for 8% of global household financial wealth; 80% of those assets were hidden from governments, resulting in about $200 billion in lost tax revenue per year. At the same time, he was helping his adviser, Piketty, pull together more than 300 years of wealth and income data from France, Germany, the U.K., and the U.S. They co-authored a paper on the numbers, which became a key part of Piketty's surprise 2014 bestsellerCapital in the Twenty-First Century. The following year, Zucman's doctoral research was also published as a book, The Hidden Wealth of Nations.

    He arrived in the U.S. in 2013, the same year President Obama was declaring inequality "the defining challenge of our time." Zucman had been recruited to Berkeley by Saez, winner of economics' prestigious John Bates Clark Medal in 2009 and a MacArthur Fellowship in 2010. They took up offices next to each other and set about trying to solve the riddle of America's hidden wealth, unveiling their estimates as a draft paper the following year.

    relates to The Wealth Detective Who Finds the Hidden Money of the Super Rich
    Saez
    PHOTOGRAPHER: CAYCE CLIFFORD FOR BLOOMBERG BUSINESSWEEK

    None of it was easy. Tax collectors such as the IRS generally require taxpayers to report income, not wealth. And much of the world's wealth is held in forms—homes, art, retirement accounts, non-dividend-paying stocks—that produce no income prior to a sale. A real estate mogul with a billion-dollar property portfolio and billions more in cash stashed overseas can still report a tiny income. Most inequality researchers therefore rely on voluntary surveys, which often fail to identify enough of the very richest, or data on the estate tax, which has gotten easier and easier to avoid.

    Zucman and Saez started with the IRS. The agency opens its doors to researchers under strict conditions, and only Saez, a U.S. citizen, was allowed inside a facility, where he downloaded anonymized statistics up to the extreme end of the income scale. The duo then translated the data into wealth estimates. Saez had had the idea for a while. "I was doubting how that could actually be done, because there are so many complications," he says. "And then Gabriel came along." With each asset class, from equities and real estate to pensions and insurance, they painstakingly estimated the relationship between income and wealth in the U.S., checking and tweaking based on data from external sources.

    They found that something cataclysmic happened around 1980. As Ronald Reagan was winning the White House, the top 0.1% controlled 7% of the nation's wealth. By 2014, after a few decades of booming markets and stagnant wages, the top 0.1% had tripled its share, to 22%, a bit more wealth than the bottom 85% of the country controlled. The data showed the extent of the problem and the absence of a solution: In the aftermath of the financial crisis, while middle-class Americans were burdened by job losses and debt, the rich had swiftly resumed their party. Wealth that had vanished from financial markets after Lehman's collapse had reappeared, doubling and tripling the portfolios of well-off investors.

    U.S. Wealth Distribution, 2014

    Data: World Inequality Database

    Some eminent economists, including the University of Chicago's Amir Sufi and Nobel laureate and New York Timescolumnist Paul Krugman, endorsed the findings, but others were skeptical. The new numbers were much higher than previous estimates, including those of the Federal Reserve's Survey of Consumer Finances, which is based on detailed responses provided by Americans and is widely considered the best measure of U.S. wealth.

    The disputes over Saez and Zucman's methodology were highly technical. Fed economists said the Berkeley pair were underestimating the investment returns the very rich were earning, which had the counterintuitive effect of overestimating the fortunes from which they drew their income. Saez and Zucman rejected that criticism but made other adjustments to their method and updated the numbers to reflect revised macroeconomic data. Their estimate of the 0.1%'s wealth share dropped a couple of percentage points, to about 20%, still a startling figure. Then, in 2017, the Fed released a survey incorporating methods it said better captured the wealth of the very rich; the central bank cited Zucman and Saez's work in an accompanying paper. Its latest figures showed a jump in inequality, with the top 1%'s share rising from 36% in 2013 to 39% in 2016, matching the pair's estimate.

    At conferences and seminars, Zucman's peers still occasionally sound baffled by his work. Economists often aim for precise, unassailable conclusions, but he's "comfortable getting a 'rough justice' answer to a question" if it helps fill in a big gap in knowledge, says Reed College economics professor Kimberly Clausing, an expert on corporate profit shifting. "I admire the fact that he's willing to look at these harder questions." Saez says Zucman's "defining characteristic is that he's not moored to the traditional economic model." In the end, Saez adds, "that gives him tremendous power to make progress."
     

    Economists argue over the timing and size of the U.S.'s inequality surge, but few deny the broader trend. We live in an age in which the richest man in modern history is reduced by divorce to merely the richest man alive and in which even the most generous billionaires can't give away money faster than they're bringing it in. The debate now raging is over how inequality deepened to this extent and what, if anything, to do about it.

    On one hand are those who argue that great wealth is somehow natural, the result of technology, globalization, and pro-growth policies bestowing outsize rewards on the smartest and most resourceful. Returning to postwar marginal tax rates of 70% or higher, they say, would discourage innovation and hurt the economy. Ken Griffin, a hedge fund manager who made news in January by dropping $360 million on two abodes in London and New York, told Bloomberg News the following month that such tax hikes would represent attempts to "destroy the wealth creators of our society."

    Others see these types of proposals as necessary to address the economic and political distortions that lead to wealth stratification. In her campaign announcement, Warren described President Trump as "the latest and most extreme symptom of what's gone wrong in America, a product of a rigged system that props up the rich and the powerful and kicks dirt on everyone else." Even some billionaires have gotten the religion. In April, Ray Dalio, founder of Bridgewater Associates, the world's largest hedge fund, called the widening U.S. economic divide a "national emergency" that, left unaddressed, will lead to "some form of revolution."

    Zucman sees ominous signs in the rise of the far right—the threat that has preoccupied him since he was a teenager on the streets of Paris. Inequality, he says, paves the way for demagogues. The causes he's identified for the widening gap in the U.S. are a host of policy changes that started in the 1980s: lower taxes on the wealthy, weaker labor protections, lax antitrust enforcement, runaway education and health-care costs, and a stagnant minimum wage. America's skyrocketing wealth disparity, he says, reflects that "it's also the country where the policy changes have been the most extreme."

    When Reagan cut the top marginal tax rate from 70% to 28% across eight years, and later, when Presidents Bill Clinton and George W. Bush slashed tax rates for investors, they were doing so on the advice of economists. The prevailing belief, backed by theoretical models, was that lower taxes on the wealthy would stimulate more investment and thus more economic growth. The real world hasn't been kind to those theories.

    Since the era of liberalization and globalization began about 40 years ago, America's economic growth has been markedly slower than it was the four decades prior. And though Zucman acknowledges that gross domestic product has risen faster in the U.S. than in other developed countries, he points out that the same is true of population. Measured in GDP per person or national income per adult, U.S. growth since 1980 is hard to distinguish from the pace in France, Germany, or Japan. Meanwhile, the typical worker was better off abroad. From 1980 to 2014, for example, incomes for the poorest half of Americans barely budged, while the poorest half in France saw a 31% increase. "The pie has not become bigger" in the U.S., Zucman says. "It's just that a bigger slice is going to the top."

    Share of Wealth Within Select Countries, 2014

    Data: World Inequality Database

    The actual effect of lower taxes on the rich, he argues, isn't to stimulate the economy but to further enrich the rich and further incentivize greed. In his analysis, when the wealthy get tax breaks, they focus less on reinvesting in businesses and more on hiring lobbyists, making campaign donations, and pursuing acquisitions that eliminate competitors. Chief executive officers, for their part, gain additional motivation to boost their own pay. "Once you've created a successful business and the wealth is established and you own billions of dollars, then what these people spend their time doing is trying to defend that position," Zucman says.

    Even some inequality researchers question his and Saez's proposal to restore postwar tax rates, though. Columbia University's Wojciech Kopczuk, who once studied estate tax data with Saez, says citing inequality as grounds for such changes sounds "like an ex post facto justification of things you would want to do anyway." The consequences of these policies, he notes, might include causing truly innovative entrepreneurs to lose control of their businesses. "Once you start naming these problems, you realize there are other solutions," he says. He suggests the U.S. would be better off aggressively enforcing antitrust laws or tightening campaign finance laws.

    Zucman says the response to inequality must be aggressive because wealth is self-reinforcing. The rich can always earn more, save more, and then spend more than everyone else to get their way. He considers Trump's 2017 tax law—which slashed rates on corporations, created a new deduction for business owners, and made the estate tax even easier to avoid—to be a textbook example. After decades of rising inequality and policies favorable to the top 0.1%, the U.S. delivered the rich a boatload of new goodies. "It's hard not to interpret that as a form of political capture," Zucman says.
     

    "The wealth is not visible in plain sight—it's visible in the data"

    Inside a Berkeley lecture hall in February, Zucman stepped 100 or so undergraduates through a few centuries of inequality, from slavery and the Industrial Revolution to the internet and climate change. Dressed in black, bearded, and pacing the front of the lecture hall, he approvingly quoted the classical 18th century economist Adam Smith on trade's powerful impact on growth. This, he pointed out, is how countries such as China and South Korea pulled themselves up from poverty—an example of how at least one form of inequality, between nations, was addressed.

    For someone whose policy prescriptions are occasionally cast as radical, Zucman's demeanor and rhetoric tend to the mild. He peppered the class with questions, urging reluctant undergraduates to offer their own explanations for economic history and stumbling briefly, despite his excellent English, over a student's use of the expression "two heads are better than one." He warned everyone that if the trends continue, their future could resemble the distant past.

    In the slow-growing, hierarchical societies leading up to the 20th century, he said, the most important factor determining your economic prospects was the class into which you were born; from Italy to India, the poor stayed poor and the rich stayed rich. By the mid-20th century, though, the most crucial factor was the country of your birth. In the U.S. and Western Europe, rags-to-riches stories became common, if not routine. Maybe, Zucman warned, the 20th century was an egalitarian anomaly and inherited wealth would again dominate. The question, he said, is "how to have a meritocratic society when so much of wealth comes from the past."

    That day he also met with Saez to talk about a website the two were building. It had been a few weeks since Warren unveiled her wealth tax, and the men were creating a customizable tool to show the math underlying her proposal and let others formulate plans of their own. Saez mostly ran the meeting, but Zucman offered one suggestion: Give users the option of setting the rates as high as possible. Saez smiled and agreed.

    Polls suggest that voters like Warren's wealth tax, which would levy 2% on fortunes greater than $50 million and 3% on those higher than $1 billion. But the idea of taxing wealth, rather than income, alarms some policy experts and more than a few billionaires. Speaking on NPR, Howard Schultz, former Starbucks Corp. CEO and a potential independent presidential candidate, called Warren's proposal "ridiculous," adding, "You can't just attack these things in a punitive way."

    Others question how the government would value the assets of the rich, including their private businesses. Ideas such as Warren's "work very poorly in practice," Columbia's Kopczuk says. "There is a reason why many countries get rid of wealth taxes." At least 15 European countries have tried them; all but four have repealed them, most recently France.

    Zucman responds that most European wealth taxes are poorly designed and that the practical issues can be resolved. For starters, such taxes must be created without loopholes allowing money to be stashed in trusts or offshore accounts. Then, with the legal regime in place, data technology could help tax collectors such as the IRS track and value wealth. A worldwide financial registry—or, failing that, the collection agencies—could require the rich to report all their transactions, exposing their holdings to scrutiny while providing the data needed to valuate similar assets. "Too many people just start from the assumption that it's impossible," he says.

    The scope of the possible started widening after the financial crisis, as the U.S. and then the European Union moved to crack down on offshore shelters. The Panama Papers, a leak of millions of documents from a Central American law firm, pushed policymakers further. "We've won the argument," says Alex Cobham, CEO of Tax Justice Network, an independent international advocacy group. "More or less everyone thinks banking secrecy should be finished."

    In recent months, Zucman has devoted a great deal of energy to the question of how multinational corporations avoid taxes. He's produced papers and policy briefs showing that U.S. multinationals shift almost half of their overseas profits to five havens—Ireland, the Netherlands, Singapore, Switzerland, and the Greater Caribbean, which includes Bermuda. "That is a huge problem for the sustainability of globalization," he says. Countries and territories are engaged in a race to the bottom, Zucman argues, offering ever-lower corporate rates in the fear that companies will shift their profits elsewhere. He proposes to "annihilate" such competition by apportioning profits based on where sales were made.

    These ideas might be nonstarters today, but Zucman professes to take the long view. Remember, he points out, that the U.S. Supreme Court ruled the income tax unconstitutional in 1895; it took a constitutional amendment to legalize it in 1913. "There's a lot of policy innovation ahead of us," he says.

    When Zucman and Saez's site, wealthtaxsimulator.org, went live in March, it sparked some of that hoped-for innovation. One proposal, posted on Twitter by Adam Bonica, a political science professor at Stanford, was for a 100% tax on wealth beyond $500 million. He based it on what he called "Beyoncé's rule," which he explains as, "Think of the most talented and hardest-working person you know, and think about how much money they have and how much money they deserve." Queen Bey, he tweeted, has an estimated net worth in the neighborhood of half a billion dollars. "Let's have Howard Schultz explain to us why he should be worth more than Beyoncé."

    --
    John Case
    Harpers Ferry, WV
    Sign UP HERE to get the Weekly Program Notes.

    Mark Thoma: Links (5/22/19) [feedly]

    a collection of recent top articles via Mark Thoma

    Links (5/22/19)
    https://economistsview.typepad.com/economistsview/2019/05/links-52219.html

     -- via my feedly newsfeed


    • Robo-Apocalypse? Not in Your Lifetime - J. Bradford DeLong Not a week goes by without some new report, book, or commentary sounding the alarm about technological unemployment and the "future of work." Yet in considering the threat posed by automation at most levels of the value chain, we should remember that robots cannot do what humans cannot tell them to do.
    • The Economy Is Strong. So Why Do So Many Americans Still Feel at Risk? - Jacob Hacker President Trump is running for re-election on the strength of the economy, and why not? The unemployment rate is lower than it's been in five decades. The stock market is booming. Overall economic growth has been steady. There's just one problem: Voters are not particularly enthused about it. Recent polls suggest a substantial majority of Americans feel the economy is working only for "those in power." A big reason for this disconnect is that many Americans feel insecure.
    • Origins of "Microeconomics" and "Macroeconomics" - Timothy TaylorEconomists have written about topics that we would now classify under the headings of "microeocnomics" or "macroeconomics" for centuries. But the terms themselves are much more recent, emerging only in the early 1940s. For background, I turn to the entry on "Microeconomics" by Hal R. Varian published in The New Palgrave: A Dictionary of Economics, dating back to the first edition in 1987.
    • Yet More Scary Graphs of Manufacturing: Midwest Edition - Econbrowser In every single state in the Great Lakes region, save Michigan, manufacturing employment has either peaked or (charitably) gone on a growth hiatus.
    • The rise of corporate market power - Brookings The rise of corporate market power is receiving increasing attention in research and public discourse—including the current U.S. presidential election debate—with good reason. The IMF's April 2019 World Economic Outlook (WEO) has a chapter on the topic, which I had the opportunity to discuss at a recent conference. Author Zia Qureshi Visiting Fellow - Global Economy and Development Increased interest in market power is motivated by some mega trends or puzzles. The "productivity puzzle": Productivity growth has slowed even as new technologies, led by the digital revolution, have boomed. The "investment puzzle": Investment has slowed even as the cost of borrowing has been low and corporate profits high. Sluggish productivity and investment have contributed to slower economic growth. Income and wealth inequalities have risen, sharply in some countries, such as the U.S. Income has shifted from labor to capital, and the distribution of both labor and capital income has become more unequal. Wealth has soared, even though investment in productive capital has slowed. These trends have stoked social discontent and political tumult. What explains these puzzles and trends?
    • Strengthening Automatic Stabilizers - Timothy Taylor For economists, "automatic stabilizers" refers to how tax and spending policies adjust without any additional legislative policy or change during economic upturns and downturns--and do so in a way that tends to stabilize the economy. For example, in an economic downturn, a standard macroeconomic prescription is to stimulate the economy with lower taxes and higher spending. But in an economic downturn, taxes fall to some extent automatically, as a result of lower incomes. Government spending rises to some extent automatically, as a result of more people becoming eligible for unemployment insurance, Medicaid, food stamps, and so on. Thus, even before the government undertakes additional discretionary stimulus legislation, the automatic stabilizers are kicking in. Might it be possible to redesign the automatic stabilizers of tax and spending policy in advance so that they would offer a quicker and stronger counterbalance when (not if) the next recession comes?
    • Trump Team Vets Fed Critic for Board Seat - The New York Times The Trump administration is vetting Judy Shelton, a conservative economist and former Trump campaign adviser, for a seat on the Federal Reserve Board, according to people familiar with the matter, putting the longtime Fed critic one step closer to a leadership role at an institution she would like to drastically change.
    • Audits of Highest-Income Taxpayers Fall Again - Center on Budget and Policy Priorities The IRS reported yesterday that it audited fewer millionaires and large corporations in fiscal year 2018 than the previous year, continuing a multi-year decline. Since 2010, the President and Congress have cut IRS funding substantially, causing workforce reductions and shortages of top auditors who have the expertise to review millionaires' and corporations' complex returns. These budget cuts pose a risk to a basic government function — i.e., collecting the revenue needed to fund public services — because the federal government relies largely on voluntary compliance with the tax code and, for such compliance to continue, taxpayers must trust that the IRS is enforcing the law fairly and people are paying the taxes they owe. As a result, policymakers must reverse their deep IRS funding cuts of recent years and commit to a multi-year effort to rebuild the agency.
    • The Economy Is Strong and Inflation Is Low. That's What Worries the Fed. - The New York Times America's job market is booming and the economy is strong, but that combination is not raising prices the way it used to.
    • Unconventional monetary policy: A tale of heterogeneity - VoxEU The ECB's unconventional monetary policy package implemented in February 2012 changed collateral requirements. This column examines the effects in the French credit market, using data on corporate loans. Credit indeed increased after the liquidity injection, exclusively driven by supply. There was also strategic risk-taking by a group of banks, an unintentional implication of the policy.

    scary sgraphs on mfg in the midwest


    Yet More Scary Graphs of Manufacturing: Midwest Edition

    In every single state in the Great Lakes region, save Michigan, manufacturing employment has either peaked or (charitably) gone on a growth hiatus.

    Figure 1: Manufacturing employment by state, in logs, 2019M01=0. Source: BLS, and author's calculations.

    While national manufacturing is still rising (albeit very slowly, essentially flat), it remains less than 0.1% above January levels. And manufacturing employment continues to grow in California (interestingly, a state — California —  by the metrics of the Arthur Laffer-Stephen Moore-John Williams – ALEC economic outlook ranking should be doing very badly is still growing).

    Figure 2: Manufacturing employment by state, in logs, 2019M01=0. Source: BLS, and author's calculations.

    This entry was posted on May 22, 2019 by .

    Post navigation

    43 thoughts on "Yet More Scary Graphs of Manufacturing: Midwest Edition"

    1. Julian SilkMay 22, 2019 at 1:18 am

      Dear Folks,

      A brief response to PGL and others. Lots of people read more than newspapers. If this administration is favoring Russia, good by good, (and yes, I am not discriminating between production by a firm headquartered here which produces in Germany and a firm which produces here, because they can be moved as foreign direct investment, which is already happening to some extent), it is also favoring other states besides the Midwest. OFII can be disputed about FDI figures, but see

      https://siteselection.com/issues/2019/mar/south-carolina-the-souths-magnet-for-foreign-direct-investment.cfm

      and in particular:

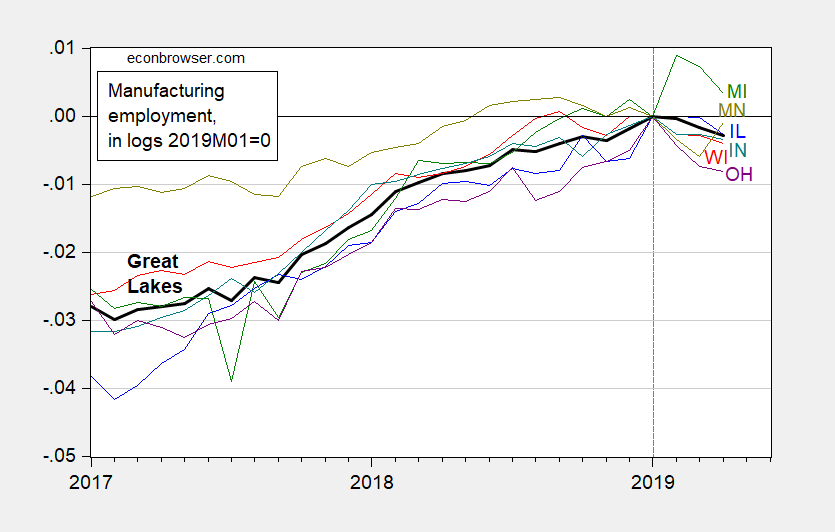
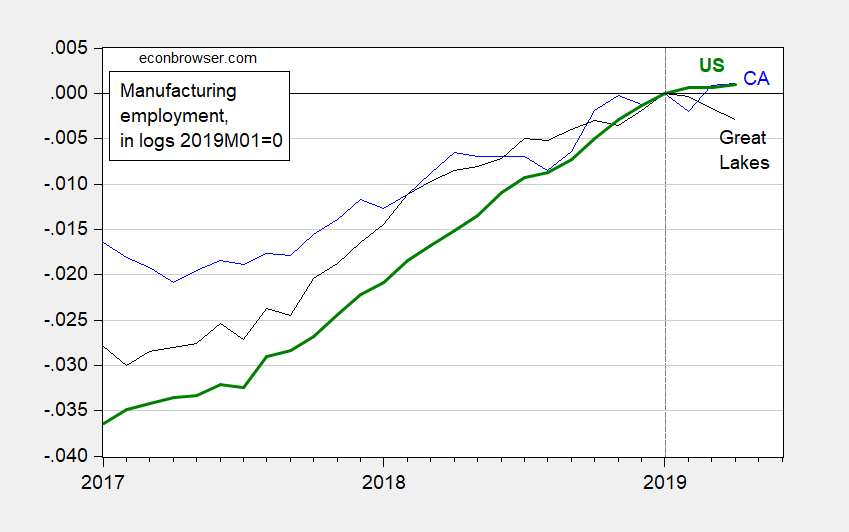
      "In fact, international companies operating in states like Florida, Iowa, Michigan, North Carolina and Ohio have grown their manufacturing workforce by more than 20 percent over that period."

      and

      "10 States with the Fastest FDI Employment Growth Rate Over the Past Five Years: Utah (45.7 percent), Florida (43.8 percent), Tennessee (41.3 percent), Oregon (41.0 percent), Michigan (39.7 percent), Kentucky (37.1 percent), Mississippi (36.3 percent), South Dakota (36.0 percent), Missouri (35.0 percent) and Arizona (34.8 percent). The national average is 24.4 percent.

      Leading American Manufacturing: International companies were responsible for 62 percent of U.S. manufacturing job growth, contributing 377,200 of the 606,000 net manufacturing job gains made from 2011 to 2016 (latest available data). The 10 states with the fastest FDI manufacturing growth rate include: Rhode Island, South Dakota, Oregon, Michigan, Kentucky, Nebraska, Iowa, Tennessee, Utah and Minnesota."

      Are they analyzing the latest data? No. And you can look at the same figures and see employment growth over 2008-2016 and see Ohio and Michigan, depending on what metric you use, as above. But the primary states where manufacturing growth is taking place, with exceptions, are not in the Midwest.

    --
    John Case
    Harpers Ferry, WV
    Sign UP HERE to get the Weekly Program Notes.

    Poverty Line Proposal Would Cut Medicaid, Medicare, and Premium Tax Credits, Causing Millions to Lose or See Reduced Benefits Over Time [feedly]

    Poverty Line Proposal Would Cut Medicaid, Medicare, and Premium Tax Credits, Causing Millions to Lose or See Reduced Benefits Over Time
    https://www.cbpp.org/research/poverty-and-inequality/poverty-line-proposal-would-cut-medicaid-medicare-and-premium-tax

    A proposal the Trump Administration is considering to use a lower inflation measure to calculate annual adjustments to the federal poverty line[1] ultimately would cut billions of dollars from federal health programs and cause millions of people to lose their eligibility for, or receive less help from, these programs. Many such programs use the poverty line to determine eligibility and benefits, and the cuts to these programs — and the numbers of people losing assistance altogether or receiving less help — would increase with each passing year.[2] After ten years:

    More than 250,000 seniors and people with disabilities would lose their eligibility for, or receive less help from, Medicare's Part D Low-Income Subsidy Program, meaning that they would pay higher premiums for drug coverage and more out of pocket for their prescription drugs. Meanwhile, more than 150,000 seniors and people with disabilities would lose help paying for Medicare premiums, meaning that they would have to pay premiums of over $1,500 per year to maintain Medicare physician coverage.
    More than 300,000 children would lose comprehensive coverage through Medicaid and the Children's Health Insurance Program (CHIP), as would some pregnant women. In addition, more than 250,000 adults who gained Medicaid coverage from the Affordable Care Act's (ACA) expansion would lose it.
    More than 150,000 consumers who buy coverage through the ACA marketplaces would lose eligibility for or qualify for reduced cost-sharing assistance, increasing their deductibles by hundreds or even thousands of dollars. And tens of thousands would lose eligibility for premium tax credits altogether, driving their premiums up, in many cases by thousands of dollars. In addition, millions of consumers who buy coverage in the marketplace would still get premium tax credits, but their credits would be smaller. They, too, would thus have to pay higher premiums; these increases would start small but would grow over time.

    EITHER CHANGE WOULD LIKELY MAKE THE POVERTY LINE LESS ACCURATE OVERALL WHILE ALSO INCREASING THE NUMBER OF PEOPLE WITHOUT HEALTH INSURANCE AND EXPERIENCING OTHER FORMS OF HARDSHIP.The Administration, through an Office of Management and Budget notice, has requested public comment on changing the measure used to adjust the poverty line each year for inflation using an alternative index, such as the chained Consumer Price Index (CPI) or the Personal Consumption Expenditures Price Index (PCEPI). Both measures rise more slowly than the current measure, the CPI for All Urban Consumers (CPI-U).[3] As a result, either alternative measure would result in a lower poverty line, and the gap between the poverty line under the current versus either of the proposed methodologies would widen each year. The Administration claims that it seeks to make the poverty line more accurate, but, as explained below, either change would likely make the poverty line less accurate overall while also increasing the number of people without health insurance and experiencing other forms of hardship.

    This analysis focuses on the impact of updating the poverty line using the chained CPI; using the PCEPI would have a somewhat larger effect, meaning that even more people would lose eligibility for health coverage programs, and the cuts to these programs would be even larger.[4]

    FIGURE 1


    Proposed Change Would Have Wide-Ranging Impacts on Health Programs

    Over time, the change to the poverty line would cut a wide range of health programs. (See Figure 1.) By the tenth year, the annual cut across federal health coverage programs would total in the billions of dollars, Congressional Budget Office (CBO) estimates indicate.[5] That's because millions of people would either lose eligibility for these programs or receive less help. Based on the current income distribution of program enrollees relative to the poverty line, we estimate that updating the poverty line using the chained CPI would, after ten years, have the effects described below. These estimates are subject to significant uncertainty, but, taken as a whole, they provide a snapshot of the wide-ranging impact the Administration's proposal would have across health programs.[6] (For a detailed explanation of the methodology behind our estimates, see the Appendix.)

    The impacts of the proposal would also continue to grow after the tenth year: impacts on program eligibility thresholds would roughly double between the tenth and twentieth year the policy was in effect (and continue growing after that).

    Impact on Seniors and People With Disabilities Covered Through Medicare

    While eligibility for Medicare does not depend on income, lower-income Medicare enrollees qualify for help paying premiums, deductibles, and other cost sharing through Medicaid or the Medicare Low-Income Subsidy (LIS) program. In many cases, eligibility for that assistance is based on the federal poverty line.

    Medicare enrollees can qualify for extra help through Medicaid in one of two ways:

    They can qualify for full Medicaid benefits, including help with Medicare cost sharing and long-term care services and supports (which Medicare does not cover), generally either because they have incomes below certain thresholds (or high medical need relative to their incomes) or because they qualify for the Supplemental Security Income program.
    They can qualify just for Medicaid programs that help with Medicare cost sharing, generally based on whether they have income below 100 or 135 percent of the poverty line.

    Medicare enrollees who qualify for extra help through Medicaid also qualify for the LIS program, which helps pay premiums and cost sharing for Medicare prescription drug coverage (Medicare Part D). In addition, Medicare enrollees not enrolled in Medicaid can qualify for either full or partial LIS benefits based on whether they have income below 135 or 150 percent of the poverty line.

    After ten years of updating the poverty line using the chained CPI:

    More than 250,000 low-income seniors and people with disabilities would lose eligibility for, or get less help from, the LIS Program, substantially increasing their prescription drug costs.Most of these people would no longer be eligible for the full LIS benefit. Based on 2019 program parameters, they would have to pay premiums of about $100 per year, instead of no premiums, to maintain prescription drug coverage through Medicare Part D; would have a standard deductible of $85, instead of no deductible, for their Part D coverage; and would pay 15 percent of the cost of drugs (instead of small copayments) once they meet the deductible (and until they hit the catastrophic limit, $5,100 in out-of-pocket spending).[7]Others would lose eligibility for the partial LIS benefit. Based on 2019 program parameters, that means they would have to pay premiums averaging about $400 instead of about $300 per year to maintain prescription drug coverage through Medicare Part D; would have a standard deductible of $415, instead of $85, for prescription drug coverage; and would pay 25 percent or more, instead of 15 percent, of the cost of their drugs once they meet the deductible and until they reach the catastrophic limit.[8]
    More than 150,000 low-income seniors and people with disabilities would lose eligibility for a Medicaid program that covers their Medicare Part B premium. That means they would have to pay premiums out of pocket to maintain Medicare coverage for physician and other outpatient care. The 2019 Part B premium is $1,626 per year ($135.50 per month).
    Many other low-income seniors and people with disabilities would lose eligibility for a Medicaid program that helps them afford their Medicare deductibles and other cost sharing.[9] Since Medicaid would no longer cover their Medicare hospital or physician cost sharing, they could face a hospital deductible of $1,364, a physician services deductible of $185, and additional co-insurance and copays (based on 2019 program parameters), compared to generally no cost sharing currently.

    Impact on Children and Adults Covered Through Medicaid and CHIP

    Most child and adult enrollees qualify for Medicaid and CHIP based on their incomes, and the income cut-offs for these programs are generally based on the federal poverty line. After ten years of updating the poverty line using the chained CPI:

    More than 300,000 children would lose Medicaid or CHIP coverage, and some pregnant women would lose Medicaid or CHIP coverage, as well. In the median state, the policy change would be equivalent to lowering the eligibility threshold for children from 255 to 250 percent of the poverty line, calculated using the current methodology, and for pregnant women from 205 to 201 percent of the poverty line.[10]
    More than 250,000 adults who gained coverage from states' expansion of Medicaid through the ACA would lose it, because the policy change would effectively lower the income threshold for coverage from 138 percent to about 135 percent of the poverty line. Some very low-income parents covered through Medicaid in non-expansion states also would lose coverage.

    Most of these enrollees would likely qualify for subsidized coverage through the ACA marketplaces. But not all would. Parents in non-expansion states would fall into the "coverage gap:" their incomes would be too high for Medicaid and too low to qualify for marketplace tax credits. And people whose employers offer them coverage usually can't qualify for premium tax credits through the marketplaces, even if the employee premium for their coverage is higher than they can realistically afford. This can be a particular barrier to coverage for children, because, due to the so-called "family glitch," the entire family is ineligible for premium tax credits if a parent is offered self-only coverage with an employee premium below 9.86 percent of income, even if the premium for family coverage is significantly higher.

    Moreover, for near-poor adults losing Medicaid coverage, marketplace plans would generally come with higher premiums and cost sharing, leading to lower take-up of coverage and barriers to obtaining needed care.[11] Notably, the uninsured rate for adults with incomes just above the poverty line is about 34 percent in non-expansion states, where they have access to marketplace coverage, compared to 17 percent in expansion states, where they instead have access to Medicaid.[12] And for children losing Medicaid or CHIP, marketplace plans may offer less comprehensive coverage.[13] Overall, a significant number of those losing Medicaid or CHIP coverage as a result of the poverty line change would likely become uninsured, while many others would likely experience greater difficulty affording coverage or getting needed care.

    In addition to people losing comprehensive coverage through Medicaid, many thousands of people, mostly women, would lose Medicaid coverage for family planning services. Twenty-five states provide Medicaid coverage for family planning services to people not otherwise eligible for Medicaid. In 22 of these states, eligibility is based on income relative to the poverty line, so the proposed change would cause people to lose coverage for these services, which are essential for women's health and family well-being.[14] (Many of these are states that have not taken up the ACA Medicaid expansion, and so even very low-income adults are not eligible for comprehensive Medicaid coverage.)

    Impact on ACA Marketplace Consumers

    Because premium tax credit eligibility and the credit amounts are calculated based on consumers' income relative to the poverty line, about 6 million marketplace consumers would see reductions in their premium tax credits and consequently have to pay higher premiums. These cuts would start small, but would grow over time.

    Notably, almost all of these consumers also will see higher premiums due to another recent Administration action. Similar to the proposed poverty line change, the Administration's 2020 rule setting standards for the ACA marketplaces made a seemingly technical change to the formula for calculating premium tax credits, impacting tax credits and therefore premiums for millions of people.[15] After ten years, a family of four making $80,000 would pay over $300 more in annual premiums as a combined result of this change and the proposed change to the poverty line.

    In addition, growing numbers of people would lose eligibly for premium tax credits or cost-sharing assistance altogether. After ten years of updating the poverty line using the chained CPI:

    Tens of thousands of consumers no longer would qualify for premium tax credits at all, since the policy change would effectively lower the income cut-off for the tax credits from 400 percent to 392 percent of the poverty line. Older people and families would see particularly large premium increases, since they would lose tax credits worth thousands of dollars.
    More than 200,000 consumers would face reductions in the cost-sharing assistance they receive, meaning that their deductibles, co-insurance, copays, and total limits on out-of-pocket costs would increase. That includes:

    More than 50,000 people who would see their deductibles increase from about $250 to about $850, based on 2019 cost-sharing levels.[16]
    More than 50,000 people who would see their deductibles increase from about $850 to about $3,200.
    Tens of thousands of people who would see their deductibles increase from about $3,200 to about $4,400.

    Administration's Arguments for Change Are Flawed

    The Administration's argument for the potential policy change is that the chained CPI is a more accurate measure of inflation. But it is not clear whether the chained CPI is a more accurate measure for low-income households. For example, low-income households spend more of their income on housing, for which costs have been increasing faster than the overall CPI in recent years. Two recent studies suggest that, at least in recent years, inflation for low-income households has been higher than for the population as a whole.[17]

    Meanwhile, evidence indicates that the poverty line is already below what is needed to raise a family. Considerable research over the years — including a major report by the National Academy of Sciences[18] — has identified various ways in which the poverty line appears to be inadequate. For example, the poverty line doesn't fully include certain costs that many low-income families face, like child care. In accordance with the guidance of the National Academy of Sciences panel, federal analysts worked carefully with researchers over a number of years to develop the Supplemental Poverty Measure (SPM), which more fully measures the cost of current basic living expenses. With this more careful accounting, the SPM's poverty line is higher than the official poverty line for most types of households, and its poverty rate is slightly higher than the official poverty rate.

    By focusing on just one of many questions about the current poverty measure (how it is updated for inflation), and proposing a change that would lower the poverty line, the Administration's proposal would likely make the poverty line less accurate overall in measuring what families need to get by.[19] Consistent with this, the data show that households just above the poverty line have high rates of material hardship: for example, high uninsured rates and difficulty affording health care, as well as high rates of food insecurity.[20]

    Importantly, no statute or regulation requires the Administration to revisit the current methodology for updating the poverty line. Rather, the Administration is making an entirely discretionary choice to consider a change that would weaken health coverage programs and increase uninsured rates and other hardship — part of a broader policy agenda of undermining health coverage programs.[21]

    Appendix: Methodology Behind Estimates

    Our estimates reflect the impact of updating the Census poverty thresholds using the chained CPI rather than the CPI-U for ten years, starting with the 2018 thresholds (which will be finalized in 2019), based on CBO's economic projections.[22] We adjust for changes in program enrollment, again using CBO projections. However, all of our estimates are based on the current income distribution of program enrollees relative to the poverty line, without taking into account how the income distribution may shift over the coming decade. In some cases, this limitation likely leads us to modestly overstate the impact of eligibility changes, but it should not change the qualitative conclusions.

    Medicare enrollees. Our general approach is to use 2017 American Community Survey (ACS) data to estimate the share of Medicare enrollees with incomes between the current eligibility thresholds for various assistance programs and the lower thresholds that would result from updating the thresholds with the chained CPI for ten years. We apply these percentages to administrative tallies of the number of people enrolled in the relevant program and scale those estimates by CBO's projection of Part D LIS enrollment growth through 2029.

    Specifically, to estimate the number of people losing eligibility for the Qualifying Individual (QI) program (which pays Medicare Part B premiums), we estimate the share of Medicare enrollees with incomes between 120 and 135 percent of the poverty line who fall into the income range that would lose eligibility. We apply that percentage to 2013 QI enrollment (the most recent available data) and scale based on projected LIS enrollment growth.

    People losing eligibility for the QI program would also lose eligibility for the full LIS benefit. To estimate the number of additional people losing full LIS eligibility, we first estimate the number of people receiving full LIS benefits who are not enrolled in Medicaid. Based on CMS data on the number of dual eligible beneficiaries versus the number of LIS full benefit enrollees, more than 1 million people fell into this group in 2018. We estimate the share of Medicare enrollees with incomes below 135 percent of the poverty line who fall into the income range that would lose eligibility for the full LIS benefit, and apply that percentage to the number of full LIS beneficiaries not enrolled in Medicaid, and scale based on projected LIS enrollment growth.

    Finally, to estimate the number of people losing eligibility for the partial LIS benefit, we estimate the share of Medicare enrollees with incomes between 135 and 150 percent of the poverty line who fall into the income range that would lose eligibility. We apply that percentage to 2018 partial LIS enrollment and scale based on projected LIS enrollment growth.

    Medicaid and CHIP enrollees. To estimate the share of Medicaid expansion and child Medicaid and CHIP enrollees who would lose coverage, we use 2017 ACS data to determine the share of Medicaid adult expansion enrollees and Medicaid and CHIP enrollees with income between the current eligibility threshold for those programs and the lower eligibility threshold if the poverty line were to rise by chained CPI growth rather than CPI-U growth for ten years. For children, we account for state-level differences in Medicaid/CHIP eligibility thresholds. We then apply these percentages to CBO projections of Medicaid expansion enrollment and Medicaid and CHIP child enrollment in 2029.

    Marketplace enrollees. To estimate the number of people losing eligibility for cost-sharing assistance or premium tax credits (or receiving reduced cost-sharing assistance), we use 2019 Centers for Medicare & Medicaid Services (CMS) plan selections data, scaled (adjusted downward) based on CBO's projections for the number of subsidized marketplace enrollees in 2029.

    Specifically, we use the data CMS releases on the number of marketplace plan selections by people in different income groups (e.g., 100-150 percent of the poverty line, 150-200 percent of the poverty line) to estimate the number of people with income between the current eligibility thresholds for various forms of assistance and the lower eligibly thresholds that would result from the proposed change after ten years.[23] For example, since the change would lower the income cut-off for cost-sharing assistance from 250 to 245 percent of the current poverty line, we estimate that the number of people in the income range losing eligibility would be one-twentieth of the total number of people with incomes between 200 and 300 percent of the poverty line.[24] We also adjust these estimates for the share of consumers in each income group purchasing silver plans, since only those purchasing silver plans are eligible for cost-sharing assistance.

    To estimate the number of consumers who would see immediate reductions in premium tax credits, we use CMS data on 2018 effectuated enrollment. Starting with the 8.9 million consumers receiving premium tax credits, we subtract the share of consumers who already have zero net premium (and therefore might not be affected by a cut to their premium tax credits) and the share with incomes between 300 and 400 percent of the poverty line (since tax credits would not change for people in this income range).[25]

    TOPICS:
    Health, Poverty and Inequality

    End Notes

    [1] Office of Management and Budget, Request for Comment on the Consumer Inflation Measures Produced by the Federal Statistical Agencies, May 7, 2019, https://www.federalregister.gov/documents/2019/05/07/2019-09106/request-for-comment-on-the-consumer-inflation-measures-produced-by-federal-statistical-agencies.

    [2] The proposal would also affect many basic assistance programs beyond health-related ones; for a partial list, see Department of Health and Human Services, "What Programs Use the Poverty Guidelines?" https://www.hhs.gov/answers/hhs-administrative/what-programs-use-the-poverty-guidelines/index.html.

    [3] The Office of Management and Budget notice requests comments on how the Census poverty thresholds are updated for inflation. The Department of Health and Human Services (HHS) calculates its poverty guidelines, which are the basis for program eligibility, based on the Census thresholds.

    [4] After ten years, use of the chained CPI would reduce the poverty line by 2.0 percent, while use of the PCEPI would reduce the poverty line by 3.4 percent, according to CBO projections.

    [5] In 2013, CBO produced estimates for two chained CPI proposals, one that would apply the chained CPI government-wide and an Obama Administration budget proposal that excluded the poverty guidelines and means-tested programs more generally from the change. Comparing the two estimates shows that government-wide use of the chained CPI would cut about $4 billion from means-tested health programs by the tenth year (and over $15 billion over ten years); most of these cuts are from the change to the poverty guidelines. See https://www.cbo.gov/system/files?file=2018-09/44231_ChainedCPI_0.pdfand https://www.cbo.gov/sites/default/files/cbofiles/attachments/Government-wide_chained_CPI_estimate-2014_effective.pdf.

    [6] All figures are estimates of the number of people who would otherwise enroll in these programs who would lose eligibility (that is, they take into account that program take-up is less than 100 percent).

    [7] For a more detailed description of LIS and Medicare Savings Program benefits, see https://www.ncoa.org/wp-content/uploads/part-d-lis-eligibility-and-benefits-chart.pdf and https://www.ncoa.org/wp-content/uploads/medicare-savings-programs-coverage-and-eligibility.pdf.

    [8] These and other dollar figures for Medicare premiums and cost sharing correspond to 2019 program parameters. For a summary of the assistance available through the Medicare Low-Income Subsidy Program and the Medicaid Savings Programs, see the following resources from the National Council on Aging: https://www.ncoa.org/wp-content/uploads/part-d-lis-eligibility-and-benefits-chart.pdf and https://www.ncoa.org/wp-content/uploads/medicare-savings-programs-coverage-and-eligibility.pdf.

    [9] The available data do not allow us to estimate the number of people falling into this group, but it would be at least tens of thousands and could be well over 100,000.

    [10] This would occur unless states reset their eligibility thresholds to offset the federal change; it is unlikely that most states would do so.

    [11] Jessica Schubel, "Partial Medicaid Expansions Fall Short of Full Medicaid Expansion With Respect to Coverage and Access to Care," Center on Budget and Policy Priorities, August 13, 2018, https://www.cbpp.org/research/health/partial-medicaid-expansions-fall-short-of-full-medicaid-expansion-with-respect-to.

    [12] Center on Budget and Policy Priorities, "Frequently Asked Questions About Partial Medicaid Expansion," April 10, 2019, https://www.cbpp.org/research/health/frequently-asked-questions-about-partial-medicaid-expansion.

    [13] Kelly Whitener and Tricia Brooks, "Marketplace Coverage Is Not an Adequate Substitute for CHIP," Georgetown Center for Children and Families, September 2017, https://ccf.georgetown.edu/wp-content/uploads/2017/09/Marketplace-v3.pdf.

    [14] Guttmacher Institute, "Medicaid Family Planning Eligibility Expansions," May 1, 2019, https://www.guttmacher.org/state-policy/explore/medicaid-family-planning-eligibility-expansions.

    [15] Aviva Aron-Dine and Matt Broaddus, "Change to Insurance Payment Formulas Would Raise Costs for Millions With Marketplace or Employer Plans," Center on Budget and Policy Priorities, updated April 26, 2019, https://www.cbpp.org/research/health/change-to-insurance-payment-formulas-would-raise-costs-for-millions-with-marketplace.

    [16] Dollar figures for typical deductibles and out-of-pocket limits for consumers qualifying for different tiers of marketplace cost sharing assistance are from Kaiser Family Foundation, "Cost-Sharing for Plans Offered in the Federal Marketplace for 2019," December 5, 2018, https://www.kff.org/health-reform/fact-sheet/cost-sharing-for-plans-offered-in-the-federal-marketplace-for-2019/.

    [17] See, for example, Greg Kaplan and Sam Schulhofer-Wohl, "Inflation at the Household Level," Journal of Monetary Economics, 2017, https://gregkaplan.uchicago.edu/sites/gregkaplan.uchicago.edu/files/uploads/kaplan_schulhoferwohl_jme_2017.pdf, and David Argente and Munseob Lee, "Cost of Living Inequality during the Great Recession," Kilts Center for Marketing at Chicago Booth — Nielsen Dataset Paper Series 1-032, March 1, 2017, https://ssrn.com/abstraSchct=2567357.

    [18] Constance Citro and Robert Michael, eds., "Measuring Poverty: A New Approach," Committee on National Statistics, National Research Council, 1995, http://www.nap.edu/openbook.php?isbn=0309051282.

    [19] For additional discussion, see Sharon Parrott, "Trump Administration Floating Changes to Poverty Measure That Would Reduce or Eliminate Assistance to Millions of Lower-Income Americans," Center on Budget and Policy Priorities, May 7, 2019, https://www.cbpp.org/press/statements/trump-administration-floating-changes-to-poverty-measure-that-would-reduce-or.

    [20] About half of non-elderly adults just above the official poverty line showed one or more forms of financial insecurity, according to a December 2017 Urban Institute survey, similar to the share for the poor. Steven Brown and Breno Braga, "Financial Distress among American Families: Evidence from the Well-Being and Basic Needs Survey," Urban Institute, February 14, 2019, https://www.urban.org/research/publication/financial-distress-among-american-families-evidence-well-being-and-basic-needs-survey/view/full_report.

    [21] For a list of other Administration actions undermining coverage, see https://www.cbpp.org/sabotage-watch-tracking-efforts-to-undermine-the-aca.

    [22] In Medicaid, including the Medicaid Savings Programs and the Medicare Low-Income Subsidy Program, the programmatic impact would be felt in 2029. For marketplace premium tax credits and cost-sharing assistance, the programmatic impact would be felt in 2030.

    [23] These data are available from https://www.cms.gov/Research-Statistics-Data-and-Systems/Statistics-Trends-and-Reports/Marketplace-Products/2019_Open_Enrollment.html.

    [24] Since CMS does not provide data on the number of people with incomes in the range just above 400 percent of the poverty line, we are not able to apply this same approach to estimate the number of people losing eligibility for premium tax credits. But based on the number of plan selections by people with incomes between 300 and 400 percent of the poverty line and the drop-off in the number of consumers at higher income levels across the income distribution, it would be in the tens of thousands.

    [25] In the proposed Notice of Benefit and Payment Parameters for 2020, CMS reported that 17 percent of marketplace consumers have zero net premiums. We estimate the share with incomes between 300 and 400 percent of the poverty line based on the 2019 plan selections data.

    SHARE

     PDF of this report (11 pp.)

     -- via my feedly newsfeed