Thursday, February 15, 2018

Rapid Job Growth, More Education Fail to Translate into Higher Wages for Health Care Workers [feedly]

Rapid Job Growth, More Education Fail to Translate into Higher Wages for Health Care Workers
http://cepr.net/publications/op-eds-columns/rapid-job-growth-more-education-fail-to-translate-into-higher-wages-for-health-care-workers

Eileen Appelbaum
Spotlight on Poverty & Opportunity, February 14, 2018

See article on original site

Health care, an important source of jobs in the US economy, accounts for nearly 13 percent of private sector employment. Unfortunately, despite rapid job growth in the sector, we've also seen wages of many healthcare workers in this critical area of our economy stagnate. Understanding this phenomenon and the factors that may have caused it, including decreased union participation and a shift in bargaining power from workers to employers is important for boosting health sector wages and potentially understanding some of the sources of growing inequality in our broader economy.

Since 2005, employment in health care grew by 20 percent. Hospitals provide the lion's share of jobs but grew by just 10 percent. The much smaller outpatient care segment grew six times faster, with employment increasing by nearly 60 percent. In 2015, the 5 million health care professionals were outnumbered by 5.5 million workers in two non-professional occupational groups — 2.1 million medical technicians and 3.4 million health aides and assistants.

Although robust job growth persisted through the financial crisis and beyond, wages of non-professional health care workers have stagnated. Median real wages of medical technicians working full-time in hospitals fell from $22.00 in 2005 to $21.60 in 2015; in outpatient facilities, their pay fell from $17.84 to $17.67.

Education is often seen as something of a panacea for higher wages but here it does not seem to be the culprit. Improvements in educational attainment for health aides and assistants over the 2005–2015 decade were dramatic. Many of these workers were poorly educated in 2005 — 41.4 percent in hospitals and 32.5 percent in outpatient facilities had a high school degree or less. By 2015, these shares had fallen to 29.4 percent in hospitals and 22.9 in outpatient care.

The share of these workers with some college education rose from 48.4 to 56.5 percent in hospitals and from 55.2 to 59.4 percent in outpatient facilities. By 2015, 62.5 percent of health aides and assistants in hospitals had some college or a four-year degree; more than three-quarters (77.1 percent) in outpatient care had this level of educational achievement.

Nevertheless, median real wages of full-time, full-year workers fell from $14.87 to $14.72 in hospitals and rose by a penny from $14.27 to $14.28 in outpatient facilities over the decade. Despite rapid advances in education, these workers were still earning less than $15-per-hour in 2015.

Rapid job growth and rising levels of education are often presented by policymakers as the cure for low wages. But the experiences of health care workers challenge this conventional wisdom. What, then, can explain the failure of wages to increase despite rising employment and educational levels?

The change in union density in these occupations may be one factor. The Bureau of Labor Statistics reports that union density for support occupations, which includes medical technicians and health aides and assistants, fell slightly from 13.0 percent to 12.6 percent in hospitals over the 2005–2015 decade. In outpatient care facilities, however, union density fell sharply, from 10.0 to 4.5 percent during the same period. Unions maintained membership in outpatient facilities, but the rapid growth in employment in this health care segment meant a steep decline in density. This fall in union density is a likely contributor to the stagnant wages of non-professional workers, and for the lower wages paid in outpatient care facilities compared to hospitals.

Another factor holding down workers' wages may be an increase in the bargaining power of employers. In consolidated health care markets characterized by one or a few health care systems, employers may have monopoly power in the market for their services and the ability to raise prices. They may also have monopsony power in the labor market and the ability to pay lower wages. The increase in hospital mergers over the 2005–2015 decade may partly explain stagnant or falling real wages in non-professional health care occupations.

Policies that increase competition in health care markets are good for consumers; providers will have to lower prices and increase the quality of care to compete for patients. They are also good for workers; in labor markets in which health care workers have a greater choice of employers, health care organizations will have to pay higher wages to attract and keep workers.

Policies that make it easier for workers to join unions can increase the bargaining power of workers. In the absence of increases in unionization rates, public policy can set a floor under workers' pay and living standards. Reforms such as a $15-dollar-per-hour minimum wage, universal access to health care, free higher education, and affordable quality child care will provide health care workers with greater economic security.


Eileen Appelbaum is Co-Director of the Center for Economic and Policy Research and Coauthor of the CEPR report, Organizational Restructuring in U.S. Healthcare Systems: Implications for Jobs, Wages, and Inequality, that examines the experiences of health care workers over a decade of change from 2005 to 2015.


 -- via my feedly newsfeed

Wednesday, February 14, 2018

A closer look at the fifteen-year drop in black homeownership [feedly]

A closer look at the fifteen-year drop in black homeownership
https://www.urban.org/urban-wire/closer-look-fifteen-year-drop-black-homeownership

Since 2001, the black homeownership rate has seen the most dramatic drop of any racial or ethnic group, declining 5 percent compared with a 1 percent decline for white families and increases for Hispanic and "other" families, which primarily include Asian Americans and Pacific Islanders (AAPIs).

The cohort of black Americans that has lost the most ground relative to other racial and ethnic groups is middle-aged homeowners ages 45 to 64. These homeowners, having lost their homes during the 2008 crisis, find themselves unable to move back into homeownership as they approach retirement age.

Married black households—traditionally the most likely to own homes—lost more ground than single-headed black households. These trends will affect retirement prospects for black Americans and their ability to pass wealth to the next generation.

homeownership rates by race or ethnicity, 2001 to 2016

From 2001 to 2016, white families had higher homeownership rates than other groups. In 2001, black and Hispanic families had similar homeownership rates (46 percent), but by 2016, black families had fallen behind (41 versus 46 percent). The homeownership rate for all groups rose from 2001 to 2006, but it rose less for black families than for other races and ethnicities. And although the homeownership rate fell for all groups from 2006 to 2016, it fell more for black families.

The homeownership rate for black families fell 5 percent. White families experienced a 1 percent drop, and Hispanic and "other" (primarily AAPI) families experienced increases. The 3 percent drop in the overall homeownership rate reflects changes in the composition of the general population.

In fact, black homeownership rates are now at levels similar to those before the passage of the Fair Housing Act in 1968, while rates are up for every other group.

homeownership rate by race or ethnicity, 2001 to 2016

A striking drop in homeownership for middle-aged black household heads

For all races and ethnicities, the homeownership rate rises as the age of the household head increases, peaking between ages 65 and 74 before declining. We divided homeowners into three age groups:

  • Ages 44 and younger = "younger" group
  • Ages 45 to 64 = "middle-aged" group
  • Ages 65 and older = "older" group

In 2016, the overall homeownership rate was 63 percent: 44 percent for the younger group, 72 percent for the middle-aged group, and 78 percent for the older group.

Black, white, and Hispanic families experienced drops in homeownership between 2001 and 2016 for the younger and middle-aged groups, with a more mixed picture for the older group.

But the most striking fact is how poorly middle-aged black households have performed relative to other races and ethnicities. Homeownership for black middle-aged families declined 9 percent, compared with 3 percent for white and Hispanic families.

Married black couples experienced a sharp decline in homeownership

In general, married couples have higher homeownership rates than families headed by single homeowners (whether living alone or with others). In 2016, 78 percent of married households owned homes, compared with 48 percent of households headed by single men and 49 percent headed by single women.

homeownership rate by family structure and race or ethnicity 2001 to 2016

Between 2001 and 2016, however, while black households lagged other races and ethnicities for all family structures, the fall in the homeownership rate for married black households was striking. The homeownership rate for married black households was down 5 percent compared with 3 percent for male- and female-headed single black households.

Married white households fell 1 percent in this period, while the rates for Hispanic and "other" married households increased.

Single black men fell further behind

While the declines in homeownership were similar between single male- and female-headed black households, single white and Hispanic men made larger gains in their homeownership rate than white and Hispanic women. Thus, the drop in the black single male homeownership rate contrasts with that of other races and ethnicities.

What can be done?

Homeownership has historically been the best way to build wealth and remains, for most households, more financially beneficial than renting. Reduced access to this wealth-building tool is a significant problem. Since the financial crisis, qualifying for a mortgage has become difficult for people with anything short of perfect credit, blocking as many as 6.3 million loans between 2009 and 2015 alone.

One of the most important steps to help stabilize and increase the black homeownership rate is to expand credit availability, particularly for Federal Housing Administration lending, which black families turn to for 45 percent of their purchase loans.

In addition, allowing greater use of alternative data in mortgage underwriting decisions, including use of rental payment history, and some utilities would benefit black homebuyers. And we need a more thoughtful approach to recognizing the realities of income variability and a greater focus on consumer education and housing counseling related to building credit and using low– and no–down payment and down payment assistance programs.  

These and other actions to increase credit availability could allow creditworthy black and minority families to obtain a mortgage and access homeownership's wealth-building benefits.


 -- via my feedly newsfeed

Inequality and Recessions [feedly]

Inequality and Recessions
http://ritholtz.com/2018/02/inequality-and-recessions/

Inequality and Recessions

By Gene Amromin , Mariacristina De Nardi , Karl Schulze

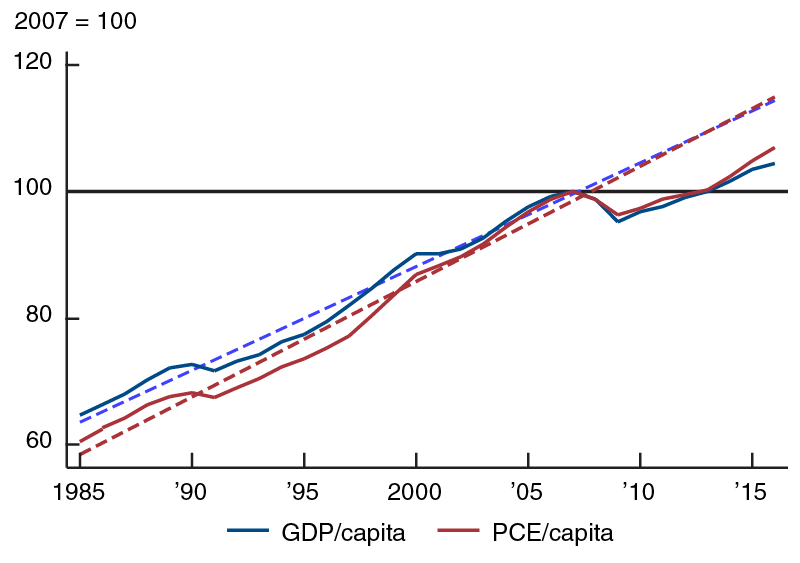
The increase in inequality over the past several decades has received widespread attention from both academics and the public at large. While much of this discourse centers on either the causes or normative implications of increasing inequality, it is important to ask whether the widening gap between the rich and poor has any direct effects on macroeconomic aggregates and, in particular, on the severity of the Great Recession, when output and consumption dropped precipitously and were slow to recover (see figure 1).1

Is it possible that the changing distribution of wealth intensified and lengthened the effects of this downturn? More broadly, should economists and policymakers concerned with macroeconomics be worried about wealth inequality?

1. U.S. real per capita GDP, PCE, and their linear trends, 1985 to 2007

In this article, we first summarize two key papers—one by Krusell and Smith (KS),2 and the other by Krueger, Mitman, and Perri (KMP).3 The major lesson from their work is that economies with a large fraction of low-wealth households, who are borrowing constrained and have a high marginal propensity to consume (MPC), can experience a larger consumption drop in response to a macroeconomic shock than economies where wealth is more evenly distributed and fewer households are borrowing constrained. Next, we turn to the Panel Study of Income Dynamics(PSID) and Credit Bureau Panel Data (Equifax) to examine the interaction between consumption and wealth during the Great Recession, highlighting several dimensions of the data that are likely to tighten the relationship between wealth inequality and the intensity of a downturn. Our recent working paper4 argues that the role of borrowing constraints cannot be adequately captured by only having a large share of households with little wealth before a recession, as is currently the case in most macroeconomic theory (Kaplan and Violante5 are a notable exception).

The first paper, KS, proposes a model of consumption and savings with incomplete capital markets and aggregate uncertainty, where wealth inequality is the cumulative result of different past labor market experiences. To proxy a recession, the authors induce a negative shock to aggregate productivity, which lowers wages and raises unemployment. This paper teaches us that aggregate consumption can depend on the shape of the wealth distribution, even though price and inflation dynamics only depend on average wealth. The intuition for this duality is that low-wealth households make up a sizable fraction of consumption and have the largest MPCs, while contributing the least to aggregate capital and price determination.

The second paper, KMP, extends KS's model to a life-cycle framework and allows for unemployment insurance. Their enriched model endogenously generates much more wealth inequality than the KS baseline economy. The authors compare the dynamics of these two models and find that the KMP version generates a larger drop in consumption in response to a downturn, even after holding the total amount of wealth in the economy fixed. Thus, increasing wealth inequality can increase the severity of a recession.

These two important papers provide convincing evidence that inequality can worsen the negative effects of a recession. However, these models still miss some important aspects of the data that characterized the Great Recession. These features include endogenous changes to wealth due to changes in asset and house prices, the composition of asset holdings, the tightening of credit standards, and the complex earnings dynamics of those who remain employed. Taking into consideration these additional elements can help provide a better picture of who is borrowing constrained and how their consumption changes when they are hit by a shock.

Our goal here is to highlight these trends using the PSID and Equifax data. The PSID is a widely used and nationally representative panel of households that observes their wealth, earnings, and consumption every two years in our data, covering from 2000 to 2012. The Equifax data set is a nationally representative sample of individual borrowers, containing data on all aspects of individual and household-level borrowing and credit. This data set allows us to characterize the experience of households prior to and during the recession.

First, the models we discussed so far do not have the sizable wealth losses due to the changing asset and house values that were observed during the Great Recession. In the data, the wealth distribution shifted sharply leftward between 2006 and 2010, with the share of households holding negative net worth jumping from 16% to 24%. Moreover, the PSID shows us that changes in net worth have consequences for a household's consumption levels. In figure 2, we follow households as they transition across fixed wealth quintiles and find that downward movements in wealth are associated with negative consumption growth rates, shown in bold. For example, 43.8% of households who had net worth values between $37,400 and $133,000 remain in this group in 2010, and they experience a 0.9% per year increase in consumption. However, more than one-third of the households who were in this wealth quintile in 2006 lost enough wealth to drop into lower-wealth groups. For context, the group that transitioned from Q3 to Q1 had an average nominal net worth of $73,900 in 2006 and dropped to a 2010 mean of –$33,100. They also experienced an annualized –2.8% decline in nominal consumption during this period. Similarly, for the Q3 to Q2 group, 22.9% of households dropped from an average wealth level of $73,000 to $20,800 and experienced a –3.3% annualized decline in consumption. Therefore, asset and home values play an important role in a household's consumption and saving decisions.

Second, these models abstract from portfolio choice and the important observation that the composition of household assets changes over the wealth distribution. For example, in the PSID, only 12.7% of families in the lowest wealth quintile in 2006 owned their home, compared with 80.2% in the middle quintile. Similarly, 82.7% of families at the top of the wealth distribution held financial assets, compared with 33.6% in the middle quintile. Thus, the collapse of the housing bubble affected households differently across the wealth distribution. We calculate that 22% of families in the middle of the wealth distribution lost all of their housing wealth, compared with only 6.5% of the top quintile. In contrast, low-wealth households were less affected by housing price declines, since so few owned a home.

2. Transition probabilities and annualized nominal consumption changes (%) across 2006 net worth quintiles, 2006 to 2010

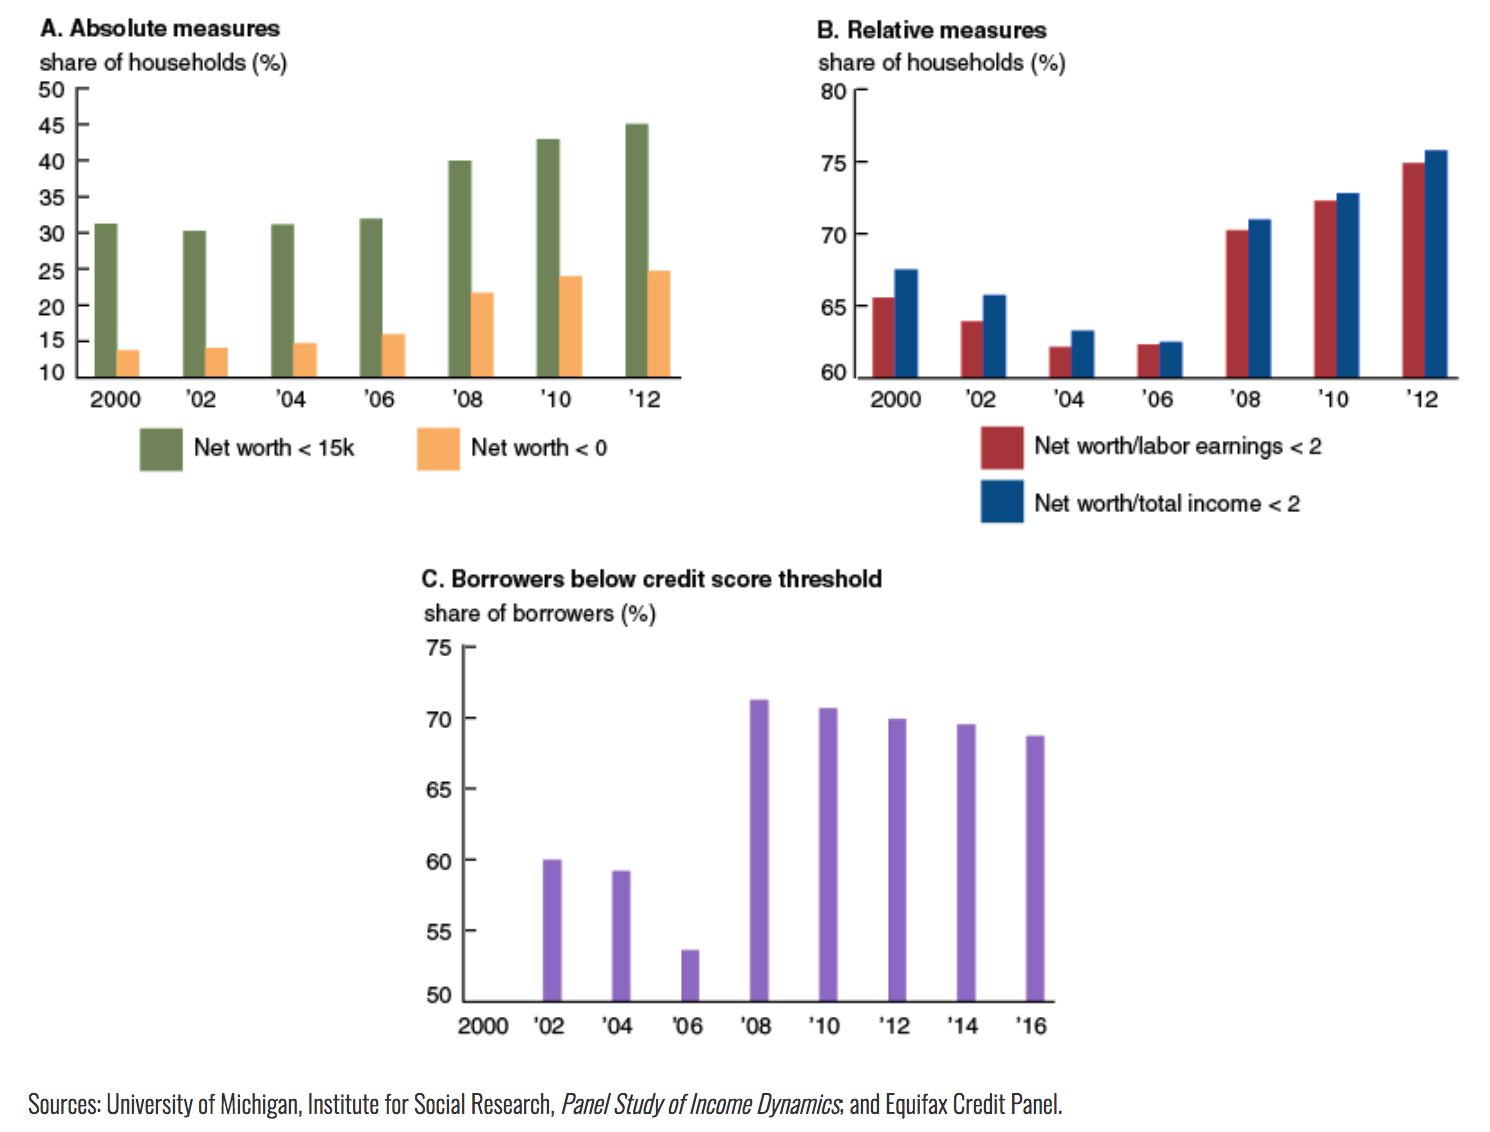
Third, the decline in asset prices and rise in unemployment occurred simultaneously with a tightening of credit standards. Guerrieri and Lorenzoni6 show that this also tends to reduce consumption. With the onset of the recession, not only did many households' credit scores decline, but financial institutions also raised their required credit score thresholds, with the median score of borrowers approved for mortgages backed by Fannie Mae or Freddie Mac increasing from 720 to 780. The result of this tightening was that only super-prime borrowers, i.e., those with credit scores above 779, did not see substantial declines in their success rates of obtaining credit. Importantly, for the various measures we consider in figure 3, this deterioration in the ability of households to borrow appears to not have recovered as of 2012, thus possibly contributing to the slow recovery that we have observed.

Fourth, the models only consider increases in the risk of unemployment during recessions, which tend to affect those at the bottom of the wealth distribution the most. However, in the data, changes in hours worked and earnings for those who remain employed also show substantial declines that play out differently across the wealth distribution. Downward changes in households' earnings expectations can also help explain the slow recovery of consumption after the crisis, amplifying the intensity of the initial downturn. For example, Pistaferri7 shows that declines in consumer confidence and earnings expectations explain the longer-than-normal recovery in expenditures, especially among those at the bottom of the income distribution. De Nardi, French, and Benson8 show that the recession was characterized by both permanent shocks to income and increases in income uncertainty, while Malmendier and Nagel9 use evidence from those who experienced the Great Depression to show that a financial crisis can permanently increase risk aversion among households who live through it.

3. Fraction of constrained households over time

Conclusion

The models of KS and KMP, together with these additional elements present in the data, point to the importance of thinking about borrowing constraints and marginal propensities to consume in richer frameworks in which the constraints are not simply synonymous with holding little in the way of net worth. The models also stress the consequences that unequal access to financial liquidity can have on consumption dynamics during an economic downturn. As we show, various measures of household constraints have permanently increased in the wake of the Great Recession (figure 3), raising the need for caution in thinking about an economy's response to aggregate shocks.


1 An earlier version of this article was published on VoxEU.org and is available online. The views expressed here are not necessarily those of the Federal Reserve Bank of Chicago or Federal Reserve System, National Bureau of Economic Research, Centre for Economic Policy Research, or Institute for Fiscal Studies.

2 Per Krusell and Anthony A. Smith, Jr., 1998, "Income and wealth heterogeneity in the macroeconomy," Journal of Political Economy, Vol. 106, No. 5, October, pp. 867–896.

3 Dirk Krueger, Kurt Mitman, and Fabrizio Perri, 2016, "Macroeconomics and household heterogeneity," in Handbook of Macroeconomics, John B. Taylor and Harald Uhlig (eds.), Vol. 2, Amsterdam: Elsevier B.V. / North-Holland, pp. 843–921.

4 Gene Amromin, Mariacristina De Nardi, and Karl Schulze, 2017, "Household inequality and the consumption response to aggregate real shocks," National Bureau of Economic Research, working paper, No. 24073, November.

5 Greg Kaplan and Giovanni L. Violante, 2014, "A model of the consumption response to fiscal stimulus payments," Econometrica, Vol. 82, No. 4, July, pp. 1199–1239.

6 Veronica Guerrieri and Guido Lorenzoni, 2017, "Credit crises, precautionary savings, and the liquidity trap," Quarterly Journal of Economics, Vol. 132, No. 3, August, pp. 1427–1467.

7 Luigi Pistaferri, 2016, "Why has consumption remained moderate after the Great Recession?," Stanford University, working paper, October.

8 Mariacristina De Nardi, Eric French, and David Benson, 2012, "Consumption and the Great Recession," Economic Perspectives, Federal Reserve Bank of Chicago, Vol. 36, No. 1, pp. 1–16.

9 Ulrike Malmendier and Stefan Nagel, 2011, "Depression babies: Do macroeconomic experiences affect risk taking?," Quarterly Journal of Economics, Vol. 126, No. 1, February, pp. 373–416.

Source: Federal Reserve Bank of Chicago


 -- via my feedly newsfeed

Neoliberalism as lack of self-restraint [feedly]

Neoliberalism as lack of self-restraint
http://stumblingandmumbling.typepad.com/stumbling_and_mumbling/2018/02/neoliberalism-as-lack-of-self-restraint.html

Which do people choose – more money or less? If you think the answer's obvious, you've been too influenced by economism and not enough by science. Sigve Tjotta shows that, in a variety of experiments, a significant minority of people choose the smaller sum over the larger.

This would not have surprised the Adam Smith who wrote the Theory of Moral Sentiments. "To restrain our selfish, and to indulge our benevolent affections, constitutes the perfection of human nature" he wrote (TMS I.I.44). Our sense of propriety, or our desire to look good to others, he thought, reined in greed:

Though it may be true…that every individual, in his own breast, naturally prefers himself to all mankind, yet he dares not look mankind in the face, and avow that he acts according to this principle. He feels that in this preference they can never go along with him, and that how natural soever it may be to him, it must always appear excessive and extravagant to them…In the race for wealth, and honours, and preferments, he may run as hard as he can, and strain every nerve and every muscle, in order to outstrip all his competitors. But if he should justle, or throw down any of them, the indulgence of the spectators is entirely at an end. It is a violation of fair play, which they cannot admit of. (TMS II.II.11)

Which brings me to a theory. One feature of neoliberalism is that restraint in the pursuit of self-interest is now absent. Bosses lack Smith's "impartial spectator" which tells them to hold back, and instead feel no compunction about jostling others. They are content to plunder customers, pensioners, sub-contractors, workers or future workers.

Among her many claims for expenses, Glynis Breakwell, Vice-Chancellor of Bath University, claimed £2 for biscuits. Many of us would not have done so, thinking it too petty-minded to bother. Neoliberals, however, not only are petty-minded but don't mind being seen as such by others.

In this context, critics of mainstream economics have a point. Economics' language of optimization serves to normalize the maximal pursuit of money. What it misses is the potential trade-off which Smith identified, between greed and the good opinion of others. Randian talk of the rich as heroes also plays an important role here, as it functions to counter-act the stigma which greed would otherwise attract.

From this perspective, neoliberal bosses have something in common with child molesters. Both lack restraint in the pursuit of their own self-gratification in situations where they think they can get away with it.

And there's the rub: where they think they can get away with it. My story here is not just about morality. Perhaps there never was a golden era of benevolent paternalistic bosses. What's happened since around the 1970s is that the restraints upon bosses – from law, social norms and trades unions – have diminished. The problem isn't just greed, but power.

VISIT WEBSITE

 -- via my feedly newsfeed

Europe’s Poverty Time Bomb [feedly]

Europe's Poverty Time Bomb
https://www.project-syndicate.org/commentary/europe-poverty-youth-unemployment-by-edoardo-campanella-2018-02


Europe's Poverty Time Bomb

Feb 14, 2018 EDOARDO CAMPANELLAPoverty, especially among the young, has been a growing problem across many European countries since the 2008 financial crisis. And now political leaders in hard-hit countries like Italy are calling attention to the issue in the worst way possible: by promising quick fixes that won't work and would jeopardize government budgets.

MADRID – The poor don't often decide elections in the advanced world, and yet they are being wooed heavily in Italy's current electoral campaign. Former Prime Minister Silvio Berlusconi, the leader of Forza Italia, has proposed a "dignity income," while Beppe Grillo, the comedian and shadow leader of the Five Star Movement, has likewise called for a "citizenship income."

THE YEAR AHEAD 2018

The world's leading thinkers and policymakers examine what's come apart in the past year, and anticipate what will define the year ahead.

ORDER NOW

Both of these proposals – which would entail generous monthly payments to the disadvantaged – are questionable in terms of their design. But they do at least shed light on the rapidly worsening problem of widespread poverty across Europe.

Poverty represents an extreme form of income polarization, but it is not the same thing as inequality. Even in a deeply unequal society, those who have less do not necessarily lack the means to live a decent and fulfilling life. But those who live in poverty do, because they suffer from complete social exclusion, if not outright homelessness. Even in advanced economies, the poor often lack access to the financial system, struggle to pay for food or utilities, and die prematurely.

Of course, not all of the poor live so miserably. But many do, and in Italy their electoral weight has become undeniable. Almost five million Italians, or roughly 8% of the population, struggle to afford basic goods and services. And in just a decade, this cohort has almost tripled in size, becoming particularly concentrated in the country's south. At the same time, another 6% live in relative poverty, meaning they do not have enough disposable income to benefit from the country's average standard of living.

The situation is equally worrisome at a continental level. In the European Union in 2016, 117.5 million people, or roughly one-fourth of the population, were at risk of falling into poverty or a state of social exclusion. Since 2008, Italy, Spain, and Greece have added almost six million people to that total, while in France and Germany the proportion of the population that is poor has remained stable, at around 20%.

In the aftermath of the 2008 financial crisis, the probability of falling into poverty increased overall, but particularly for the young, owing to cuts in non-pension social benefits and a tendency in European labor markets to preserve insiders' jobs. From 2007 to 2015, the proportion of Europeans aged 18-29 at risk of falling into poverty increased from 19% to 24%; for those 65 and older, it fell from 19% to 14%. The share of young people now experiencing severe material deprivation, at 12% of the total population, is almost twice that of the elderly. As Christine Lagarde, the International Monetary Fund's managing director, noted at the World Economic Forum's meeting in Davos this year, young Europeans "are putting their dreams on hold."

Next

Although the current economic upswing could partly reverse the trend in youth poverty, the structural factors underlying the problem will remain. Workers' skills can deteriorate irreparably during stints of long-term unemployment, or can suddenly be rendered obsolete by rapid advances in technology. For many poor people, re-joining the workforce will either be impossible, or it will require them to settle for precarious, low-paid jobs that leave them vulnerable to the next downturn. According to the OECD, 14% of the working-age population in Spain and Greece in recent years was employed but still in poverty.

In unequal societies, resources can be redistributed from the very rich to the rest through progressive taxation, monetary transfers, and salary caps. But eliminating poverty requires more than merely reapportioning the economic pie. The poor also must be re-empowered and reintegrated into societies that have pushed them to the margins. Ultimately, it is not just a matter of political stability and economic fairness, but of human dignity.

Looking ahead, Europe's welfare states will need to be reformed to address current realities. The elderly are no longer the most economically vulnerable members of European society, but they still receive the largest slice of the pie. Governments should reduce pension benefits in favor of the poor, the unemployed, and the young. These three groups, which often overlap, are in desperate need of financial assistance, skills training, and family-friendly policies.

European governments should also overhaul their tax systems to make older workers contribute more, offer fiscal incentives to companies that hire disadvantaged workers, and move toward establishing an EU-wide poverty-insurance scheme. And entrepreneurs and private firms should invest more in social programs in the communities where they are active.

While Berlusconi (who is barred from running for office) and Grillo have homed in on the problem of poverty, their proposed solutions are nothing more than short-term fixes. A basic-income scheme might provide some immediate financial relief to the poor, but it would not address the structural causes of poverty. Even worse, because neither proposal seriously encourages the unemployed to seek work or training programs, the poor could end up reliant on state assistance forever. And it is not as if such policies would be budget-neutral. Rather, they would have to be funded by politically unpopular tax increases or spending cuts.

Still, as Berlusconi and Grillo have made clear, Europe's leaders can no longer afford to ignore the poverty problem. They will have to offer real solutions, not simplistic schemes. As oblivious elites often learn the hard way, the poor will endure their lot only for so long.

EDOARDO CAMPANELLA

Writing for PS since 2010
13 Commentaries

Edoardo Campanella is a Future of the World Fellow at the Center for the Governance of Change of IE University in Madrid.


 -- via my feedly newsfeed

Piketty -- Education: we could do better


Parcoursup: could do better


Thomas Pikety


All societies need a grand narrative to justify their inequalities. In contemporary societies, the focus is on the meritocratic narrative. Modern inequality is just because it is the outcome of a process which is freely chosen in which each individual has the same opportunities. The problem is that there is a yawning gap between the official meritocratic declarations and the reality.

In the United States, the chances of acceding to higher education are almost entirely determined by the income of one's parents; barely 20% for the poorest 10%, and over 90% for the richest 10%. We should moreover make it clear that we are in no way talking of the same higher education in the two cases. Possibly, the situation is not quite as extreme in France. But the truth is that we do not really know because it is impossible to access the same data.

In this type of context, the reform of the student university entry admission system with the move from the APB (or 'admission post baccalauréat') to the 'Parcoursup' plaform is potentially very promising. Unfortunately, it is to be feared that all this will only reinforce the inequality and opacity of the system.

It should be said at the outset that taking into account the marks, the tracks and the student records in the university entrance admission procedure (the main innovation in Parcoursup) is not necessarily a bad thing as such. Given that marks have always been taken into consideration for admission to the preparatory classes for the grandes écoles (both in the former APB system and in the new Parcoursup), which nobody seems to quarrel with, it is not clear why they should not play a role in university admission. True, the marks are not always just and the marking system needs to be re-thought. But they do nevertheless contain some useful information, a priori rather more than the random drawing of lots used to date (hopefully).

To address the obvious risk of a drift towards inequality and the academic hyper-stratification of such a system two conditions must however be fulfilled. In the first instance, the means invested must enable each student with a baccalaureat to have access to quality education. This is all the more urgent as the French system is characterised by a particularly extreme and hypocritical form of dualism: on the one hand we have selective sectors which are richly endowed (the preparatory classes and the grandes écoles) and on the other, universities which have been neglected and in which massive investment is required. Unfortunately the government has chosen to prolong the decline in public investment observed since 2008, and to devote all the available resources to reducing the taxes of the better off. One should keep in mind that budget per student has fallen by 10% in ten years and the 5 billion Euros in tax gifts to the richest would have enabled a 40% increase in the per capita expenditure.

Over and above the question of the means, taking marks into account must imperatively be moderated by other criteria; this poses basic questions which to date have not been resolved. The law, adopted at its first reading in the National Assembly, stipulates that in each higher-education track (both the universities and in the preparatory classes) there must be a minimal percentage of low-income students. In other words, for the same marks, a state-aided holder of the baccalaureat (élèves boursiers, i.e. roughly 20% of secondary school students) could be accepted while another whose parental income is slightly higher than threshold level will be refused. The idea is not necessarily bad in itself, though it would undoubtedly have been preferable to limit the threshold effect by using a points system taking account in a more continuous and gradual fashion of family origin (as is the case in some of the Indian universities).

In any event, the problem is that the way in which this potentially explosive system will be set up in Parcoursup remains totally obscure. The law states that the percentage of low-income student per academic track will be fixed 'by the academic authorities' (therefore, the rector) by taking into consideration "the relation between the number of state-aided students and the total number of candidates" but also "in conjunction and negociation with the heads of the establishments concerned", with no further details. It has been announced on countless occasions that the source code of Parcoursup will be made available to the public in its entirety (as, moreover, the previous government had announced) but no date has been fixed. Secondary school students have until 13 March to choose their preferred tracks. Will the rules of the game be made public before this date, or afterwards? Nobody knows.

The law also stipulates that the "best pupils in each stream in each school will have priority access to all the courses" (in particular the preparatory classes for the grandes écoles). But there again, we have no further information: "the percentage of secondary school students who will have the right to benefit from this priority access will be fixed by decree". In reality, this is simply a reworking of an article adopted in 2013 which in practice was applied in a totally opaque and purely symbolic manner at the very end of the allocation process, in the context of the final last chances provided for in the system (therefore much too late for the secondary pupils concerned to genuinely benefit from them). Has any consideration been given to revealing the source code intended for the application of this article to secondary school pupils in the Parcoursup procedure, and if so at what date? It's something of a mystery.

Let's be clear: these are complex questions which no country has resolved in a totally satisfactory manner. But once the government states a policy of transparency it cannot afford to maintain such an opaque process, all this plus inequality and austerity in addition for the less well off.

(the figure at the beginning of this article is taken from the works of Raj Chetty, Emmanuel Saez and their co-authors: see The Equality of Opportunity Project)


--
John Case
Harpers Ferry, WV

The Winners and Losers Radio Show
7-9 AM Weekdays, The Enlighten Radio Player Stream, 
Sign UP HERE to get the Weekly Program Notes.

Paul Krugman: Trump Doesn’t Give a Dam [feedly]

Paul Krugman: Trump Doesn't Give a Dam
http://economistsview.typepad.com/economistsview/2018/02/paul-krugman-trump-doesnt-give-a-dam.html

"Trump's offer on infrastructure is this: nothing":

Trump Doesn't Give a Dam, by Paul Krugman, NY Times: Donald Trump doesn't give a dam. Or a bridge. Or a road. Or a sewer system. Or any of the other things we talk about when we talk about infrastructure.
But how can that be when he just announced a $1.5 trillion infrastructure plan? That's easy: It's not a plan, it's a scam. The $1.5 trillion number is just made up; he's only proposing federal spending of $200 billion, which is somehow supposed to magically induce a vastly bigger overall increase in infrastructure investment, mainly paid for either by state and local governments (which are not exactly rolling in cash, but whatever) or by the private sector.
And even the $200 billion is essentially fraudulent: The budget proposal announced the same day doesn't just impose savage cuts on the poor, it includes sharp cuts for the Department of Transportation, the Department of Energy and other agencies that would be crucially involved in any real infrastructure plan. Realistically, Trump's offer on infrastructure is this: nothing.
That's not to say that the plan is completely vacuous. One section says that it would "authorize federal divestiture of assets that would be better managed by state, local or private entities." Translation: We're going to privatize whatever we can. It's conceivable that this would be done only in cases where the private sector really would do better, and contracts would be handed out fairly, without a hint of cronyism. And if you believe that, I have a degree from Trump University you might want to buy. ...
So why isn't Trump proposing something real? Why this dog's breakfast of a proposal that everyone knows won't go anywhere?
Part of the answer is that in practice Trump always defers to Republican orthodoxy, and the modern G.O.P. hates any program that might show people that government can work and help people.
But I also suspect that Trump is afraid to try anything substantive. To do public investment successfully, you need leadership and advice from experts. And this administration doesn't do expertise, in any field. Not only do experts have a nasty habit of telling you things you don't want to hear, their loyalty is suspect: You never know when their professional ethics might kick in.
So the Trump administration probably couldn't put together a real infrastructure plan even if it wanted to. And that's why it didn't.
VISIT WEBSITE

 -- via my feedly newsfeed