Tuesday, September 28, 2021

Abolish the debt ceiling before it commits austerity again: The GOP used the debt ceiling to force spending cuts in 2011. It can’t be allowed again. [feedly]

Abolish the debt ceiling before it commits austerity again: The GOP used the debt ceiling to force spending cuts in 2011. It can't be allowed again.
https://www.epi.org/blog/abolish-the-debt-ceiling-before-it-commits-austerity-again-the-gop-used-the-debt-ceiling-to-force-spending-cuts-in-2011-it-cant-be-allowed-again/

In a political system beset by many stupid and destructive institutions, the statutory limit on federal debt might be the worst. The debt limit:

  • Measures no coherent economic value. The measure of debt it targets is not inflation-adjusted, would perversely make the debt situation look worse if there was a reform to Social Security that closed that program's long-run actuarial imbalance, and ignores trillions of dollars in assets held by the federal government.
  • Has no relationship to any economic stressor facing the country—over the past 25 years, as the nominal federal debt rose from $5 trillion to $22.7 trillion, debt service payments (required interest payments on debt) shrank almost in half, from 3.0% of GDP to 1.8%.
  • Can cause real damage if it's not lifted in the next couple of weeks. It would only take a couple of months of missing federal payments due to the debt ceiling to mechanically send the economy into recession—and that's without assessing damage it would cause from financial market fallouts.
  • Has been used time and time again to enforce misguided austerity policies. The 2011 Budget Control Act (BCA) grew directly out of a GOP Congress threatening to not raise the debt ceiling absent spending cuts. The BCA provided an anti-stimulus about twice as large as the stimulus provided by the American Recovery and Reinvestment Act (ARRA—commonly known as "The Recovery Act") and is largely responsible for the sluggish recovery from the Great Recession.

Given all of this, the debt ceiling should be abolished or neutralized in absolutely any way politically possible. It serves no good economic purpose and plenty of malign ones. Below we expand on these points.

Overview of the debt ceiling

The U.S. Treasury draws on banking accounts at the Federal Reserve to fund federal governmental activities—remitting paychecks to federal government employees, sending Social Security checks, reimbursing doctors for treating Medicare-covered patients, paying defense contractors and interest to bondholders and so on. These accounts are fed on an ongoing basis by both tax revenues and the proceeds from selling bonds (debt). But, because the United States has a statutorily imposed limit of how much outstanding debt is allowed, once this limit is reached on issuing new debt, Treasury can no longer sell bonds and deposit these proceeds, and hence accounts at the Federal Reserve will dwindle as they are only now fed by ongoing taxes, which are insufficient to cover all spending. This limit is being rapidly reached and by mid-October (current guesstimate) the Treasury accounts will be too small to finance that day's governmental activities.

The debt ceiling measures no coherent economic indicator

The statutory debt ceiling is a completely arbitrary value—there has never been any economic justification for any of its historical values and it is raised (or suspended periodically) purely based on congressional whim. It is not indexed for inflation, even as federal government payments (like Social Security checks) are so indexed.

Further, it measures gross debt, which includes debt the federal government owes itself. The biggest difference between the debt held by public and gross debt is the Social Security Trust Fund (SSTF). To help pre-fund the now-arrived retirement of the Baby Boomer generation, for years the Social Security system taxed current workers more than what was needed to pay current beneficiaries. The surplus was credited to the SSTF. As dedicated Social Security revenues fall a bit short of benefits in coming decades, the system (as designed) will draw down the SSTF.

But this means that in those years that saw the SSTF rise, this actually inflated measures of gross debt. And it means, for example, that proposals to narrow the long-run actuarial shortfall of the Social Security system would actually see us hit the federal debt limit sooner. How can that make sense?

Finally, the gross debt also excludes the roughly $2 trillion in financial assets (mostly student loans) held by the federal government. Any measure that aims to measure the balance sheet health of an entity probably shouldn't ignore trillions of dollars in assets.

The debt ceiling has no relationship to genuine economic stressors

Higher interest payments that put stress on the federal government's ability to pay and raise the cost of capital for private businesses is the entire economic reason to keep an eye on public debt. But interest rates have collapsed as debt has risen. In 1996, gross federal debt stood at $5.2 trillion. By 2019, it was at $22.7 trillion. Yet in 1996, debt service paymentsthe interest costs needed to be paid on outstanding debt—were 3.0% of GDP, but by 2019 they were just 1.8%. The reason why interest rates have collapsed while debt has grown is simply that both variables have been driven by pronounced economic weakness over most of the post-2000 period. But the larger point is that the level of gross federal debt has no reliable relationship to any economic stressor faced by governments or households, so hinging something as high stakes as a hard limit on the federal governments' legal ability to borrow on this measure makes no sense.

The debt ceiling will cause a recession if it's allowed to bind spending in coming months

Currently, the Congressional Budget Office (CBO) forecasts a budget deficit of just under 12% of GDP for 2021. The Bureau of Economic Analysis (BEA) indicates much of this was front-loaded—federal government borrowing averaged 16% of GDP for the first six months of the year. For the rest of the year, assume borrowing averaged about 8% of GDP. This is the gap between tax revenues and spending, so if no more borrowing is allowed due to the debt ceiling, it is de facto a measure of how much spending would have to be cut. A spending cut of 8% of GDP is a mammoth shock, and to have it slam into the economy in an instant would be spectacularly damaging.

For comparison, the much-touted private-sector "deleveraging" (an abrupt swing from borrowing to saving) that led to the Great Recession in 2008-09 was about a 9% contraction in spending as a share of GDP—but that was spread over more than two years. This means that the mechanical shutdown of spending caused by hitting the debt ceiling would be sharper and larger than the one that led to the Great Recession. Worse, as the negative fiscal shock ripples through the private economy, the austerity becomes self-reinforcing. Say that in the first month, the 8% of GDP cutback in federal spending has a multiplier of 1.5, so economic activity in that month is slowed by 12% of that month's GDP in total. (While it's true that multiplier effects may well not happen right away, illustratively this is the dynamic we're facing.)

With GDP and incomes 12% lower, tax collections will fall by roughly 4% of GDP. So the next month, not only the original cutback in spending will be needed, but the new and lower tax collections will ratchet down spending even more—and pretty quickly! Normally the federal budget acts as an automatic stabilizer when recessions hit—taxes fall and spending rises and debt increases, all of which spurs economic activity. But a recession caused by an arbitrary legal rule that spending cannot exceed (falling) taxes means that the budget would actually act as an automatic destabilizer.

If the spending cutbacks occur for a month, say, and then federal transfers make up for the lost month, then lots of the damage could be undone pretty quickly. But not all of it. The multiplier effects—the consumption foregone because, say, the workers at diners serving the retirees who didn't go out to eat for a month because their Social Security checks didn't come—will not be made up by subsequent government payments.

Finally, all of this is just a description of the strictly "mechanical" effects of hitting the debt ceiling. The ripple effects stemming from distress in financial markets that would be sparked by missing interest payments on Treasury bonds and bills could be extreme as well. But these mechanical effects are useful to keep in mind when some misleadingly claim that the Treasury can "prioritize" payments to bondholders and hence the US can avoid technical "default." Besides being likely impossible for both logistical and legal reasons, prioritizing interest payments to bondholders just means defaulting even more heavily on Social Security beneficiaries, doctors' reimbursements for seeing Medicare and Medicaid patients, federal contractors' bills, and all other federal payments. And "prioritizing" some payments over others doesn't change the grim mechanical arithmetic run through above.

The debt ceiling is an austerity trump card

People often invoke the damage done by the 2011 showdown over the debt ceiling. They point to stock market losses, increases in "economic uncertainty" indices, and estimates of how much higher interest rates went in the showdown's aftermath. But, they tend to miss what was by far the greatest damage done by the 2011 debt ceiling episode: the passage of the Budget Control Act (BCA), a relatively unknown piece of legislation to the lay public, but one which delivered an anti-stimulus to the U.S. economy about two times as powerful as the stimulus provided by the Obama administration's Recovery Act in 2009.

The BCA's caps on federal spending explain a large part of why this spending in the aftermath of the Great Recession was the slowest in history following any recession (or at least since the Great Depression). This federal spending austerity fully explains why the recovery from the Great Recession was so agonizingly slow. If this spending had instead followed the normal post-recession path, then a return to pre-recession unemployment rates would've happened 5-6 years before it finally did in 2017.

The BCA was the GOP demand for raising the debt limit in 2011, and the Obama administration acquiesced to it. The leverage provided by the debt limit led directly to the worst recovery following a recession since World War II. If the debt ceiling manages to fatally wound prospects for the budget reconciliation bill wending its way through Congress now, we'll see history repeat itself, with fiscal policy turning sharply contractionary in mid-2022 as the boost from the American Rescue Plan (passed earlier this year) begins quickly running out. This leverage the debt ceiling provides to those looking to enforce austerity is its greatest—and often most-overlooked—danger.

The debt ceiling needs to be abolished—either formally or effectively

Given all of this, it is obvious that the U.S. should join the vast majority of rich countries around the world who don't have a debt ceiling. It would be most straightforward if Congress would abolish it straightaway. Alternatively, if a large-enough group of members of Congress demand that the reconciliation bill raise the debt ceiling to some laughably large number ($100 trillion? $500 trillion?), this would effectively abolish it (for arcane procedural reasons I don't understand, under the rules of budget reconciliation the only change that can be made to the debt ceiling is to raise it).

If Congress won't act sensibly, the Biden administration should act unilaterally. There is plenty of support for citing the fact that Congress has given the executive branch conflicting instructions, and, hence the administration is free to choose which path it follows. Congress's taxing and spending instructions require the administration to issue debt to cover the shortfall, yet the debt ceiling would bar debt issuance. One of these congressional "decisions" must be ignored, so, the administration should decide. A more-fun solution—one that highlights the stupidity of the debt ceiling—is minting the trillion-dollar platinum coin. I'm a fan, mostly because of the educational value of it, and because it treats the debt ceiling as a problem with the contempt it deserves.

However it is done, it is imperative to not just squeak through this latest crisis. Either Congress or the Biden administration needs to do future policymakers a huge favor and render the debt ceiling moot forevermore. It's already done enough damage.


 -- via my feedly newsfeed

Pandemic economic woes continue, but so do deep structural problems, especially the long-term growth in the share of low wage jobs [feedly]

A provocative and sober take on the future of work in the high tech world. I take a somewhat more optimistic view if policy moves along a socialist road -- but that's a vortex away, as Wm Blake wrote. 

Pandemic economic woes continue, but so do deep structural problems, especially the long-term growth in the share of low wage jobs
https://economicfront.wordpress.com/2021/09/20/pandemic-economic-woes-continue-but-so-do-deep-structural-problems-especially-the-long-term-growth-in-the-share-of-low-wage-jobs/

Many are understandably alarmed about what the September 4th termination of several special federal pandemic unemployment insurance programs will mean for millions of workers.  Twenty-five states ended their programs months earlier, with government and business leaders claiming that their termination would spur employment and economic activity.  However, several studies have disproved their claims.

One study, based on the experience of 19 of these states, found that for every 8 workers that lost benefits, only one found a new job.  Consumer spending in those states fell by $2 billion, with every lost $1 of benefits leading to a fall in spending of 52 cents.   It is hard to see how anything good can come from the federal government's willingness to allow these programs to expire nationwide. 

The Biden administration appears to believe that adoption of its physical infrastructure bill and $3.5 trillion spending plan will ensure that those left without benefits will find new jobs.  But chances for Congressional approval are growing dim.  Even more importantly, and largely overlooked in the debate over whether the time is right to replace the pandemic unemployment insurance programs with new spending measures, is that an increasing share of the jobs created by economic growth are low-wage, and thus inadequate to ensure workers and their families an acceptable standard of living. 

For example, according to another study, the share of low wage jobs has been steadily growing since 1979.  More specifically, the share of workers (18-64 years of age) with a low wage job rose from 39.1 percent in 1979 to 45.2 percent in 2017.  For workers 18 to 34 without a college degree the share soared from 46.9 percent to 61.6 percent over the same tyears. Thus, a meaningful improvement in worker well-being will require far more than a return to "normal" labor market conditions.  It will require building a movement able to directly challenge and transformation the way the US economy operates.  

The importance of government programs

The figure below provides some sense of how important government programs have been to working people.  Government support was truly a lifeline for working people, delivering a significant boost to total monthly personal income (relative to the February 2020 start of the pandemic-triggered recession), especially during the first months.  Even now, despite the fact that the recession has officially been declared over, it still accounts for approximately half the increase in total monthly income.   

The government's support of personal income was anchored by three special unemployment insurance programs–the Federal Pandemic Unemployment Compensation (FPUC), Pandemic Emergency Unemployment Compensation (PEUC), and Pandemic Unemployment Assistance (PUA). 

The FPUC was authorized by the March 2020 CARES Act and renewed by subsequent legislation and a presidential order. It originally provided $600 per week in extra unemployment benefits to unemployed workers in states that opted in to the program. In August 2020, the extra payment was lowered to $300.

The PEUC was also established by the CARES Act. It provided up to 13 weeks of extended unemployment compensation to individuals that had exhausted their regular unemployment insurance compensation.  This was later extended to 24 additional weeks and then by a further 29 weeks, allowing for a total of 53 weeks.  The PUA allowed states to provide unemployment assistance to the self-employed and those seeking part-time employment, or who otherwise did not qualify for regular unemployment compensation.

Tragically, the federal government allowed all three programs to expire on September 4th. Months earlier, in June 2021, 25 states actually ended these programs for their unemployed workers, eliminating benefits for over 2 million.  Several studies, as we see next, have documented the devastating cost of that decision. 

The cost of state program termination

Beginning in April 2021, a number of business analysts and politicians began to aggressively argue that federally provided unemployment benefit programs were no longer needed.  In fact, according to them, the programs were actually keeping workers from pursuing available jobs, thereby holding back the country's economic recovery. Using these arguments as cover, in June, 25 states ended their participation in one or more of these programs. 

For example, Henry McMaster, the governor of South Carolina, announced his decision to end his state's participation in the federal programs, saying: "This labor shortage is being created in large part by the supplemental unemployment payments that the federal government provides claimants on top of their state unemployment benefits."

Similarly, Tate Reeves, the governor of Mississippi, stated in a May 2021 tweet:

It has become clear to me that we cannot have a full economic recovery until we get the thousands of available jobs in our state filled. . . . Therefore, I have informed the Department of Employment Security to direct the Biden Administration that Mississippi will be opting out of the additional federal unemployment benefits as early as federal law allows—June 12, 2021.

The argument that these special federal unemployment benefit programs hurt employment and economic activity was tested and found wanting.  Business Insider highlights the results of several studies:

Economist Peter Ganong, who co-authored a paper that found the disincentive effect of benefits was small, told the [Wall Street] Journal: "If the question is, 'Is UI [unemployment insurance] the key thing that's holding back the labor market recovery?' The answer is no, definitely not, based on the available data." 

That aligns with other early research on the impact of benefits ending. CNBC reports that analyses from payroll firms UKG and Homebase both found that employment didn't go up in the states cutting off the benefits; in fact, that Homebase analysis found that employment declined in the states opting out of federal benefits, while it went up in states that chose to retain benefits. In June, Indeed's Hiring Lab found that job searches in states ending benefits were below April's baseline.

In July, Arindrajit Dube, an economics professor at University of Massachusetts Amherst, found that ending benefits didn't make workers rush back. "Even as there was a clear reduction in the number of people who were receiving unemployment benefits — and a clear increase in the number of people who said that they were having difficulty paying their bills — that didn't seem to translate, at least in the short run, into an uptick in overall employment rates," Dube told Insider at the time.

Dube, along with five other researchers, examined "the effect of withdrawing pandemic UI on the financial and employment trajectories of unemployed workers in [19] states that withdrew benefits, compared to workers with the same unemployment duration in states that retained these benefits." 

They found, as noted above, that for every 8 workers who lost their benefits, only 1 found a new job.  And for every $1 of reduced benefits, spending fell by 52 cents—only 7 cents of new income was generated for each dollar of lost benefits. "Extrapolating to all UI recipients in the early withdrawal states, we estimate these states eliminated $4 billion in unemployment benefits paid by federal transfers as of August 6 [2021].  Spending fell by $2 billion and earnings rose by $270 million.  These states therefore saw a much larger drop in federal transfers than gains from job creation."

An additional 8 million workers have now lost benefits because of the federal termination of these special unemployment insurance programs.  It is hard to be optimistic about what awaits them, given the experience of the early termination states.  And equally important, even if the "optimists" are proven right, and those workers are able to find employment, there is still reason for concern about the likely quality of those jobs given long-term employment trends.

The lack of decent jobs

There is no agreed upon definition of a low wage job.  David R. Howell and Arne L. Kalleberg note two of the most popular in their study of declining job quality in the United States.  One is to define low wage jobs as those that pay less than two-thirds of the median hourly wage.  The other, used by the OECD, is to define low wage jobs as those that pay less than two-thirds of the median hourly wage for full-time workers.

Howell and Kallenberg find both inadequate.  Instead, they define low wage jobs as those that pay less than two-thirds of the mean hourly wage for full-time prime-age workers (35-59).  Their definition sets the dividing line between low wage and what they call "decent" wage jobs at $17.50 in 2017.  As they explain:

This wage is well above the wage that would make a full-time (or near full-time) worker eligible for food stamps and several dollars above the basic needs budget for a single adult in most American cities, but is conservative in that the basic needs budget for a single adult with one child ranges from $22 to $30).

The figure below, based on their definition, shows the growth in low wage jobs for workers 18-34 years of age without a college degree (in blue), all workers 18-64 years of age (in gold), and prime age workers 35-59 years of age (in green).  Their dividing line between low wage and decent wage jobs, equivalent to $17.50 in 2017, is far from a generous wage.  Yet, all three groupings show an upward trend in the share of low wage jobs.  

The authors then divide their low wage and decent wage categories into upper and lower tiers.   The lower tier of the low wage category includes jobs that pay less than two-thirds of the median wage for full-time workers, which equaled $13.33 in 2017.  As the authors report:

Based on evidence from basic needs budgets, this is a wage that, even on a full-time basis, would make it extremely difficult to support a minimally adequate standard of living for even a single adult anywhere in the country. This wage threshold ($13.33) is just above the wage cutoff for food stamps ($12.40) and Medicaid ($12.80) for a full- time worker (thirty-five hours per week, fifty weeks per year) with a child; full-year work at thirty hours per week would make a family of two eligible for the food stamps with a wage as high as $14.46 and as high as $14.94 for Medicaid.  For this reason, we refer to this as the poverty-wage threshold.

The lower tier of the decent wage category includes jobs that pay less than 50 percent more than the decent-job threshold, which equaled $26.50 in 2017.  The figure below shows the overall job distribution in 2017.

The following table shows the changing distribution of jobs over the years 1979 to 2017 for all workers 18 to 64, for workers 18-34 without a college degree, and for workers 18-34 with a college degree.

While the share of upper-tier decent jobs held by workers 18 to 64 has remained relatively stable, there has been a notable decline in the share of workers with lower-tier decent jobs.  Also worth noting is the rise in the share of poverty-level low wage jobs. 

Perhaps most striking is the large decline in the share of decent jobs held by workers 18 to 34, those with and those without a college degree.  The share of poverty level jobs held by those without a college degree soared from 35.7 percent to 53.5 percent.  The share of low wage jobs also spiked for those with a college degree, rising from 22 percent to 39.1 percent, with an increase in the share of both low-wage tiers.

This long-term decline in job quality will not reverse on its own.  And, not surprisingly, corporate leaders remain largely opposed to policies that might threaten the status quo.

So, do we need a better unemployment insurance system? For sure.  Do we need a better funded and more climate resilient social and physical infrastructure?  Definitely.  But we also need a dramatically different economy, one that, in sharp contrast to our current system, is grounded in greater worker control over both the organization and aims of production.  Lots of work ahead.


 -- via my feedly newsfeed
Monday, September 27, 2021

Mike Roberts: Canada: no change [feedly]

Mike Roberts does an excellent drill down on the Canadian economy.

Canada: no change
https://thenextrecession.wordpress.com/2021/09/21/canada-no-change/

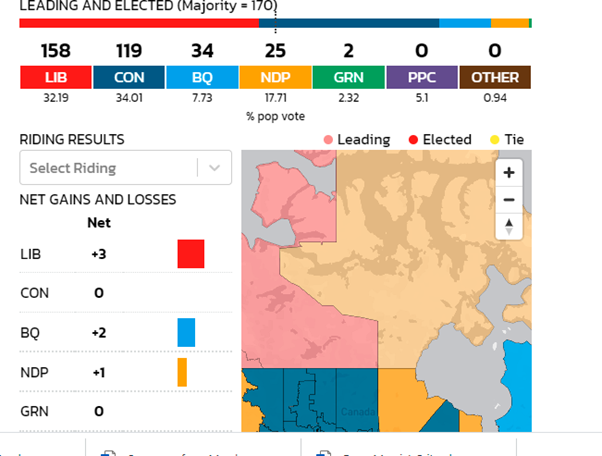
Canada's Liberal Party prime minister Justin Trudeau has managed to get re-elected for the third time in the snap general election he called.  The Liberals won or were leading in 158 seats out of a total of 338 seats, and the Conservatives trailed the Liberals, winning or leading in 122 seats, four more than their 2019 result.  But Trudeau will fall short of an outright majority in parliament and will need the support of the left-leaning New Democrats to get any legislation through (as before). 

Indeed, the result is more or less the same as in the last election two years ago.  Trudeau's plan to get a majority based on the 'success' of the government's handling of the COVID crisis backfired.  Many voters considered the election as a cynical move and a waste of time.  Indeed, it was the Conservatives who got the biggest vote (as in 2019) attracting 34 per cent support to the Liberals' 32 per cent, but Liberal support is centred around urban and suburban areas where there are more seats.  And Canada has a first past the post system as in the UK.

Voter turnout has been slipping in the 21st century from a peak of 75%; in this election it was around 65% – much higher than the US, about the same as the UK but below other G7 economies Germany and Japan. A 65% turnout means that the 'no vote' party was the largest – and Trudeau's Liberals attracted just one in five potential voters.

Canada: voter turnout (%)

As the smallest G7 nation in GDP and population, Canada has seen far fewer COVID cases and deaths than many other nations, and Trudeau recently reopened the border, but only to the vaccinated.  In the election Trudeau pointed out the dire situation in Alberta, run by a Conservative provincial government, which refused to adopt social distancing restrictions and now has a wave of cases and hospitalisations.  Interestingly, the anti-vacc extreme right-wing People's Party failed to make a mark, polling only 5%.

Trudeau may be back in office, but like the other G7 economies, things are not rosy economically.  Canada's 2021 economic outlook is similar to that of other developed countries. After the largest economic contraction since 1945 (a dip of 5.5% of GDP in 2020), Canada is still in recession, according to the latest figures, although forecasters (Oxford Economics) are still expecting a sharp recovery.

Even if the above forecast turns out to be correct (and that is uncertain), the long-term economic trends for the Canadian economy are not great.  A recent Macdonald-Laurier Institute report, wrote that Canadian "real GDP growth over the past decade has been as lethargic as the decade after the onset of the Great Depression in 1929" (Cross 2020). Thus, Canadian capitalism had already been experiencing problems for over a decade when the COVID-19 lockdown started. 

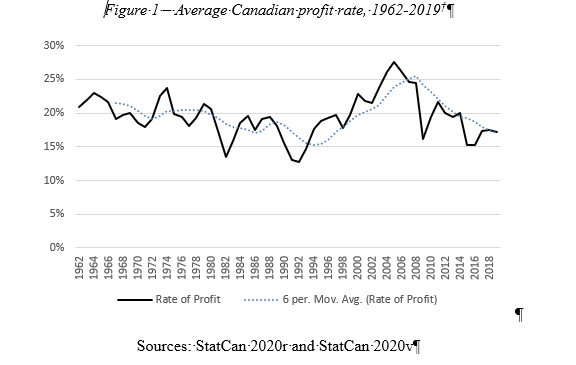
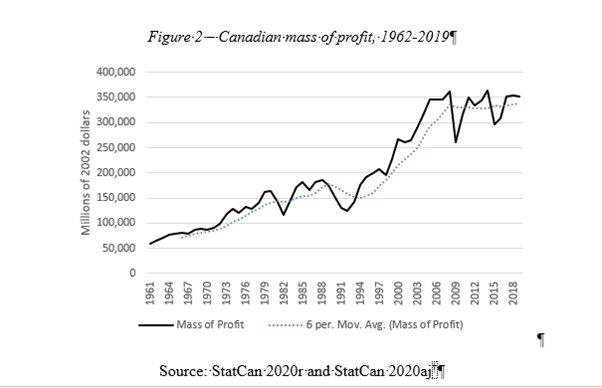
For an account of Canadian capitalism up to the 1990s, I recommend the work of Marxist economist, Murray Smith . For the recent period, Geoff McCormack of the Centre for Canadian Studies at Guangdong University for Foreign Studies has produced an excellent analysis of Canadian capitalism, which I draw upon here.  McCormack finds that in the 13-year period following the 'Great Canadian Slump' of 1990-92, the profit rate on Canadian capital rose from 13% to 28%. But after peaking in 2005, it began to fall, reaching 17% in 2019.

The downward trajectory of the profit rate during this 14-year period was accompanied by a stagnating mass of profit. Between the years 1993 and 2005, the mass of profit grew by 142%. After 2005 and until 2019, however, it stagnated, having grown by merely 1.5% over the entire period.

Canada did escape much of the impact from the global financial crisis of 2008-9 because of the long period of relatively strong profitability and capital accumulation preceding the crisis.  But by 2006, according to McCormack. profitability had begun to erode.  "Afterwards, "sneaking" stagnation became increasingly evident in rates of capital accumulation, capacity utilization, employment, as well as real wage and GDP growth."

In the eight years following 2010, business investment in plant and machinery grew by an average of only 0.1%. Recovery after the Great Recession was driven a credit-fuelled boom in housing.  People got jobs but at low rates of pay, just as in other G7 economies.  In the years following the Great Recession, real wage growth slowed substantially, averaging just 0.4% per year.  As McCormack says, "given poor profitability, lacklustre capital accumulation, truncated capacity utilization, low employment and low real wage growth, it is unsurprising that real GDP growth, too, was weak."

Canada increasingly relies on its production of oil and gas and other mineral resources. And so there is no drive to phase out fossil fuel production to save the planet. Trudeau put it in a speech to cheering Texas oilmen a couple of years ago: "No country would find 173 billion barrels of oil in the ground and leave them there." So Canada, which is 0.5% of the planet's population, plans to use up nearly a third of the planet's remaining carbon budget. There's oil in the ground and it must come out.

And even the growth in incomes in the last decade was not shared equally.  As in other OECD economies, the share of income going to the top 1% of 'earners' rocketed while the share going to the bottom 50% fell. Indeed, the top 1% has nearly as much income as the bottom 50%!

Canada: top 1% share (blue); bottom 50% (red) – World Inequality Database.

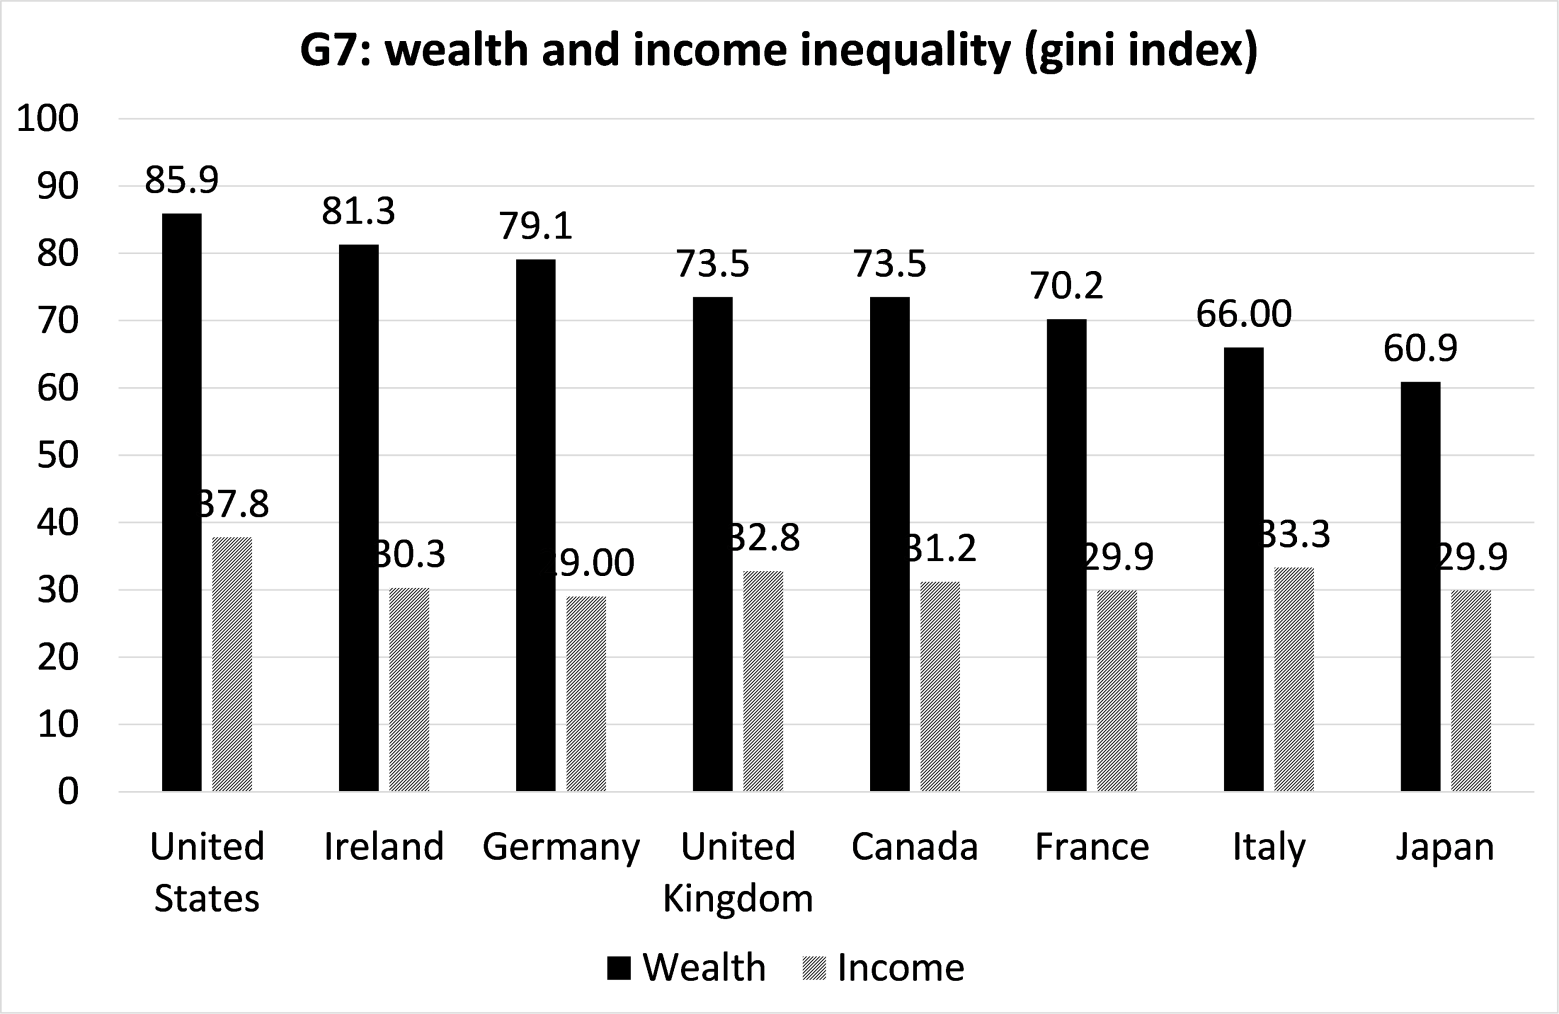
And wealth inequality in Canada is on a par with other G7 economies.

Source: World Bank

So the decade since 2009 has been characterized by sneaking stagnation, rooted in profitability problems that began after 2005. This has manifested itself in the stagnant accumulation of machinery and equipment, low industrial capacity utilization rates, low employment levels, as well as low real wage and GDP growth.  It is an expression of what I have called the Long Depression that all the major capitalist economies have sunk into since 2009 in the ten years leading up to the COVID slump.

And just as in other major G7 economies, corporate and household debt has jumped to record highs.  Despite very low interest rates, Canada's corporate sector is weighed down by debt service costs. In 2020, 55% of corporate income went to paying interest and principal payments on loans, whereas it amounted to 43% in the US. The debt service ratio increased from 38% in 2006 to 57% in 2019 as economic stagnation wore on business balance sheets.

The Bank of Canada economists have classified 25% of Canada's publicly traded companies as zombie firms ie. they persistently do not earn enough revenue to cover interest payments on their outstanding debts.

So Canadian capitalism bears all the hallmarks of the contradictions facing the rest of the G7 economies as they come out of the COVID slump.  PM Trudeau achieved nothing with his snap election and faces the same problems in getting Canada's capitalist economy going as before.


 -- via my feedly newsfeed