Friday, September 17, 2021

Black and brown workers saw the weakest wage gains over a 40-year period in which employers failed to increase wages with productivity [feedly]

Black and brown workers saw the weakest wage gains over a 40-year period in which employers failed to increase wages with productivity
https://www.epi.org/blog/black-and-brown-workers-saw-the-weakest-wage-gains-over-40-year-period/

Key takeaways:
  • Wage growth for typical Black and Hispanic workers fell far short of growth for white workers over the past 40 years.
  • Increasing income inequality overall and racial discrimination in the labor market both play a role in limiting wage gains for Black and Hispanic workers.
  • Women's median wages have increased since 1979 but still lag those of men. Gains among women have not been equally shared, with white women seeing the largest wage increases.
Policy recommendations:
  • Create "high-pressure" labor markets by running the economy hot through expansionary macroeconomic policies; prioritizing low unemployment will help spur job growth as well as wage growth, especially for Black workers.
  • Prioritize anti-discrimination enforcement.
  • Pass the Raise the Wage Act and the Richard L. Trumka PRO Act. These would have a range of positive benefits for workers across the board, and especially for women, Black, and Hispanic workers.

Increasing income inequality has been at the forefront of economic policy conversations in the United States since at least the 2008 financial crisis. The roots of that inequality stretch back much further, though. Growing employer opposition to unions and the shift from manufacturing toward finance as a major growth industry over many decades has resulted in a separation between worker pay and productivity that has persisted to this day.

There has been growing concern about the wage stagnation faced by the typical American worker, and increasing attention paid to the need to rectify this—to ensure that workers reap the gains associated with their increased productivity.

By the numbers

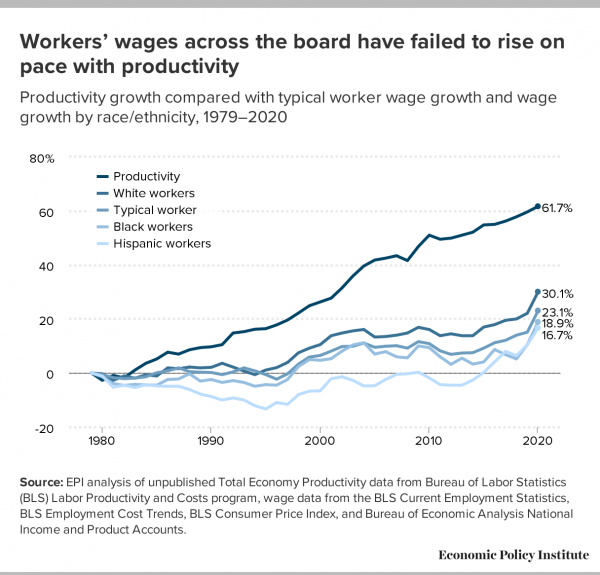
Wage growth by race/ethnicity, 1979–2020

  • White workers: 30.1 %
  • Black workers: 18.9%
  • Hispanic workers: 16.7%

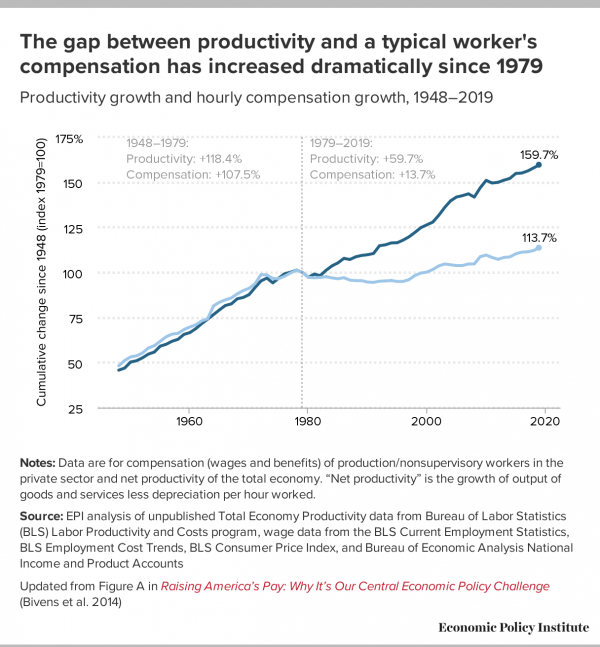
The productivity–pay gap

  • Productivity growth, 1979–2020: 61.7%
  • Typical worker wage growth, 1979–2020: 23.1%

However, there has not been as much attention paid to the distinct divisions that exist even among the generally undercompensated working class. While the typical worker has not seen their fair share of wage increases relative to the increase in productivity over the past 40 years, Black and Hispanic workers saw even smaller wage gains relative to their white counterparts.

These racial disparities in pay add another dimension to conversations about gaps between pay and productivity, and about income inequality in general. While policies designed to link the typical worker's pay more closely with productivity are necessary to reduce income inequality overall, the persistence of disparities even within the working class shows us that targeted policies will be required in addition if we want to achieve the goal of true equity across the board.

Closing wage gaps for the vast majority of undercompensated workers is not a zero-sum game. The right combination of progressive class-based policies targeting income and wage inequality, alongside anti-discrimination policies targeting race-specific gaps, can have powerful effects on raising all workers' pay.

Key takeaways of this post include:

  • The typical worker's wages rose only 23.1% from 1979 to 2020, while productivity increased 61.7%. For Black and Hispanic workers, wage growth was even more dismal, at 18.9% and 16.7%, respectively.
  • Skyrocketing income inequality as a whole has mechanically increased measured racial gaps, and clamping down on concentrated redistribution at the top levels of the income bracket will play a large role in raising all workers' pay.
  • Given that Black workers face a "double penalty" due to a combination of wage inequality and employer discrimination, policies targeting racial gaps need to be combined with progressive class-based policies.
  • Women's median wages have increased since 1979 but still lag behind those of men. Gains among women have not been equally shared, with white women seeing the largest wage increases.
  • A powerful multiracial coalition that draws attention to the positive-sum solidarity behind closing the pay–productivity gap can put pressure on policymakers to achieve this long overdue pay raise for the vast majority of U.S. workers.

Trends in pay/productivity over the past 40 years

Over the past 40 years, declining union density across the country has coincided with a separation between growth in wages and growth in productivity. This represents a concrete shift in the balance of power between employers and management versus the typical worker. While productivity gains created the potential for pay increases, most wage gains since the 1980s have gone to the highest-paid employees. While worker productivity grew by 61.7% between 1979 and 2020, workers' median wages grew by only 23.1% (Figure A). Meanwhile, CEO pay has skyrocketed compared with the pay received by the typical worker; the ratio of CEO-to-typical-worker compensation was 351-to-1 in 2020, and realized compensation for CEOs grew by 1,322% between 1978 and 2020.

Figure A
Figure A

This delinking of pay from productivity has led to an explosion of growth-limiting inequality in the United States; that is, not only has the economic "pie" become less evenly distributed, but it has also grown at a slower pace than it could have grown under a more equal distribution.

This means that a thoughtfully selected set of policy decisions has the potential to both produce faster economic growth and reduce inequality.

Trends in racial wage gaps over the past 40 years

Racial wage disparities are a long-standing feature of the U.S. economy; little progress has been made in reducing gaps since the 1980s, when political opinion turned against affirmative action and other race-specific policy levers. The primary avenue through which discrimination affects racial wage gaps is through occupational segregation; employers tend to sort Black, Hispanic, and white workers into different occupations with differing levels of compensation and potentials for advancement.

Wilson and Rodgers (2016) conclude that, since the 1980s, racial discrimination has played the largest role in widening the gap between Black and white pay. Quillian et al. (2017) find no reduction in the level of racial discrimination in hiring against Black job seekers since 1989. These should not be surprising results, as the Equal Employment Opportunity Commission (EEOC), the federal institution tasked with investigating violations of and enforcing antidiscrimination law, has been severely underfunded for decades. Recent work by Kline et al. (2021) shows that a few large firms in the U.S. economy are prolific discriminators at a systemic level. This suggests that targeted anti-discrimination enforcement may be an effective tool to help reverse this trend.

The rise in income inequality more generally, as well as the separation between the typical worker's pay and productivity, has also influenced racial wage gaps. We know that pay increases have been concentrated at higher income levels over the last 40 years, while lower-income workers have seen much lower wage growth. Since Black and Hispanic workers are disproportionately concentrated in lower-income occupations, this unequal wage growth has fallen more heavily on those workers than on their white counterparts.

As the recovery from the 2008 financial crisis stretched into the longest period without a recession in U.S. history in the late 2010s, the slowly tightening labor market began to produce wage gains for those at the bottom of the income distribution. This is consistent with economic history: Tight labor markets (supported by expansionary monetary policy) have historically been necessary to bring about wage increases for low-income workers and have been crucial in reducing racial gaps in labor market outcomes.

Anomalous wage 'growth' in 2020: The impact of the COVID-19 pandemic on wage data

The onset of the coronavirus pandemic and its ensuant recession cut the long expansion abruptly short.  In the year after the recession, the effect on the typical worker's wages was counterintuitive, however. Median wages increased across the board during 2020, to a greater degree than in any single year since 1998. In fact, most of the wage gains relative to 1979 for Black and Hispanic workers came in 2020—but not for the reasons one might hope. The wage "growth" on the surface masks the bad news we already knew: Millions of people lost their jobs in 2020, including large numbers of low-wage workers.

Wage growth in the late 1990s and late 2010s was driven by a historically tight labor markets and low interest rates, but job losses drove the spike in 2020. There was a dramatic shift in the composition of jobs being measured, as low-income jobs disappeared to such a degree that the wages left to be measured were mechanically higher.

The service-sector workers hit the hardest by the pandemic and recession were not only those with some of the lowest wages and fewest labor protections, but they were also among those at highest risk for contagion. Given that risk, combined with closures of schools and child care centers, it is not surprising that many workers did not or could not return to their prior jobs when the economy began to reopen.

Meanwhile, those in middle- and high-income occupations were able to convert some or all of their work to remote work much more easily than those in low-income occupations, due both to the inherent nature of the work and the flexibility of work arrangements that comes with having a higher-status job. Therefore the median wage skewed upward toward these middle- and high-income workers.

Real wage raises continue to be long overdue for most workers, which is cause for deep concern. We have yet to see a sustainable increase in bargaining power on behalf of American workers as a result of the pandemic. And without lasting and direct policy changes, any rises in wages workers may have experienced in 2020 are likely to be transitory rather than concrete, permanent increases.

Women's pay and productivity pre- and post-2020

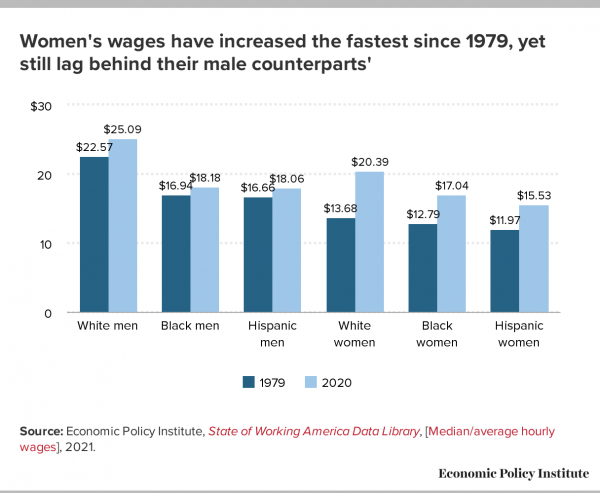
While women have seen more significant wage gains than men, percentage-wise, over the past 40 years, their wages have neither caught up to men's wages (Figure B) nor have they kept pace with the overall increase in economywide productivity. Among white, Black, and Hispanic men and women, Black and Hispanic women had the lowest median wages in both 1979 and 2020.

Moreover, women did not experience wage gains equally over the last 40 years. Among women in all racial/ethnic groups, white women received the largest wage increases across all periods. In fact, the gap between white women's wages and Black and Hispanic women's wages has widened dramatically between 1979 and 2020: In 1979, white women were paid around 6.9% and 14.3% more, respectively, than Black and Hispanic women. By 2020, these gaps had widened to 19.7% and 31.3%.

Figure B
Figure B

The 2020 pandemic and recession only exacerbated these disparities, impacting women especially severely. Black, Hispanic, and Asian American/Pacific Islander (AAPI) women have long been overrepresented and underpaid in service and care industries (as are women in general), and these industries were among the hardest hit during the pandemic. Women are also more likely to work in state and local public sectors—including a large number working as educators; these public-sector occupations also faced huge levels of unemployment due to public health closures.

With schools and child care centers closed for in-person services, millions of women also left the workforce to care for their children. The lack of safe and affordable child care made the situation especially untenable for low-income households. Even before the unprecedented 2020 shock, women's wages were lagging their productivity as well as lagging behind men's wages, with Black and Hispanic women facing a triple penalty of rising income inequality alongside racial/ethnic and gender discrimination. Women's pay–productivity gap, and the racial and gender disparities within that gap, will only persist—and may widen—without targeted and deliberate policy interventions.

Inequality restricts the economy's potential for growth, but equity can have benefits across groups

Even in the wake of 40 years of increasing income inequality, in general and with respect to race, we can choose to design economic policy that promotes both equity and economic growth. We can grow a healthier economy by curbing the exorbitant growth of compensation at the top of the earnings ladder and giving workers at lower- and middle-income levels more direct control over their working conditions and pay. When paired with well-enforced anti-discrimination laws and material consequences for those who violate those laws, the potential exists for growth that is equitable across class and racial lines.

There may still be conflict when pursuing a growth path that is racially fair and class conscious. Pursuing equity implies a change in relative position for white workers with respect to Black and Hispanic workers, as well as for men with respect to women workers. There will also be resistance from the most highly paid strata of employees toward a more even distribution across workplaces. The fact remains, however, that our pace of productivity growth provides the means for workers across groups to benefit and for those who have been barred from receiving their fair share to finally do so.

Addressing inequality and racial disparities beyond the pandemic

Moving forward, policymakers cannot settle for a pre-pandemic economic status quo. As we've seen, prior to 2020, the gap between productivity and compensation has been widening dramatically since 1979, with especially strong racial and gender disparities. Without sustained investment in raising wages, compensation, and benefits; improving working conditions; and eliminating labor market discrimination, all workers will continue to see their pay dwindle even as their vital labor boosts the economy. There are several short- and long-term policies and economic strategies to close the pay–productivity disparities:

  • Tight labor markets: Running the economy hot with "high-pressure" labor markets through expansionary macroeconomic policies and a prioritization of low unemployment can help spur job growth as well as wage growth, especially for Black workers. Concerns over inflation and overheating should not get in the way of strengthening the economic recovery and making sure all workers are seeing the gains.
  • Anti-discrimination enforcement: Persistent labor market discrimination and occupational segregation plays an outsize role in how Black and Hispanic workers experience the labor market and employment. Despite educational attainment or job experience, many Black and Hispanic workers are less likely to be hired for certain jobs than less qualified white peers; this is also true for women workers relative to their male counterparts. Pursuing only race-blind or universal economic policies will miss addressing this insidious and engrained phenomenon. Therefore, anti-discrimination enforcement, such as by the EEOC, is crucial.
  • Pro-worker legislation: Immediately passing the Raise the Wage Act and the Richard L. Trumka PRO Act will have a range of positive benefits for the workers who have seen their pay stagnate over decades. Higher wages and stronger access to unionization and collective bargaining can help level the playing field and give working people negotiating power with their employers.

Most workers have seen their wages stagnate even as their productivity has risen. Black workers face a double penalty as the forces of growing inequality and racial discrimination reinforce each other.

Recognizing and rectifying the pay–productivity gap is crucial as we strive toward racial and economic justice for Black and brown workers. Economic recovery in the short term, and equity in the long run, will only be achieved when direct policies target income and wage inequality and are paired with anti-discrimination and other measures to close race-based gaps. Through this class- and race-conscious approach, all workers will receive the benefits of the economic strength and prosperity they have built.


 -- via my feedly newsfeed

Thursday, September 9, 2021

On Dialectics


Engels:


"From that time forward [Economics as an objective measure of social motion and development] , Socialism was no longer an accidental discovery of this or that ingenious brain, but the necessary outcome of the struggle between two historically developed classes — the proletariat and the bourgeoisie. Its task was no longer to manufacture a system of society as perfect as possible, but to examine the historico-economic succession of events from which these classes and their antagonism had of necessity sprung, and to discover in the economic conditions thus created the means of ending the conflict. But the Socialism of earlier days was as incompatible with this materialist conception as the conception of Nature of the French materialists was with dialectics and modern natural science. The Socialism of earlier days certainly criticized the existing capitalistic mode of production and its consequences. But it could not explain them, and, therefore, could not get the mastery of them. It could only simply reject them as bad. The more strongly this earlier Socialism denounced the exploitations of the working-class, inevitable under Capitalism, the less able was it clearly to show in what this exploitation consisted and how it arose, but for this it was necessary —"


Lenin: from Notebooks

1) The determination of the concept out
of itself [the thing itself must be consid-
ered in its relations and in its develop-
ment];

2) the contradictory nature of the thing
itself (das Andere seiner[1]), the contra-
dictory forces and tendencies in each phe-
nomenon;

3) the union of analysis and synthesis.

Such apparently are the elements of
dialectics.

One could perhaps present these ele-
ments in greater detail as follows:


the objectivity of consideration
(not examples, not divergencies, but
the Thing-in-itself).
X
the entire totality of the manifold
relations of this thing to others.
the development of this thing,
(phenomenon, respectively), its own
movement, its own life.
the internally contradictory tenden-
cies (and sides) in this thing.
the thing (phenomenon, etc.) as the
sum and
#
unity of opposites.
the struggle, respectively unfold-
ing, of these opposites, contradictory
strivings, etc.
the union of analysis and synthesis—
the break-down of the separate parts
and the totality, the summation of
these parts.
the relations of each thing (phenome-
non, etc.) are not only manifold, but
general, universal. Each thing (phe-
nomenon, process, etc.) is connected
with every other. X
not only the unity of opposites, but
the transitions of every de-
termination, quality, feature, side,
property into every other [into its
opposite?].
the endless process of the discovery
of new sides, relations, etc.
the endless process of the deepening
of man’s knowledge of the thing, of
phenomena, processes, etc., from ap-
pearance to essence and from less pro-
found to more profound essence.
from co-existence to causality and from
one form of connection and reciprocal
dependence to another, deeper, more
general form.
the repetition at a higher stage of
certain features, properties, etc., of
the lower and
the apparent return to the old (nega-
tion of the negation).
the struggle of content with form and
conversely. The throwing off of the
form, the transformation of the con-
tent.
the transition of quantity into quality
and vice versa ((15 and 16 are examples of 9))


In brief, dialectics can be defined as the doctrine of
the unity of opposites. This embodies the essence
of dialectics, but it requires explanations and develop-
ment.

(The totality of all sides of the
phenomenon, of reality and their (re-
ciprocal) relations—that is what
truth is composed of. The relations
(= transitions = contradictions) of
notions = the main content of logic,
by which these concepts (and their
relations, transitions, contradictions)
are shown as reflections of the objec-
tive world. The dialectics of things
produces the dialectics of ideas, and
not vice versa.)


Sunday, September 5, 2021

Corporate America Is Lobbying for Climate Disaster [feedly]

Corporate America Is Lobbying for Climate Disaster
https://www.nytimes.com/2021/09/02/opinion/corporate-taxes-biden-spending-bill.html

Why does Mickey Mouse want to destroy civilization?

OK, that's probably not what Disney executives think they're doing. But the Walt Disney Company, along with other corporate titans, including ExxonMobil and Pfizer, is reportedly gearing up to support a major lobbying effort against President Biden's $3.5 trillion investment plan — a plan that may well be our last chance to take serious action against global warming before it becomes catastrophic.

To say what should be obvious, the dangers of climate change are no longer hypothetical. The extreme weather events we've recently seen around the globe — severe drought and forest fires in the American West; intensified hurricanes, catastrophic flooding in Europe; heat waves pushing temperatures in the Middle East above 120 degrees — are exactly the kinds of thing climate scientists warned us to expect as the planet warms.

And this is just the beginning of the nightmare — the leading edge of a wave of disasters, and a harbinger of the crisis heading our way if we don't act quickly and forcefully to limit greenhouse gas emissions.

What can be done to avoid catastrophe? Many economists favor broad-based incentives to limit emissions, such as a carbon tax. There's an interesting, serious economic debate over whether that's really the best policy, or at any rate whether emissions taxes would be a sufficient policy on their own. As a practical matter, however, that debate is moot: Carbon taxes, or anything like them, won't be politically feasible any time soon.

ADVERTISEMENT

Continue reading the main story

What might be politically feasible — just — is a set of more targeted measures, in particular an effort to decarbonize electricity generation. Generation is, in economic terms, a relatively soft target, because near-miraculous declines in the cost of renewable energy mean that we already have the technology needed to move away from fossil fuels fairly cheaply. And electricity generation isn't just directly responsible for about a quarter of U.S. greenhouse gas emissions; if electricity becomes a clean power source, that would open the door to large reductions in emissions from vehicles, buildings and industry via widespread electrification.

The good news is that Biden's proposals would provide a big push toward decarbonization. As the climate journalist David Roberts points out, there are two major climate-related elements in these proposals: a set of fines and subsidies that would give power companies strong incentives to stop burning fossil fuels, and expanded tax credits for various forms of clean energy. These policies would fill only part of environmentalists' wish lists, but they would be a very big deal.

The bad news is that if these proposals aren't enacted, it will probably be a very long time — quite possibly a decade or more — before we get another chance at significant climate policy.

Let's face it: There's a good chance that Republicans will control one or both houses of Congress after the midterm elections. And at this point climate denialism has a deathlike grip on the G.O.P. — a grip unlikely to loosen until complete catastrophe is upon us, and maybe not even then. Look at the way anti-mask-mandate, anti-vaccine-mandate Republican governors are doubling down in the face of soaring Covid-19 hospitalizations and deaths.

So the Democratic reconciliation bill that will either succeed or fail in the next few weeks may well be, in effect, our last chance to do something meaningful to limit climate change.

ADVERTISEMENT

Continue reading the main story

Why, then, is corporate America mobilizing against the bill? Because Democrats are proposing to offset new spending partly with higher taxes on corporate profits, and to a lesser extent by using the government's bargaining power to negotiate lower prices for prescription drugs. This approach is necessary as a political matter: If taxes must be raised, the public wants to see them raised on corporations. But corporations, not surprisingly, don't want to pay.

So corporate opposition to the Biden plan is understandable. It's also unforgivable.

And maybe something can be done about it. Republicans, I fear, are completely unreachable at this point. But corporations and the handful of Democrats tempted to carry their water may still be susceptible to pressure.

After all, we're no longer living in the era when William Henry Vanderbilt, the railroad tycoon, declared, "The public be damned." Today's corporations want to be seen as socially responsible; they run gauzy ads proclaiming the good they do.

But it's hard to think of anything more irresponsible than torpedoing efforts to avoid a civilization-threatening crisis because you want to hold down your tax bill.

So the corporations joining this effort need to be named and shamed. So do the handful of Democratic "moderates" carrying their water. ("Mercenaries" would be a better term for politicians opposing measures that they should know are both necessary and popular.)

Remember, this isn't an ordinary policy dispute, which can be revisited another day. This is zero hour, and those who don't do the right thing now won't get a second chance.


 -- via my feedly newsfeed

A “Medicare Funding Warning” from the Trustees [feedly]

A "Medicare Funding Warning" from the Trustees
https://conversableeconomist.wpcomstaging.com/2021/09/02/a-medicare-funding-warning-from-the-trustees/

The trustees of the Medicare program have published their annual report, the imposingly titled 2021 Annual Report of the Boards of the Trustees of the Federal Hospital Insurance and Federal Supplementary Medical Insurance Trust Funds. The annual report came out considerably later than usual, about five months after the statutory deadline, and I suspect there's a story there. But here, I'll focus on the projections themselves. The trustees write:

The Trustees are issuing a determination of projected excess general revenue Medicare funding in this report because the difference between Medicare's total outlays and its dedicated financing sources is projected to exceed 45 percent of outlays within 7 years. Since this determination was made last year as well, this year's determination triggers a Medicare funding warning, which (i) requires the President to submit to Congress proposed legislation to respond to the warning within 15 days after the submission of the Fiscal Year 2023 Budget and (ii) requires Congress to consider the legislation on an expedited basis. This is the fifth consecutive year that a determination of excess general revenue Medicare funding has been issued, and the fourth consecutive year that a Medicare funding warning has been issued.

Two points are worth emphasizing here. One is that this "Medicare funding warning" was not created by COVID. As the report notes, the trustees have now been issuing the warning for the last four years. If you did not notice the Trump administration responding with proposed legislation to address the problem, along with Congress taking up such legislation on an expedited basis, that's because it didn't happen.

Second, this issue isn't about COVID. Yes, COVID had lots of short-term effects on Medicare, as the report describes. For example, the drop in employment as a result of the pandemic recession reduced Medicare payroll taxes. But on the expenditure side, the rise one would expect in expenditures related to COVID was actually offset by declining Medicare spending in other areas. The trustees write:

Spending was directly affected by the coverage of testing and treatment of the disease. In addition, several regulatory policies and legislative provisions were enacted during the public health emergency that increased spending; notably, the 3-day inpatient stay requirement to receive skilled nursing facility services was waived, payments for inpatient admission related to COVID-19 were increased by 20 percent, and the use of telehealth was greatly expanded. More than offsetting these additional costs in 2020, spending for non-COVID care declined significantly … This decline was particularly true for elective services.

Medicare's funding problems were apparent before the series of "Medicare funding warning" alarms started going off a few years ago. To understand the scope of the problem, it's useful to sketch the structure of the program. Part A is Hospital Insurance. Part B is Supplementary Medical Insurance–that is, all the other non-hospital care. Part C is Medicare Advantage, where Medicare pays a flat annual premium for the recipient to enroll in a private health care plan that can provide hospital, non-hospital, and in some cases prescription drugs as well. In Part A and Part B, Medicare uses fee-for-service payments to providers. Part D is the Prescription Drug Benefit that was enacted in 2006.

As the trustees note: " In 2020, Medicare covered 62.6 million people: 54.1 million aged 65 and older, and 8.5 million disabled. About 40 percent of these beneficiaries have chosen to enroll in Part C private health plans that contract with Medicare to provide Part A and Part B health services. … Total Medicare expenditures were $926 billion in 2020." To put that number in perspective, total Social Security spending in 2020 is approaching $1.1 trillion, while total defense spending is a little under $800 billion."

Of course, none of these parts of Medicare are funded in exactly the same way, which complicates talking about them. For example, Part A has a trust fund that is almost entirely funded by "Hospital Insurance" payroll taxes. Because this is the legislated source of funding for Part A, it's possible for this trust fund to run out of money, which is currently projected for 2026. Indeed, the trustees have been sounding the alarm that the trust fund has fallen below a standard of short-term financial solvency every year since 2003.

However, the "trust funds" for Part B of Medicare, the Supplementary Medical Insurance, and for Part D, the prescription drug benefit, cannot go bankrupt. The reason is just a matter of bookkeeping–if this "trust fund" falls short, then legally the bills will be paid out of general federal revenues. Indeed, Presto! Bankruptcy for Part B is impossible! In 2020, general federal revenues pay for about 80% of Part B spending, and individual premiums cover most of the rest. For Part D, the prescription drug benefit, general federal revenue covers about 75% of all spending in 2020, with a mixture of individual premiums and state-level contributions covering most of the rest. For Part C, the Medicare Advantage plans, there is no separate source of funding–instead, money is switched over from the payroll taxes, individual premiums, and government payments that support Parts A and B.

A desire to cut through these legislative distinctions and get to the bottom line helps to explain the phrasing of the warning from the trustees: "[T]he difference between Medicare's total outlays and its dedicated financing sources is projected to exceed 45 percent of outlays within 7 years." What exactly are the "dedicated funding sources" for Medicare? As the trustees write: "Dedicated financing sources consist of HI payroll taxes, HI share of income taxes on Social Security benefits, Part D State transfers, Part B drug fees, and beneficiary premiums."

For Medicare, let's simplify the picture by looking at the entire program, not the separate parts. Under what seems like the inexorable pressures of higher health cares spending, Medicare is evolving in ways that have received little public attention.

Back in 2000, Medicare spending was about 2.2% of GDP. In 2020, total Medicare spending is about 4% of GDP. Looking out 20 years to 2040, total spending is projected at 6% of GDP. It's worth noting that these projected long-term costs are likely to be conservative. The actuaries who produce the underlying calculations are required to focus on projections under current law. Thus, Congress has for some years been playing a merry game of legislating cost reductions (like lower payments to Medicare physicians) that don't kick in until five or ten years down the road. These cost reductions don't actually take place; instead, they keep getting postponed. A cynic might say that their only real purposes is to pretend do so something about future costs.

Back in the year 2000, general federal tax revenues were about 28% of Medicare's income, while payroll taxes covered 60% and individual premiums covered 9%. Now in 2020, the share of Medicare's income from payroll taxes has fallen to 34%; to counterbalance that change, the share from individual premiums has risen to 15% and the share from general revenues has risen to almost 47%.

Looking ahead, the share of Medicare income covered by payroll taxes is projected to keep falling to 25%, while the share covered by individual premiums is projected to rise to nearly 20% and the share from general federal revenues will reach about 50%.

In short, just 20 years ago, Medicare was a much smaller program primarily (60%) funded by payroll taxes. Looking ahead 20 years, it is a much larger program, funded primarily by a combination of general revenues (50%) and individual premiums (20%). This shift is really what the "Medicare funding warning" from the trustees is all about.

The working assumption over Medicare's funding warning seems to be that any shortfalls will just be covered by general fund revenues. For the short-term, this is a workable if inelegant solution. But over longer time horizons, it becomes a problem. Higher general fund spending competes with other budgetary priorities. Higher health insurance premiums for the elderly competes with the rest of their household budget, too.

Continuing to ignore possible solutions is short-sighted. On the issue of climate change, a number of people are strongly in favor of taking near-term and fairly costly steps for a long-run benefit. They offer harsh criticism to anyone who says: "Maybe the underlying assumptions are wrong. And if they are correct, we'll worry about it later." But fiscal predictions of the Medicare actuaries are based on much simpler calculations than models of atmospheric climate change and its effects on Earth and the economy. The effects come sooner. And the same basic lesson holds: If you take wait to take action as the long-term problem arrives, the steps needed at that time are going to be substantial or even extreme. Taking actual real steps in the near-term helps to avert the need for extreme steps later."


 -- via my feedly newsfeed

Friday, September 3, 2021

Enlighten Radio:Talkin Socialism: What Socialista Say about Labor Day

The Red Caboose has sent you a link to a blog:


Blog: Enlighten Radio
Post: Talkin Socialism: What Socialista Say about Labor Day
Link: https://www.enlightenradio.org/2021/09/talkin-socialism-what-socialista-say.html

--
Powered by Blogger
https://www.blogger.com/

Growing inequalities, reflecting growing employer power, have generated a productivity–pay gap since 1979: Productivity has grown 3.5 times as much as pay for the typical worker [feedly]

In the quest for economic justice, as in "fair wages" or "fair trade", PRODUCTIVITY is an important and, as it turns out, rather profound practical and theoretical challenge. In the universe of physical commodities,  it is arguably the best objective measure of the labor component in the "value" of a product produced solely for exchange, meaning 'sale', instead of personal use or gift..  

In labor contract negotiations, for example, our union frequently sought to resolve wage disputes by asking to see the unit labor costs for the duration of the past contract. Unit labor cost was defined simply as the product sales divided by the average per hour direct labor bill, comparable to a "firm" productivity measure. The companies usually declined to provide that information on grounds of "confidentiality in proprietary corporate processes". This led, of course, to union distrust of company claims of being unable to afford union proposed wage rates and benefits. 

Current measures of productivity, however, fail to capture the  objectivity, or  thus accuracy,  reflected in the price/wage ratios of physical commodities,  when measuring services (where only labor is exchanged) -- especially public services. The product is no longer homogenous, but variable with the human capital deployed: a lawyer, a cleaning service, etc.  The failure is even more obvious in measuring intangibles (software, etc). Amazon, for example, cannot say for certain what the value add of its Amazon Web Services division -- the largest cloud hosting service -- really is. Yet Bezos chose its leader as his replacement CEO. 

As physical production grows more and more automated, services and intangibles begin to consume a bigger and bigger share of GNP, and the workforce. A key value proposition of capitalism is simultaneously becoming more difficult to define. A new chapter, perhaps, in the labor theory of value: "we think its getting bigger, but cannot define how much".

Growing inequalities, reflecting growing employer power, have generated a productivity–pay gap since 1979: Productivity has grown 3.5 times as much as pay for the typical worker
https://www.epi.org/blog/growing-inequalities-reflecting-growing-employer-power-have-generated-a-productivity-pay-gap-since-1979-productivity-has-grown-3-5-times-as-much-as-pay-for-the-typical-worker/

Key takeaways:

  • Productivity and pay once climbed together. But in recent decades, productivity and pay have diverged: Net productivity grew 59.7% from 1979-2019 while a typical worker's compensation grew by 15.8%, according to EPI data released ahead of Labor Day.
  • If median hourly compensation had grown at the same rate as productivity over the 1979-2019 period, the median worker would be making $9.00 more per hour.
  • This divergence has been primarily driven by intentional policy choices creating rising inequality: both the top 10% and especially the top 1% and top 0.1% gained a much larger share of all compensation and labor's share of income eroded.
  • Public policies which restore worker power and balance in the labor market can provide robust, widely shared wage growth.

The growth of inequalities is the central driver of the widening gap between the hourly compensation of a typical (median) worker and productivity—the income generated per hour of work—in recent decades. Specifically, this growing divergence has been driven by the growth of two distinct dimensions of inequality: the surge of compensation received by the top 10%—particularly the top 1.0% and top 0.1%—and the erosion of labor's share of income and the corresponding growth of capital's share. This post documents these trends by presenting an updated account of the U.S. productivity-pay divergence originally analyzed in both Mishel and Gee 2012 and Bivens and Mishel 2015

The key metric, as explained below, is the lag between the growth of net productivity (taking into account depreciation and evaluated using consumer prices) and hourly compensation (wages and benefits) of a typical or median worker. Between 1979 and 2019, net productivity grew 59.7% while a typical (median) worker's compensation grew by 15.8%, a 43.9 percentage point divergence driven by inequality. The effects have been felt broadly: During this period, 90% of U.S. workers experienced wage growth (26%) far slower than the economywide average, while workers in the top 1% (mostly highly credentialed professionals and corporate managers) saw 160% wage growth (Mishel and Kandra 2020) and owners of capital reaped large rewards made possible only by this anemic wage growth for the bottom 90%.

This divergence between net productivity and a typical worker's compensation means that neither slow productivity growth nor inevitable economic forces can explain the poor wage growth of America's workers. In fact, wage problems are a "failure by design" (Bivens 2010), engineered by those with the most wealth and power. The dynamics are primarily located in the labor market and the strengthening of employers' power relative to their rank-and-file workforce (which increasingly includes those workers with a four-year college degree). As Mishel and Bivens (2021) recently documented, wage suppression was generated by policy choices that resulted in excessive unemployment, eroded unionization, corporate globalization, lower labor standards (e.g., lower minimum wage), new imposed contract terms (e.g., noncompetes), and corporate structures changes that pushed down wages and profits in supply chains to the benefit of large firms.

The gap between productivity and median hourly compensation growth

The last four decades have seen a systematic divergence between the growth of economywide productivity and the growth of hourly compensation (wages and benefits) for typical workers. We proxy the wages of "typical" workers as either wages for nonsupervisory workers (roughly 80% of the private-sector workforce) or wages for the worker earning the median wage. As a starting point, we compare this to the growth of net productivity for the entire economy (rather than only nonfarm businesses or any subset of the economy).

Figure A below shows the growth of net productivity (gross productivity minus depreciation) adjusted for inflation according to consumer prices (rather than inflation in all types of output including investment goods and government), which is labeled 'effective productivity' as it is available for household consumption. Figure A compares this growth with the typical worker's hourly compensation since 1948, using the hourly compensation of production/nonsupervisory workers because that is the only series available for the entire period since 1948 (it corresponds closely to median wage growth). Further detail on the underlying data and measurement issues can be found on the newly expanded EPI page providing information on the productivity-pay gap.

Figure A
Figure A

The starting point in the analysis below is net productivity measured at output prices since that is how statistical agencies measure productivity and it allows us to illustrate the difference between net productivity measured at consumer rather than output prices. Net productivity measured at output prices and a typical worker's compensation grew roughly in tandem over the 1948–1973 period, but strongly diverged thereafter and split entirely after 1979. Specifically, this measure of productivity grew 112.5% from 1948 to 1979 with a corresponding 90.2% growth in a worker's compensation. In contrast, productivity grew 85.1% (1.55% annually) further between 1979 and 2019, but a typical worker's compensation grew by only 13.2% (0.31% annually). Again, this calculation is for net productivity measured at output prices rather than consumer prices.

This divergence was first pointed out in the early 1990s (Mishel and Bernstein 1994) to demonstrate that stagnant wages for the typical worker over the previous decade or so could not be explained solely or even mainly by the slowdown of productivity growth. This section updates our 2015 analyses of the wedges between typical workers' pay and productivity and the decomposition of the main factors generating it, drawing on previous work (Mishel and Gee (2012) and the decomposition framework developed by the Centre for the Study of Living Standards: Sharpe, Arsenault, and Harrison 2008a; Sharpe, Arsenault, and Harrison 2008b; and Harrison 2009. This decomposition enables a breakdown of the productivity-pay divergence into the three wedges between compensation and productivity: (1) growing inequality of compensation; (2) the erosion of labor's share of income; and (3) the divergence of the growth of output prices (used to measure productivity) and consumer prices (used to measure worker compensation trends).

These three wedges are illustrated in Figure B. The first is the area between net productivity deflated by the implicit price deflator (output prices in net domestic product) and net productivity deflated by consumer prices (CPI-U-RS), which is labeled "net effective productivity." The second wedge is the gap between net effective productivity and average compensation (also deflated by consumer prices), reflecting changes in labor's share of income. The third wedge is the area between average compensation growth and median hourly compensation growth, which reflects growing inequality of compensation.

Figure B
Figure B

The top panel (A) in Table 1 below provides the basic trends required to compute the divergence and the wedges in each of the subperiods starting in 1973 and for the entire 1979-2019 period. The 1979-2019 period is chosen as the period for analysis (though there are data through 2020) since this is the period of rising inequality and 1979 and 2019 are both cyclical peaks (years of low unemployment) and therefore suitable for comparison. We compute the wedges between net productivity (productivity net of capital depreciation, which is a better metric of the income available from productivity growth than is gross productivity) in row 2 and median hourly compensation (wages and benefits) presented in row 6 but provide data on median wages and gross productivity for completeness. We shift to the compensation of the median worker rather than for nonsupervisory workers because data for the median worker are available starting in 1973 (the results are comparable, regardless of measure).

Table 1
Table 1

Over the 1979-2019 period, net productivity (row 7) grew 1.36% annually while median hourly compensation (row 2) grew just 0.38% annually, a sizeable divergence (row 8) of 0.99% each year. Panel B provides the annual impact of each of the three wedges (rounded to two decimals, with all calculations made using entire values) and the bottom panel shows the share of the net productivity-median hourly compensation growth gap that can be accounted for by each wedge.

The most important finding is that the gap between the growth of net productivity and median hourly compensation was primarily driven by factors associated with growing inequality—the decline of labor's share (especially since 2000) and the growing inequality of compensation, as shown in rows 9 and 10. These inequality factors together can explain 81.0% of the growth of the productivity–median hourly compensation gap (row 14) over the entire 1979-2019 period, with the remaining portion due to difference in the growth of producer (used to measure productivity) and consumer (used to measure compensation) prices (row 15). In the most recent period, from 2000 to 2019, the inequality factors together can explain 92.0% of the productivity-pay divergence (44.5% due to rising compensation inequality and 47.5% from the erosion of labor's share) and the difference in deflators was much less important (only 8.0%).

There is some controversy about whether the consumer–output price divergences should be included in analyses of the productivity-pay divergence. In this analysis we consciously sidestep this issue below by examining both net productivity and median hourly compensation adjusted for inflation by consumer prices (CPI-U-RS index) so their gap only captures the two inequality wedges. We label net productivity deflated by consumer prices as "net effective productivity" to indicate that its growth is readily available for consumption. That said, we are agnostic whether the output–consumer price divergences are simply a technical matter or reflect non-technical matters of political economy. There has not been serious research into what has caused these price divergences in the various subperiods presented in Table 1. In that regard, it is curious to us that rapid improvements in information equipment investment productivity, resulting in rapidly falling prices, have not seemed to flow through to consumers.

The net effective productivity–median hourly compensation divergence, exclusive of the price deflator differences, reflects the rising inequalities. Over 1979-2019, as noted earlier, net productivity grew 59.7% while median hourly compensation grew 15.8%, a 43.9 percentage point divergence. Net productivity, in other words, grew more than 3.5 times as fast as median hourly compensation. The compensation of the median worker would have risen 0.80 percentage points faster each year (summing rows 9 and 10) had median compensation not lagged net effective productivity. As shown in Figure C below, this resulted in a $9.00 loss in compensation for the median worker.

Figure C illustrates the increased net effective productivity–median hourly divergence in inflation-adjusted ($2019) dollars over the 1979-2019 period where both net effective productivity and median hourly compensation are inflation-adjusted with consumer prices (eliminating the consumer versus output price wedge). Median hourly compensation rose from $20.46 in 1979 to $23.72 in 2019, up 15.8%. However, if median hourly compensation had grown at the 59.7% pace of net effective productivity, then median hourly compensation would have reached $32.71, $9.00 higher than what was actually attained. In other words, rising inequality of compensation and the erosion of labor's income share over the 1979-2019 period cost the median worker $9.00 an hour.

Figure C
Figure C

The decline in labor's share of income

One of the trends that alerted analysts to the erosion of worker bargaining power and the corresponding strengthening of employer bargaining power in recent years is the erosion of labor's share of income in the 2000s (as shown in Table 1). These metrics reflect the shift in income shares for the whole economy, including the government and nonprofit sectors which have no profits. The distributional conflict between workers (labor) and employers (capital) is best examined in the corporate sector, where all income is divided between compensation going to workers and income accruing to owners of capital. Focusing on the corporate sector hence avoids issues of having to decide whether some other form of income—"proprietor's income," or income of noncorporate businesses—is labor or capital (see Bivens 2019 for measurement details) or the influence of trends in sectors which have no profits.

EPI's Nominal Wage Tracker provides data on the "workers' share of corporate income." The data clearly show a decline in labor's share in the 2000s. For example, labor's share fell from 82.4% in 2000 to 77.9% in 2007, the last year before the Great Recession. By 2016, when unemployment had reached levels comparable to what had prevailed in 2006 and 2007, it remained roughly 2.5 percentage points below its 2007 level, equivalent to an 8.4% across-the-board cut in compensation for every employee. Equivalently, it would require an across-the-board compensation boost of 9.1% to restore labor's share to its 2000 level.

This computation may exaggerate the impact of labor's falling share, since 2000 was a near historic high because of the lowest unemployment rate in decades (4.0%). However, the unemployment rate in 2018 and 2019 also averaged below 4.0%, and labor's share ended 2019 at 77.3%, well below 2000's level. This shift toward greater capital income and returns is even more impressive given that real interest rates have fallen sharply in recent years, a development that should (all else equal) be accompanied by a lower return to capital (Farhi and Gourio 2018).

Conclusion

In the 40 years since 1979, the net productivity growth vastly exceeded the growth of compensation for the median or typical worker. This was not the case in the 1948-1973 period. This productivity-pay divergence has been primarily driven by rising inequality, both the top 10% and especially the top 1% gained a much larger share of all compensation and labor's share of income eroded since 2000. In other words, the factors driving inequalities in the labor market are responsible for workers' inability to make gains commensurate with productivity growth.

Whether workers make wage gains commensurate with future productivity growth will depend on whether we prevent this ongoing, and eminently preventable, growth in wage inequality. These inequalities, in turn, are the consequence of conscious policy decisions made on behalf of the rich and corporations, as documented in Mishel and Bivens (2021), such as failing to achieve full employment, weakening unions, reducing labor standards, pursuing corporate globalization, employers imposing contract terms (such as noncompete agreements), and large firms using domestic outsourcing to redistribute wages and profits up from the supply chain. Public policies which restore worker power and balance in the labor market can provide robust, widely shared wage growth. What is broken is politics and policy, not the economy itself.

This work has benefitted from a long-term collaboration with EPI director of research Josh Bivens and data computations by EPI research assistant Jori Kandra.


 -- via my feedly newsfeed

Thursday, September 2, 2021

China plans to bolster transport link with ASEAN, BRI countries and regions [feedly]

China plans to bolster transport link with ASEAN, BRI countries and regions
https://www.globaltimes.cn/page/202109/1233147.shtml

China's top economic planner said on Thursday that the country aims to finish building the New International Land-Sea Trade Corridor by 2025, a logistics channel that would facilitate trade with ASEAN members as well as countries and regions along the China-proposed Belt and Road Initiative (BRI).

In a document issued on Thursday, the National Development and Reform Commission (NDRC) said the corridor would be efficient, convenient, green and safe. The move is crucial as such a massive transport link has become increasingly significant since the coronavirus disrupted global supply chains and the movement of trade.

The plan covers major road, railway and port projects. Specifically, it aims to increase the capacity of rail-sea combined transport to 500,000 twenty-foot equivalent units and the number of cross-border freight trains to 2,000.

In 2020, 4,607 trains of the rail-sea combined transport mode and 1,264 China-Vietnam cross-border freight trains were dispatched, up 105 percent and 23.2 percent year-on-year.

Beibu Gulf Port in South China's Guangxi Zhuang Autonomous Region has opened 52 shipping routes and the Yangpu Port in South China's Hainan Province has opened 33 routes, reaching more than 100 countries and regions.

The strategy of building the New International Land-Sea Trade Corridor is closely linked to the BRI, the Yangtze River Economic Belt and the Guangdong-Hong Kong-Macao Greater Bay Area, Zhou Xiaoqi, an official with the NDRC, told a press conference on Thursday.

"In addition, once goods can go from Southwest China to the southern part or the Yangtze River direction, the corridor could reduce the navigation capacity burden of the Three Gorges Dam and provide more options for shipping goods," Zhou said.

In terms of facilitating inspection and quarantine at customs, an official with the customs authority said that after negotiating with ASEAN members, China has established a digital review mechanism for seafood imports from Vietnam and fruit imports from Thailand faster and more conveniently.

 -- via my feedly newsfeed