Monday, November 26, 2018

Mark Thoma's Economic Links (11/25/18) [feedly]

Class Prejudice and the Democrats’ Blue Wave? [feedly]

I agree with Jack Metzgar here, as far as he goes. If you dont reverse inequality trends, nothing, either money or values, will get improved an iota. 

But this can't become, as it often does on the Left,  a cover for the slippery slope of thinking all "the Clinton Democrats", or liberal billionaires and professionals for that matter, are not needed to defeat Trump. Or worse, the trip into fantasy where only "anti-capitalism" can save us so no other majority is important.

For the most part, Bernie has pursued, and demonstrated, a good balance of both vision and pragmatism on behalf of working families. But his way is not the only way. With the plethora of new progressive candidacies rising for 2020 already, other approaches will be tested as well.

Class Prejudice and the Democrats' Blue Wave?
https://workingclassstudies.wordpress.com/2018/11/26/class-prejudice-and-the-democrats-blue-wave/

Two days after the mid-term elections, The Washington Post published an analysis under the headline "These wealthy neighborhoods delivered Democrats the House majority."  That headline is false in several different ways, but it is being repeated among a large group of the punditry because it fits into a class narrative that sees affluent, college-educated white people who live in suburbs as citadels of tolerant decency while white folks without bachelor's degrees, wherever they live, are wall-to-wall racist and sexist xenophobes.

There is some evidence for that narrative, as whites without bachelor's degrees (who in electoral analyses are called "the white working class") are among President Trump's strongest supporters.  According to nationally aggregated exit polls, they voted for Trump by 37 points in 2016 and for GOP House candidates by 24 points in 2018.  In contrast, "educated whites" gave Trump only a 3-point advantage in 2016 and then flipped to Democratic candidates by 8 points in 2018.

A significant section of the punditry, including many Clinton Democrats, have latched on to this phenomenon to argue that the whole ballgame for the Dems, in 2018's blue wave and for 2020, is about winning traditionally Republican suburbs while ignoring what's left of their traditional base in the white part of the working class.  An important political shift is happening in suburbs, where half of all voters live,  but it is only one part of what generated the blue wave, and these suburbs are much more diverse and complicated places than the punditry allows.

The Washington Post analysis, for example, focused on six suburban districts outside Minneapolis, Los Angeles, Atlanta, Dallas, Richmond, and Washington, D.C., which voted for Hillary Clinton in 2016 while also sending Republicans to the House of Representatives.  All six, along with similar traditionally Republican suburban districts, flipped to Dems earlier this month.  These kinds of districts definitely played an important role in Democrats winning the House, and we should celebrate every country-club Republican who is outraged by Trump's nationalist mendacity, racist dog whistles, old-fashioned male supremacy, or just plain crudeness.  But these districts are much more complicated than the "wealthy neighborhoods" contained within them, and most importantly, they are only one part of how the Democrats won the House.

Flips within the so-called white working class are proportionately more important.  First, while the GOP won among the white working class this year by 24 points, that is a substantial shift away from the 37-point advantage they gave Trump in 2016.  And because this group of whites represents 41% of all voters, compared with college-educated whites who make up only 31%, that 13-point shift produced some 6 million additional votes for Dem candidates versus the 4 million produced by the 11-point gain Dems achieved among the white middle class.  So unlike the widely cited pre-election prediction by Ronald Brownstein that the Dems' blue wave would be an exclusively suburban tsunami, shifts toward the Dems among "poorly educated" whites were of greater importance than the shift in the metro suburbs.  In the exit polls, "non-whites," including Blacks, Latinos, Asians, and Others, were about 29% of voters and gave Dems an overwhelming 54-point advantage – both numbers just 1-point higher than in 2016.  As the core of the Democratic base, people of color provide the foundation for any Democratic victory, but the shifts among both kinds of whites in 2018 account for the flip of the House.

Second, along with the dozen or so suburban districts they flipped, Dems also flipped at least 14 House districts that cannot be characterized as "suburban," let alone "wealthy."  Nate Silver highlighted many of these as "Obama-Trump" districts because they went for Obama in 2012 and Trump in 2016.  There were 21 such districts, mostly in Rust Belt states where there are large proportions of white working-class voters – including 6 in New York, 3 each in Iowa and Minnesota, 2 each in Illinois and New Jersey, and one each in Pennsylvania and Wisconsin.  Democrats won 14 of them, and that is at least as important as the "wealthy suburban districts" D.C. pundits continue to focus on.

What's more, even in the traditional Republican suburban districts The Post chose to highlight, wealthy voters were not obviously more flippy than middle-income voters in those districts; those with household incomes in the $50-75k range also "surged" for Dems in comparison to their Republican pasts.  Two-thirds of suburban residents do not have bachelor's degrees, and the largest group is middle income, not affluent, let alone "wealthy."  Much of this is apparent from the data The Post authors report and display in various graphics, but they consistently emphasize the role of "the wealthy," whom they apparently define as households with more than $100k in annual incomes.  According to their own graphic, of the 29 House seats that had flipped to Dems by the time they were writing, only three came from what they define as "wealthy" districts.  What's more, in the nationally aggregated polls, Democrats failed to gain House votes versus the 2016 Trump vote in only one income category – those with household incomes of more than $100k. The Post analysis is correct in saying that "suburban neighborhoods . . . are trending increasingly left," but they are wrong to assume that suburbs are uniformly affluent and college educated (or white).

Worse, their analysis tells only one half of the story of the Dems' 2018 blue wave, and the smaller half at that.  The 13-point shift away from Republicans by working-class whites is important even if it did not produce a majority for Dems nationwide.  The difference between Clinton winning about 30% of that group in 2016 and Obama winning 40% of it in 2008 and 2012 is the difference between Democrats holding power or not.

The exclusive focus on suburbs as if they are wall-to-wall white middle-class professionals, which the influential Ron Brownstein continues to champion post-election, supports a Democratic political strategy that wants to run against Trump's offensive style and values rather than on a substantive economic-justice program that could move toward renewing the kind of multi-racial, cross-class coalition that was such an important part of the Democrats' 2008 sweep of executive and legislative power.  In my view, that would be a horrendous strategic mistake.  But worse, and not unrelated, it continues a moral narrative, common among many Clinton Democrats, that implicitly and often very explicitly values people with bachelor's degrees over those without.  That attitude, as much as any strategic choice, adds toxicity to our already toxic Trumpian environment.

Jack Metzgar


 -- via my feedly newsfeed

We Need To Strengthen The Public In The US Public Sector [feedly]

great charts proving the trends...

We Need To Strengthen The Public In The US Public Sector
https://economicfront.wordpress.com/2018/11/24/we-need-to-strengthen-the-public-in-the-us-public-sector/

Many people have given up on the idea of government as an instrument of progressive social change, especially the federal government.  They think that the federal government is dominating and distorting economic activity and, more often than not, believe that the cause is a bloated, highly paid, and selfish federal workforce.

In fact, federal programs are increasingly being delivered by private contractors.  As a result, private employees doing work for the federal government now outnumber the federal workforce.  Moreover, in most cases, they are paid far more than the public employees they replace.  And, as more federal work is carried out under the direction of profit-seeking firms, there is good reason to believe that programs are reshaped to ensure that it is the private rather than public interest that is best served.

The declining share of federal workers

As a Public Goods Post explains:

the federal government workforce has not increased in absolute numbers in half a century. Not only is it the same size now as it was in the 1960s, since the 1980s it has shrunk. There are actually fewer government employees now than there were under Reagan even though the population has grown by over 30%.

As a consequence, as we see below, the size of the federal workforce as a share of the total civilian non-farm workforce has steadily fallen.  It is now less than 2 percent of the total.

The growth in private contractors

While the size of federal workforce has remained relatively unchanged for decades, the same is not true for real federal government spending on consumption and investment, as seen in the figure below.

So, how has the federal government been able to boost its activity with a relatively unchanged workforce?  The answer is an explosion in the use of private contractors.

According to the Public Goods Post,

the federal contractor workforce dwarfs the federal employee workforce nearly four-fold.

This massive third-party workforce has been mostly hidden from public view, kept intentionally out of sight by corporations and their lobbyists who have the most to gain, as well as by elected officials who want to claim that they are not growing government. Moreover, federal corporate contractors operate behind a shield of secrecy, enabled by their de facto exemption from the Freedom of Information Act (FOIA), and ensuring that they can operate without public scrutiny.

Fattening the corporate sector at public expense

This outsourcing of federal activities to private firms is likely an important reason for people's dissatisfaction with government: they are far more expensive and their goal is profit not service.

A Project on Government Oversight study examined compensation paid to federal and private sector employees, as well as annual billing rates for contractor employees across 35 occupational classifications covering over 550 service activities.

It found, among other things, that:

Federal government employees were less expensive than contractors in 33 of the 35 occupational classifications reviewed.

Private sector compensation was lower than contractor billing rates in all 35 occupational classifications we reviewed.

The federal government approves service contract billing rates—deemed fair and reasonable—that pay contractors 1.83 times more than the government pays federal employees in total compensation, and more than 2 times the total compensation paid in the private sector for comparable services.

Here are some examples of the compensation bias favoring private contractors:

As bad as it is, this compensation bias is far from the whole story.  The fact is that public regulators incur significant costs trying to develop contracts that are supposed to ensure acceptable private contractor outcomes as well as actually monitoring performance.  And shortfalls in performance, an all too frequent outcome, require either additional federal expenditures beyond those initially stipulated in the contract or a lowering of public standards.

Moreover, a recent review of "the extensive global empirical evidence on the relative efficiency of the private versus public sectors" found no evidence:

that there is any systematic difference in efficiency between public and private sector companies, either in services which are subject to outsourcing, such as waste management, or in sectors privatized by sale, such as telecoms. . . .

This picture is further confirmed by examination of nine sectors which are most often subject to privatization, outsourcing and PPPs – buses, electricity, healthcare, ports, prisons, rail, telecoms, waste management and water – and the same results hold true in each sector: the evidence does not show any superior efficiency by private companies.

The challenge ahead

A report summarizing the discussions and outcomes of an October 2017 conference titled "Restoring Public Control of Public Goods" began as follows:

Over the past thirty-five years, government in the United States has been vilified and vitiated through a movement designed to de-legitimize government in the eyes of the public, to reduce government's capacity to operate, and to replace that capacity with private contractors and other forms of privatization. . . .

We now are left with:

  • An increasingly hollowed-out, de-moralized, de-professionalized, and devalued government;
  • A hidden and growing "shadow government" of corporate contractors;
  • An array of expensive false economies–since, in fact, contracting out regularly costs taxpayers more than direct government provision of services;
  • Public goods that are so invisible as to be under-valued, and are therefore underfunded or struck from the budget;
  • Counter-productive systems of performance measurement that create further harmful (if sometimes unintended) consequences;
  • A citizenry that under-appreciates, or are unaware, of the public goods they receive.

The private sector has been quietly and efficiently winning its war to control and profit from public sector activities.  One can only hope that the recent interest in socialism will encourage a renewed popular commitment to work with public sector workers to resist this war on the public and build a new, more accountable, not to mentioned well-financed, public sector.


 -- via my feedly newsfeed

Catastrophe Bonds: A Primer [feedly]

An intro to how insurance companies plan to cover catastrophe's---its going to take more money

Catastrophe Bonds: A Primer
http://conversableeconomist.blogspot.com/2018/11/catastrophe-bonds-primer.html

Catastrophe Bonds: A Primer

Most bonds are a way for corporations and government to borrow money. A catastrophe bond is different. It's effectively a way for an insurance firm to re-insure some of the extreme risks it faces.
Andy Polacek offers a nice overview in "Catastrophe Bonds: A Primer and Retrospective," a recent 
Chicago Fed Letter (2018, No. 405).

Polacek offers a nice concrete example of how a CAT bond works. The American Family Mutual Insurance Company wanted to be reinsured if it experienced very high losses due to severe thunderstorms and tornadoes in the United States. Thus, in November 2010 it set up a "special purpose vehicle" called Mariah Re Ltd. to issue a CAT bond.

It worked like this. Investors in the CAT bond put up $100 million. That money was immediately invested in US Treasury securities. In addition, American Family Mutual Insurance Company agreed to pay the investors an additional return of 6.25% per year, over a three-year period. If there were no excessive losses from thunderstorms during those three years, the CAT bond would end, and the $100 million would be refunded to the original investors.

However, every CAT bond has built into it an "attachment point," which specifies when a certain large-scale event has occurred. It might refer to an earthquake of a certain size, or to a certain kind of storm causing at least a certain magnitude of losses. In the case of American Family Mutual Insurance Company and Mariah Re, the "attachment point" occurred "if estimated losses to the P&C insurance industry from severe thunderstorms and tornadoes across the U.S. exceeded $825 million ... After the $825 million attachment point was reached, AFMI would receive $1 in compensation for every $1 of additional covered losses up to the $100 million limit." A third party is designated in advance to decide if the "attachment point" has been reached: in this case, the third party was a company called AIR Worldwide.

This example helps to clarify the risk-sharing properties of a CAT bond. For the insurance company, issuing a CAT bond is a way of purchasing re-insurance against extreme losses. But it has some advantages over purchasing reinsurance. Because the money is sitting in an account, there is no danger that the reinsurance company might be unable to pay. Also, a CAT bond can be set up to cover a period of several years, while a reinsurance purchase is typically for one year. Finally, because lots of investors like pension funds, mutual funds, and hedge funds can buy CAT bonds, the pool of funds available for reinsurance becomes a lot larger than the available capital of reinsurance companies taken alone

For investors, a CAT bond offers a rate of return with a degree of risk, with the nice property that the occurrence of extreme insurance events is typically not much correlated with other risks in financial markets. In this particular case of American Family Mutual Insurance Company and Mariah Re, the US experienced a huge number of costly and deadly tornadoes in 2011, leading to insured losses of $954 million. This total was more than $100 million above the attachment point of $825 million, so that investors in this CAT bond lost all of the $100 million they had invested. But over time, the actual returns from investing in CAT bonds have been attractive.

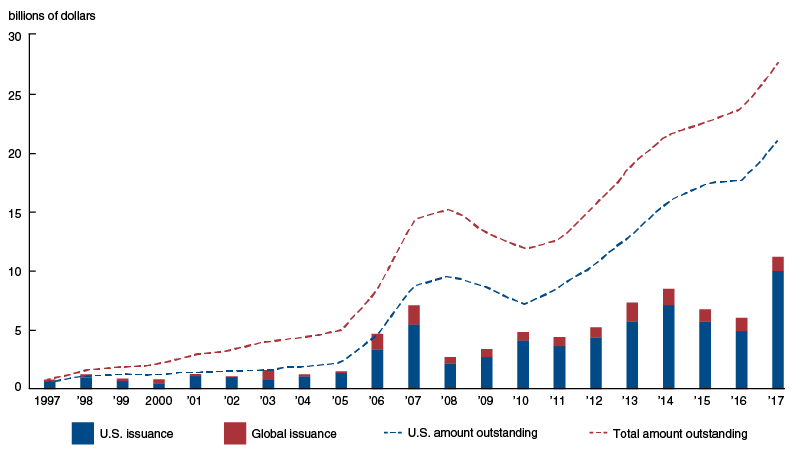
This figure shows the growth in total issuance of catastrophe bonds over time, now at about $25 billion worldwide.

Catastrophe bond issuance and amount outstanding, 1997-2017


One of the most interesting uses of CAT bonds is not by insurance or reinsurance companies, but by governments. Payouts from these CAT bonds often triggered by measures of the strength of the covered catastrophe—such as an earthquake's magnitude or a hurricane's wind speed and barometric pressure. As a result, it is typically quite clear when a trigger has been exceeded, and the fund to cover the catastrophe can be released very quickly, when they are needed. In the US, the California Earthquake Authority (CEA) and the Florida Hurricane Catastrophe Fund (FHCF) issue catastrophe bonds. "The Caribbean Catastrophe Risk Insurance Facility (CCRIF)—developed with the assistance of the World Bank—has used CAT bonds ... After Hurricane Matthew struck the Caribbean in the fall of 2016, the CCRIF paid out a little over $20 million to Haiti and almost $1 million to Barbados within 14 days after the triggering event."

A common concern about any new financial instrument is that it will work until investors take substantial and losses, and then it may fade away. Thus, it is a good sign for the fundamental health of catastrophe bonds as a useful financial innovation that even after experiencing very large losses for investors in 2017, it kept growing in 2018. Polacek writes:
"In the first half of 2018, the CAT bond market saw strong growth even after unequivocally the worst period for CAT bond investors in the market's 20-year history. Led primarily by losses from Hurricanes Irma, Harvey, and Maria, 19 separate CAT bond tranches were triggered in the third quarter of 2017, leaving as much as $1.4 billion in outstanding issuance vulnerable to losses (the actual loss amount is not yet known given that many insurance claims still need to be resolved). Despite the historic level of losses at the end of 2017, new CAT bond issuance in the first half of 2018 reached $9.4 billion, rivaling 2017's record start.20 Currently, the insurance industry is working to improve CAT bond modeling to cover new types of risk—such as cyberattack and terror risks. So, it appears that the uses of CAT bonds will continue to grow, offering issuers new avenues to transfer a variety of risks."
For a previous post on CAT bonds, see "The Allure of Catastrophe Bonds"(August 25, 2016).

 -- via my feedly newsfeed

Sunday, November 25, 2018

How Democrats Can Deliver on Health Care [feedly]

Paul Krugman has become a major cultural enterprise with online classes, and projects in many areas all leveraging his deep understanding of economics, his position as columnist for the NY Times, as well as the Nobel prize and other awards, to advance progressive agendas and related ideological ideological debates in the social sciences.

But sometimes he reminds me of an elderly but still game hunter cat that purrs with precision in daylight but brings the trophies home overnight.

How Democrats Can Deliver on Health Care
https://www.nytimes.com/2018/11/22/opinion/democrats-obamacare-states.html


"Democrats need to have a positive agenda, not just be against Donald Trump." How many times did you hear pundits say something like that during the midterm campaigns? In fact, you're still hearing it from people like Seth Moulton, who's leading the (apparently failing) effort to block Nancy Pelosi from returning as House speaker.

What makes this lazy accusation so annoying is that it's demonstrably, arithmetically wrong. Yes, Trump was on everyone's mind, but he was remarkably absent from Democratic messaging. A tally by the Wesleyan Media Project found that the 2018 elections stand out not for how much Democrats talked about the tweeter in chief, but for how little: Not since 2002 has an opposition party run so few ads attacking the occupant of the White House.

So what did the campaigns that led to a blue wave talk about? Above all, health care, which featured in more than half of Democrats' ads. Which raises the question: Now that Democrats have had their big House victory and a lot of success in state-level races, can they do anything to deliver on their key campaign issue?

Yes, they can.

Actually, just by capturing the House Democrats achieved one big goal — taking repeal of the Affordable Care Act off the table. True, the G.O.P. lawsuit against the act's protection of pre-existing conditions is still awaiting a ruling — the long silence of the Republican-leaning judge in that case is getting increasingly strange. But there won't be any more legislative attempts to dismantle the law.

ADVERTISEMENT

On the other hand, with Republicans still controlling the Senate and White House, major new federal legislation on health care isn't going to happen. Democrats may debate about their future agenda, which seems likely to include offering some form of Medicare buy-in option for Americans under 65. And it's important that they have this debate: One reason they were able to achieve major health reform in 2009-2010 was that, unlike 2017 Republicans, who had put no thought into the actual implications of repeal, they had hashed out key issues over the previous two years. But for now, at least, Washington will be gridlocked (which is better than where we were!).

There can, however, be action at the state level.

The A.C.A. didn't, strictly speaking, create a national program. Instead, it set rules and provided financing for 50 state-level programs. States were encouraged to create their own health insurance marketplaces, although they had the option to use healthcare.gov, the federal site. A 2012 Supreme Court decision also let states opt out of Medicaid expansion, and many did choose to refuse federal dollars and deprive their own residents of health care.

This has created a divergence in health care destinies, depending on states' political orientation. In 2013, before the A.C.A. went into effect, California had an above-average rate of uninsurance: 17.2 percent of its population was uncovered. North Carolina did somewhat better, with "only" 15.6 percent uninsured. But as of last year, the uninsured rate in California had fallen 10 points, to 7.2 percent, while North Carolina's rate was still above 10 percent.

What made the difference? Solid-blue California, with a Democratic governor and Legislature, did all it could to make Obamacare work: It expanded Medicaid, operated its own marketplace and made major efforts to get people signed up. North Carolina, under Republican rule, did none of these things.

And the importance of state-level action has only increased in the past two years, as the Trump administration and its congressional allies, unable to fully repeal the A.C.A., have nonetheless done all they can to sabotage it. They eliminated the individual mandate, which pushed people to sign up while they were still healthy; they eliminated reinsurance that helped insurance companies manage their own risk; they cut back drastically on outreach.


ADVERTISEMENT

All of these measures acted to drive premiums up and enrollment down. But states can, if they choose, fill the Trump-size hole.

The most dramatic example of how this can be done is New Jersey, where Democrats gained full control at the end of 2017 and promptly created state-level versions of both the mandate and reinsurance. The results were impressive: New Jersey's premiums for 2019 are 9.3 percent lower than for 2018, and are now well below the national average. Undoing Trumpian sabotage seems to have saved the average buyer around $1,500 a year.

Now that Democrats have won control of multiple states, they can and should emulate New Jersey's example, and move beyond it if they can. Why not, for example, introduce state-level public options — actuarially sound government plans — as alternatives to private insurance?

The point is that while the new House majority won't be able to do much beyond defending Obamacare, at least for now, its allies in the states can do much more, and in the process deliver on the agenda the whole party ran on this year. As they say in New Jersey, you got a problem with that?

Follow The New York Times Opinion section on Facebook, Twitter (@NYTopinion)and Instagram, and sign up for the Opinion Today newsletter.


Paul Krugman has been an Opinion columnist since 2000 and is also a Distinguished Professor at the City University of New York Graduate Center. He won the 2008 Nobel Memorial Prize in Economic Sciences for his work on international trade and economic geography. @PaulKrugman


 -- via my feedly newsfeed

DealBook Special: China Means Business [feedly]

Important summary of China development series in NYT

DealBook Special: China Means Business
https://www.nytimes.com/2018/11/25/business/dealbook/china-economy-business.html

 -- via my feedly newsfeed

Grim Stock Signals Piling Up as Wall Street Mulls Recession Odds [feedly]

Grim Stock Signals Piling Up as Wall Street Mulls Recession Odds
https://www.bloomberg.com/news/articles/2018-11-25/grim-stock-signals-piling-up-as-wall-street-mulls-recession-odds

Nine turbulent weeks and a correction in U.S. stocks have left analysts with a thorny question. What's the market saying about the economy?

And while few see incontrovertible signs investors are bracing for a recession, it's a word that's been coming up more as they seek a signal in the chaos.

From the ascent of defensive industries to the sudden craze for companies that resist volatility, stocks are acting in ways that have presaged slowing growth in the past. That makes sense: gains in the economy and corporate earnings are forecast to ease in 2019 from this year's torrid pace.

Befitting that, most of the charts that follow reflect observations by analysts who don't see a recession as the most obvious conclusion. Many view the sell-off as healthy after a 10-year run of gains. But with a trade war flaring and the Federal Reserve set to boost interest rates again, the number of stock researchers who are at least willing to mention the possibility is rising.

"What's driving the sell-off? The idea that the market sees something that we don't," said Bruce McCain, chief investment strategist at KeyBank. "That global growth and the global economy are much weaker than you would've thought otherwise reinforces concern that there aren't too many places to hide."

Momentum Scare

It doesn't take a degree in technical analysis to be concerned. More than $3 trillion has been lopped from U.S. equity values since late September, a sell-off that has driven the S&P 500 down 10 percent and tech stocks well past the threshold for a correction.

To see how violent it's been, look at the number of stocks where this year's once-robust price momentum has come asunder -- those trading below their 200-day average. Support is wearing thin, with just 37 percent of S&P 500 companies exceeding their long-term moving mean.

At the same time, the chart is an illustration of how it can be a mistake to take markets too seriously when looking for clues about the economy. While the preponderance of stalled stocks is high by historical standards, it does have a recent precedent: 2016. No recession followed that signal.

None is coming now, either, according to the people who are paid to anticipate such things. Odds the U.S. will fall into a recession in the next year stands at 15 percent, according to Bloomberg's U.S. Recession Probability Forecast index. While they see the economy losing a bit of speed next year and in 2020, the median estimate of economists calls for 2.6 percent economic growth in the next 12 months.

Economists haven't always done a great job predicting contractions. A 2014 study by the International Monetary Fund's Prakash Loungani found that not one of 49 recessions suffered around the world in 2009 had been predicted by the consensus of economists a year earlier. Loungani previously reported that only two of the 60 recessions of the 1990s had been anticipated a year in advance.

One way or the other, investors are acting worried. They're rotating into defensive sectors that do better when the economy is in trouble. Utilities, the only sector that's risen since September, had trailed the broader market in nine consecutive quarters.

Some investors seek shelter from market turmoil in stocks with muted price swings as opposed to their riskier brethren. Tranquil equities offer little alpha when things are good, but are supposed to shine during times of uncertainty. Those with risk aversion have piled into the Invesco S&P Low Volatility ETF and the fund has beaten the S&P since the market rout started in late September.

The performance gap between defensive and cyclical stocks suggests that investors are starting to price in a recession-like scenario, JPMorgan strategists led by Dubravko Lakos-Bujas said in a note this week. They view the dislocation as overdone and inconsistent with the fundamental backdrop.

Societe Generale's strategists including Roland Kaloyan evoked the R word within one of the more depressing stock outlooks to be issued lately. They see the S&P closing next year at 2,400, an 18 percent decline from its September record. Still, even in their skeptical eyes, the threat of a contraction is a long way off: early to mid-2020.

Equities still yield more than 10-year Treasuries, but are far from being the most-loved asset class. A recent survey by the National Association of Active Investment Managers shows that mutual funds' equity exposure has fallen to 30.5 percent, the least since 2016. It isn't helping much -- practically everything is falling. Treasuries, raw materials and corporate bonds are all down for the year.

Where'd You Go?

Equity exposure reaches the lowest level since 2016 amid a 10% S&P drop

Source: National Association of Active Investment Managers

"Both equities and commodities are reflecting some of the fears of a global growth slowdown, so you're not seeing positive returns at all," said Chris Zaccarelli, chief investment officer at the Independent Advisor Alliance. "Meanwhile the Federal Reserve is raising interest rates for the next six months, if not longer, which is also causing fixed income to go down. Global slowdowns are weighing on credit. And that's giving investors no place to hide."

To be sure, the economic indicators that often precede recession -- yield curve inversion and rising unemployment -- are not flashing warning signs. The yield curve is flat but not inverted and the unemployment rate keeps falling, as opposed to rising when a recession approaches.

— With assistance by Lu Wang


 -- via my feedly newsfeed