Wednesday, October 17, 2018

Bernstein: What’s wrong with upside-down Keynesianism? [feedly]

What's wrong with upside-down Keynesianism?
http://jaredbernsteinblog.com/whats-wrong-with-upside-down-keynesianism/

ntroduction

I've got a piece in today's WaPo focusing on how the tax cuts have broken an important, fiscal linkage between budget deficits and the strength of the economy.

"When we close on full economic capacity, as is currently the case, tax revenues as a share of the economy should significantly rise, and deficits should fall. Instead, revenues have come way down, and deficits have climbed.

Why is the deficit 17 percent higher than last year, especially when the economy is growing faster, and unemployment is lower?

It's primarily because the tax cuts have significantly reduced the amount of federal tax revenue the economy will spin off for any given growth rate. Increased spending also played a role but not as large a one as the tax cuts…

Consider these numbers. Using data back to the mid-1940s, I calculated the average deficit as a share of GDP over every year since the late 1940s that the unemployment rate was lower than or equal to 4.5 percent (it's currently 3.7 percent). That average is -0.4 percent, as opposed to the -3.9 percent noted above for 2018. By the way, if I take this and last year's deficit (-3.5 percent) out of that average, the result is a small surplus (0.1 percent).

This figure below shows this heretofore tight correlation between deficit and unemployment rate. To make the relationship easier to see, I've inverted the unemployment rate, so e.g., 4 becomes -4. When the economy tightened up, deficits used to come down. But the circled area at the end of the figure shows that under today's fiscal policy that is no longer the case."

You can see, in the circled part at the end of the figure, that the two lines were tracking each other as usual (meaning the economy was strengthening and the deficit was falling) but changed course in just the past few years. My WaPo piece gets into some details of how this relates to the tax cuts/spending increases and what should be done to rejoin the lines.

But this piece is on the economics and political economy of what's going on in that circle at the end of the figure, what one might call "upside-down Keynesianism," (UDK) or stimulating an economy that's already closing in on full employment.

Before I get into the analysis, however, in case there's anyone here unfamiliar with my rants of last year, I should clarify that this conversation abstracts from the fact that the Republican tax cut is a regressive, wasteful mess of tax complexity that is already exacerbating income and wealth inequality while opening up new loopholes that will promote tax avoidance and evasion until it is reversed. But this post isn't about that. It's about the macroeconomics of stimulating an already strong economy, not the composition of the stimulus.

What are the upsides and downsides of UDK?

The most obvious upside of UDK in the current economy is the extent to which the stimulus—deficit spending on tax cuts and spending programs—is pushing the economy closer to full capacity than would otherwise have occurred. In fact, there is both theoretical and empirical support for this upside.

First, "secular stagnation" argues that structural factors—inequality, aging demographics, persistent trade deficits—prevent the U.S. (and other advanced economies) from achieving truly full employment absent a push from "non-market" sources, such as fiscal stimulus or accommodative monetary policy.

The other theoretical support for UDK's upsides is that economists must admit that we do not know our stars (u*, y*, r*)—the economy's capacity indicators (the lowest unemployment rate consistent with stable prices, the level of potential GDP, the neutral interest rate)—within a policy-relevant confidence interval, and we've generally erred on the side of caution.

Therefore, stimulus at alleged full employment can help achieve actual full employment. In fact, the next figure shows that as actual unemployment has fallen well below the Fed's estimates of u*, inflation is just now, after years of downside misses, hitting their 2 percent target (FWIW, I recently wrote up a related analysis which argues that their u* is about right; it's just that inflation is really well anchored; as far as UDK is concerned, the upside is the same).

Empirically, even if we accept that standard estimates of u* (e.g.) are not too high, actual unemployment has been above the CBO's u* for two-thirds of the quarters since 1980. In other words, the U.S. labor market has been slack far more often than not, a huge market failure, a significant factor in weakening worker bargaining power over these years, and a strong case for pushing beyond conventional measures of full employment.

The most obvious downside of UDK is overheating. Though the inflation line in the previous figure shows little evidence of such pressures so far, these dynamics can be non-linear, as long-dormant correlations can reawaken at high capacity levels. In their new World Outlook chapter assessing current risks, the IMF worries that since "the US economy [is] already operating above potential, expansionary fiscal policy could lead to an inflation surprise, which may trigger a faster-than-currently anticipated rise in US interest rates, a tightening of global financial conditions, and further US dollar appreciation, with potentially negative spillovers for the global economy."

The IMF are worrywarts about such developments, but economist Dean Baker, with whom I frequently collaborate on ways to gin up more demand, is clearly not. Yet, even he recently said that "…we are likely getting close to full employment, so we probably don't want too much larger of a deficit."

But there's a less obvious downside to UDK, one I raised in the WaPo piece and the one which concerns me most. Remember, Keynesian interventions are temporary injections of deficit spending to get over a negative, macro shock. But the tax cuts are intended to permanently damage our revenue-base, and as such, they are merely the latest installment of the Republicans' longer-term agenda to never raise, but always cut, federal taxes. As I argued in the WaPo, the dangers to this low-revenue path strike me as acute and threatening in real time:

"Based on our aging demographics alone, we've long known that we will need more revenue over the next decade, not less. Add in geopolitical threats, climate change and the damage from increasingly intense storms (which is tied to the warmer climate), infrastructure, the need to push back on poverty and inequality, counter-cyclical fiscal policy that will be needed for the next downturn, and, it's not hard to understand why a rising deficit at full economic capacity is so ill-advised. That is, unless you're being paid not to understand these fiscal realities."

In this regard, one of the biggest threats from the tax cuts that must be considered, even in the context of UDK, is the role it plays in emptying the Treasury's coffers so that Republicans can point to all that debt as a rationale for cutting social insurance and safety net programs.

Keynes v. Laffer

In this regard, UDK may be a misnomer, as Keynesian stimulus is by definition temporary and, though they made some of the their tax cuts temporary for budget scoring purposes, the advocates of the cuts want them to be permanent. And yet, if you look at any credible economic projection, you find that a Keynesian dynamic in the forecasts: as fiscal stimulus fades in late 2019, as shown in the next figure, GDP growth slows. This expected reversal in fiscal impulse give rise to forecasts like that of the Fed which has real GDP up 3, 2.5, and 2 percent, 2018-20.

Source: GS Research

Advocates of the tax cuts, however, view this forecast as wrong, as it discounts Laffer effects, wherein the cuts allegedly pump up supply-side variables—capital investment, productivity, labor supply—such that GDP moves to a permanently higher growth path (roughly 3 percent as opposed to 2 percent).

In other words, barring another round of significant deficit spending, which, ftr, I would not rule out, in a few quarters we'll have a real-time, cage-match of Keynes v. Laffer.

If GDP slows from its current underlying, short-term trend of around 3 percent to its pre-tax-cut trend closer to 2 percent, as the forecasts predict, Laffer loses…again. To be clear, as the WaPo piece argues, he and his disciples have already lost on the assertion that tax cuts pay for themselves, but that was never even remotely believable.

There is, however, a wild card in play here, one I've written about under the rubric of the FEPM: the full employment productivity multiplier. This idea, for which there's suggestive evidence, is that in slack economies, firms can maintain profitability without being particularly efficient. At chock full employment, and especially with anchored inflation expectations, rising labor costs are a disciplining mechanism, enforcing the discovery of efficiency gains if firms are to maintain profit margins. These dynamics can also drive more capital investment that would not have been "necessary" in slack labor markets.

Thus far we haven't seen much to suggest the "sugar-high" forecasts are wrong. Business investment is up, but no more than you'd expect at this point in the recovery. Productivity growth is still too low.

Moreover, even if there is a productivity multiplier that gets tapped as we close in on full employment, it will be hard to assign victory to either side. In theory, Keynes wins again, as the capital investments in the FEPM model are not a function of the lower, after-tax cost of capital as much as a Keynesian accelerator story, where full-employment-driven job and wage gains fuel stronger consumer demand. In response to higher demand and the desire to maintain margins, firms ramp up their investment. But empirically, it will be hard to tell one story from the other.

In sum, and abstracting from the awful regressivity, complexity, and aspiration permanence of the tax cuts, UDK has clear upsides. I don't think the unemployment would be as low as it is without it. The almost-50-year low in the jobless rate is finally starting to generate wage gains that will reach those who have heretofore been left behind in this expansion, even in year nine.

It also invokes the risk of overheating. Yes, the Fed has lots of firepower to deal with that if need be, but the IMF could be right and we could end up with a hard versus a soft landing.

But at the end of the day, my biggest concern is less about UDK and more that we're not really talking about temporary stimulus. We're talking about a permanent reduction in revenues, sought by hard-right conservatives who have been gunning for social insurance programs forever, and thus view this current strategy as a twofer to both enrich their donors while starving the Treasury.


 -- via my feedly newsfeed

New ideas about new ideas: Paul Romer, Nobel laureate

New ideas about new ideas: Paul Romer, Nobel laureate

Chad Jones 11 October 2018


When Paul Romer began working on economic growth in the early 1980s, the conventional view among economists – for example, in the models taught in graduate school – was that productivity growth could not be influenced by anything in the rest of the economy. As in Solow (1956), economic growth was exogenous.

Romer developed endogenous growth theory, emphasising that technological change is the result of efforts by researchers, entrepreneurs and inventors who respond to economic incentives. Anything that affects their efforts – such as tax policy, basic research funding and education, for example – can potentially influence the long-run prospects of the economy. 

Romer's essential contribution is his clear understanding of the economics of ideas and how the discovery of new ideas lies at the heart of economic growth. His 1990 paper is a watershed. It stands as the most important paper in the growth literature since Solow's Nobel-recognised work. 

The history behind that paper is fascinating. Romer had been working on growth for around a decade. The words in his 1983 dissertation and in Romer (1986) grapple with the topic and suggest that knowledge and ideas are important to growth. And of course at some level, everyone knew that this must be true (and there is an earlier literature containing these words).

But what Romer didn't yet have – and what no research had yet fully appreciated – was the precise nature of how this statement comes to be true. By 1990, though, Romer had it, and it is truly beautiful. One piece of evidence that he at last understood growth deeply is that the first two sections of the 1990 paper are written very clearly, almost entirely in text and with the minimum required mathematics serving as the light switch that illuminates a previously dark room.

Here is the key insight: ideas – designs or blueprints for doing or making something – are different from nearly every other good in that they are non-rival. Standard goods in classical economics are rivalrous – as more people drive on a highway or require the skills of a particular surgeon or use water for irrigation, there's less of those goods to go around. This rivalry underlies the scarcity that is at the heart of most of economics and gives rise to the Fundamental Welfare Theorems of Economics. 

Ideas, in contrast, are non-rival – as more and more people use the Pythagorean theorem or the Java programming language or even the design of the latest iPhone, there is not less and less of the idea to go around. Ideas are not depleted by use, and it is technologically feasible for any number of people to use an idea simultaneously once it has been invented.

As an example, consider oral rehydration therapy, one of Romer's favourite examples. Until recently, millions of children died of diarrhoea in developing countries. Part of the problem is that parents, seeing a child with diarrhoea, would withdraw fluids. Dehydration would set in, and the child would die.

Oral rehydration therapy is an idea – dissolving a few minerals, salts and a little sugar in water in just the right proportions produces a life-saving solution that rehydrates children and saves their lives. Once this idea was discovered, it could be used to save any number of children every year – the idea (the chemical formula) does not become increasingly scarce as more people use it. 

How does the non-rivalry of ideas explain economic growth? The key is that non-rivalry gives rise to increasing returns to scale. The standard replication argument is a fundamental justification for constant returns to scale in production. If we wish to double the production of computers from a factory, one feasible way to do it is to build an equivalent factory across the street and populate it with equivalent workers, materials and so on. That is, we replicate the factory exactly. This means that production with rivalrous goods is, at least as a useful benchmark, a constant returns process.

What Romer stressed is that the non-rivalry of ideas is an integral part of this replication argument – firms do not need to reinvent the idea for a computer each time a new computer factory is built. Instead, the same idea – the detailed set of instructions for how to make a computer – can be used in the new factory or indeed in any number of factories, because it is non-rivalrous.

Since there are constant returns to scale in the rivalrous inputs (the factory, workers and materials), there are therefore increasing returns to the rivalrous inputs and ideas taken together – if you double the rivalrous inputs and the quality or quantity of the ideas, you will more than double total production. 

Once you've got increasing returns, growth follows naturally. Output per person then depends on the total stock of knowledge; the stock doesn't need to be divided up among all the people in the economy.

Contrast this with capital in a Solow model. If you add one computer, you make one worker more productive. If you add a new idea – think of the computer code for the first spreadsheet or word processor or even the internet itself – you can make any number of workers more productive. With non-rivalry, growth in income per person is tied to growth in the total stock of ideas – an aggregate – not to growth in ideas per person. 

It is very easy to get growth in an aggregate in any model, even in Solow, because of population growth. More auto workers mean that more cars are produced. In Solow, this cannot sustain per capita growth because we need growth in cars per auto worker. 

But in Romer, this is not the case – more researchers produce more ideas, which makes everyone better off because of non-rivalry. Throughout history – 25 years, 100 years or even 1,000 years – the world is characterised by substantial growth both in the total stock of ideas and in the number of people making them. According to Romer's insight, this is what sustains exponential growth in the long run.

Finally, the increasing returns associated with non-rivalry means that a perfectly competitive equilibrium with no externalities will not exist and cannot decentralize the allocation of resources. Instead, some departure is necessary.

Romer emphasised that both imperfect competition and externalities to the discovery of new ideas are likely to be important. Monopolistic competition provides the profits that act as the incentives for entrepreneurs to innovate. And later inventors and researchers benefit from the insights of those who came before. 

Research on economic growth has been monumentally influenced by Romer's contributions, and all of us who follow are standing on the shoulders of a giant. While it may be difficult to compensate adequately for the knowledge spillovers, this year's Nobel Prize in Economic Sciences is a well-deserved reward. 

References 

Romer, Paul M (1986), 'Increasing Returns and Long-Run Growth', Journal of Political Economy 94: 1002-37. 

Romer, Paul M (1990), 'Endogenous Technological Change', Journal of Political Economy 98(5): S71-102. 

Solow, Robert M (1956), 'A Contribution to the Theory of Economic Growth', Quarterly Journal of Economics 70(1): 65-94. 


--
John Case
Harpers Ferry, WV
Sign UP HERE to get the Weekly Program Notes.

Trumps Stimulus Trumps his Trade Policy

CFR Setser: Wonky, but another deep dive into the winners and losers in his tax cut/ trade war policy

Trump's Stimulus Trumps his Trade Policy

October 11, 2018

It is hard to think of a President more committed—at least rhetorically—to closing the trade balance than President Trump. The usual criticism of his trade policy is that it is overly focused on a single goal—reducing the bilateral, and ultimately the overall, trade deficit, to the exclusion of more traditional goals like liberalization (e.g. expanding trade) or expanding the scope of the traditional rules governing trade. President Trump has made it equally clear he cares about the manufacturing balance.   

Yet the results of the first seven quarters of his presidency show, ironically, the limits on what can be achieved through trade policy alone.

More on:

Trade


U.S. Economy

U.S. Trade Deficit


Donald Trump

To be sure, the impact of Trump's new tariffs (on China) and the new trade deal (with Canada and Mexico) aren't in the data yet. President Trump's trade policy for the first six quarters of his presidency consisted of halting further liberalization (by opting not to participate in the TPP) and a set of fairly narrow, sector specific trade cases (steel, solar, washing machines); the really big shift in policy is only now starting.  

But, well, the trade actions to date haven't come close to achieving the turnaround in manufacturing trade President Trump promised. Imports of manufactures are up significantly. (I forecast out the third quarter based on the first two months of data, if China's September numbers are indicative, I may have been too conservative).

[Graph 1] Cumulative Contribution from Manufac Goods Trade

I used a somewhat unconventional measure to look at changes in the real trade balance. I used the contributions data in the national income and product accounts rather than the trade data directly. And I calculated the contribution each quarter from the national income and product accounts data and then summed the contributions over time. This avoids the difficulties of scaling real trade measures to real GDP (I think) – and takes out the effect of price movement.

This allows me to paint a picture about what is happening to different sectors of the economy—manufacturing for example, petrol, and even services (though there isn't a story in the services data over the past few years)—as well as the overall numbers.*

What jumps out in the data on manufacturing trade? Well, two macroeconomic factors.

One: The dollar's 2014/15 appreciation led export growth to stall, and created a significant drag on the economy at a time when overall demand growth was weak. Falling exports added to the pressure on the manufacturing sector created by the fall in oil and agricultural investment (see Neil Irwin of the New York Times).

Two: Trump's stimulus has, as predicted, supported strong import growth—even in the face of Trump's "America first" trade policy.

Yep, so far Trump's overall policy mix—his combination of stimulative macroeconomic policies and more aggressive trade policy—has delivered a net stimulus of about 1 percent of U.S. GDP to the United States' main manufacturing trade partners. Trump's stimulus—and the still relatively strong dollar—are making German and Chinese exports great (again). In technical terms, the cumulative contribution of trade in core manufactures (capital goods, autos, and consumer goods in the trade data) has been negative 0.9 pp of GDP over the first six quarters of Trump's presidency, and based on the data for the first two months of the third quarter of 2017, the cumulative (negative) contribution will soon be over a percentage point of U.S. GDP.

Germany, Japan, Korea, China and many others certainly don't like Trump's challenge to the existing trade rules. But they all also have—to date—benefited from strong U.S. demand for exports. The recent import surge, when the q3 data is factored in, will have delivered a benefit to them that is roughly comparable in size to the swing associated with the dollar's 2014/15 rise.

We will see what happens when Trump's tariffs on China take place. Import growth could cool—the full tariffs would cover roughly a quarter of U.S. "core" goods imports (imports of consumer goods, capital goods, and autos). However, the net effect of putting tariffs on imports of around 2.5 percent of U.S. GDP depends on how much trade is diverted to other trade partners. And export growth also looks to be slowing on the back of the dollar's strength in the last two quarters, weakness in emerging economies and other countries' retaliation for Trump's trade action. Reducing your imports doesn't improve your trade balance if exports also fall.

At least for now, though, "macro" factors trump "micro" factors. Trump's stimulus has had a far bigger effect on the global economy than Trump's protectionism.

[Graph 2] Contributions from Goods Trade since 2011

Analysts who look at the nominal trade data haven't observed the deterioration in the trade balance that I have highlighted, at least not yet. The current account balance has also stayed relatively constant.

That isn't primarily because of services. Or even because of the income balance, though the surplus generated by the offshore profits of U.S. firms remains large. The main offset to the quite significant widening of the manufacturing deficit over the last four years has been the U.S. oil boom.

Those who argue that the U.S. can never grow through exports (or substituting domestic production for imports) should take close look at the oil sector. Over the last decade, the fall in the real petrol balance (e.g. rising domestic U.S. production relative to U.S. demand) has added close to two percentage points to U.S. growth.   

Final Real Net Petrol Graph 3

The improvement in the real petrol balance over the last six quarters has been about 0.5 pp of GDP (based on cumulative contributions), roughly half the deterioration in the non-oil goods balance.

A payoff from Trump's policy of "energy dominance"? Perhaps. But it is more likely a function of changes in the oil price, and the evolving cost structure of U.S. production. Fracking the Permian basin (in West Texas and New Mexico) has generated an amazing amount of oil, at a fairly low cost. The shale boom started under Obama—not under Trump—and it was initially propelled by a combination of a high global oil price, a weak dollar, and good old-fashioned American ingenuity.

The dominance of macroeconomic factors extends to one other component of the trade balance—tourism (tourism generally accounts for the bulk of the U.S. services surplus with East Asia; many other services, alas, seem to be exported primarily to tax havens***).

U.S. tourism imports (Americans taking vacations abroad) rise when the dollar is strong— and U.S. tourism exports (foreign tourists visiting the U.S.) tend to grow when the dollar is weak (e.g. 2005 to 2014).

Trump's more restrictive immigration policies have added some friction at the border no doubt. But the "stop" in tourism exports actually came in early 2015, six quarters before Trump (and a couple of quarters after the dollar moved).  

[Graph 4] Tourism Exports and the Dollar

One final point: I framed this as an argument that Trump's trade policy hasn't had the expected effect on the trade balance, as the evolution of the trade balance has been driven by macroeconomic factors—the dollar's strength, U.S. demand growth, and foreign demand growth. It equally could be presented as an argument that the overall macroeconomic effect of Trump's coming tariffs will be fairly modest so long as the Fed is free to react to any drag on U.S. activity from the tariffs. The aggregate effect on the economy of even relatively aggressive trade action—as Goldman Sach's economic research team has argued—ends up being fairly small in a standard macroeconomic model, absent a mistake by the Fed or a shock to "confidence." The sectoral effect, of course, remains significant (ask soybean farmers in the Dakotas). And, well, it is also worth remembering that the impact of the tariffs on China would also be expected to induce changes in China's policy mix. If China responds by using fiscal policy to stimulate domestic consumption demand, that's good for the world. But it stabilizes output by loosening monetary policy, that would typically be expected to result in a weaker currency —which would offset some of the impact of the tariff on China while shifting some of the pressure over to China's trade partners.

* Over the grand course of time, the contribution of exports and imports should generally balance out (no country can run a large trade deficit forever, though it is possible to run a modest trade deficit over time so long as the interest rate on a country's external borrowing is modest). A symmetric expansion of trade, if it reflects the healthy development of comparative advantage, raises the overall level of output as both partners specialize in what they do best. Such dynamic gains are by definition not captured in an analysis of the contribution of trade in the national income and product accounts. The national income and product accounts instead draw attention to the impact of trade on demand, and what matters there is the growth of exports relative to imports. Broadly speaking, what the trade data shows is that the U.S. has increasingly specialized in the production of goods and services for the domestic economy, rather than specializing in the production of goods and services for the global market. A drag on demand from trade has a much more negative overall economic impact if it comes at a time when overall demand is weak.

** The q2 data was heavily influenced by both changes in the petrol balance and changes in the food and feeds balance. In fact, the petrol and the "soybean" surge (measured in the food and feed balance) account for the entire increase in U.S. exports in q2. The available data suggests that the surge in soybean exports will reverse itself, but not likely until q4. For my forecast, I assumed 2018 q4 exports fell back to their q4 2017 level. They may be optimistic.

[Graph 6] Real Net Exports

*** I am only partially joking. Ireland is the number one destination for a lot of IPR related service exports, the Caribbean is the number one destination for exports of financial services. See tables 2.2 and 2.3 in the BEA's services trade data.

--
John Case
Harpers Ferry, WV
Sign UP HERE to get the Weekly Program Notes.

The impact of the US-China trade war on East Asia

...for those up to a deep dive into the China trade war dynamics.

The impact of the US-China trade war on East Asia

Massimiliano Calì 15 October 2018

The recent decision of the Trump administration to impose a new round of tariff increases on imports from China has taken the US-China trade dispute to a new level. The new list is subject to a 10 percentage point increase in import tariffs, which would be eventually raised to 25 percentage points at the end of the year. It represents a large expansion in the range of Chinese products included in the first two tranches of US import tariff hikes implemented on 6 July and 23 August. The policy has triggered retaliation. China raised tariffs by 25 percentage points on similar amounts of imports from the US on the same dates that the US tariffs came into force.1   

This protectionist tit-for-tat can have dramatic consequences for the economies of the warring parties, as the experience of the Great Depression illustrates (McDonald et al. 1997, Eichergreen and Irwin 2010). At the same time it can also affect third countries, especially those more economically linked to the US and China. In this column, I provide novel partial equilibrium estimates of the potential trade and investment impacts of the US-China trade dispute, focusing on East Asia.2 Countries in this region are the most exposed to the dispute given their integration with Chinese-led supply chains and the similarity of their export baskets with China. I focus on the impact on these countries of US tariff hikes on Chinese goods.  

Direct trade and investment impacts

I first estimate the expected import response to the tariff increase. To do so I combine HS-8 digit US import data for 2017 from the US Census Bureau of Statistics, HS-6 digit product-level price elasticity of US imports (estimated by Kee et al. 2008) and the published lists of Chinese products subject to the three tranches of US tariffs.3 I assume the price of import to increase proportionately with the tariff, which is then multiplied by the relevant elasticity and the import value to obtain the expected reduction in US import from China.

My calculations suggest that the total US imports from China in the affected products amounted to $234.8 billion in 2017, of which $188.9 billion have been targeted in the last tranche of tariffs (Table 1).4  Based on the data we use, the tariffs would reduce US imports from China by $68.6 billion, equivalent to 13.6% of total US imports from China and 3% of global Chinese merchandise exports. This expected drop in Chinese exports would translate into a reduction in domestic value added by $41.4 billion, a relatively modest 0.3% of Chinese GDP.5 This is an upper bound of the direct impact on Chinese exports, as it does not consider the possible re-direction of these exports towards third markets.

Table 1 Value of US imports from China targeted by the tariff measures

Source: Authors' estimation based on various USTR published documents (see footnote 3 for details) and US import data from US Census Bureau.

The bulk of the affected imports is concentrated in electronic equipment and machinery and their components (Figure 1). Electronic and optical equipment (including TV and sound recording devices) and their components, as well as machinery, boilers and mechanical appliances account for almost half of the expected drop in US imports from China. A significant amount of the import drop is also expected in consumer products, such as furniture, vehicles, leather articles and fish and crustaceans, which may have some direct impact on parts of the US household consumption basket.

Figure 1 Expected drop in US imports from China due to US tariffs hike, by HS-2 digit sector ($ million)

Source: Authors' estimates based on USTR, US Census and Kee et al. (2008)

The upside of the reduction in Chinese exports to the US is the potential diversion of US imports towards non-Chinese suppliers, particularly in East Asia, where export structures present some similarities with China. To get a sense of these potential export opportunities, I identify the Chinese products (at the HS-8 digit level) that are subject to higher tariffs in the US market and which happen to be also exported to the US by other East Asian countries for a value of at least $10 million in 2017. The intuition is that a country which is already exporting a non-negligible amount of the same product to the same market would be more likely to replace an existing exporter in that product-market pair.6

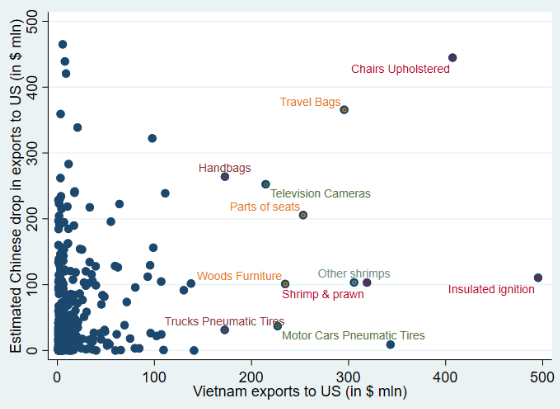
According to this metric, the replacement potential of Chinese exports in the US by East Asian countries – especially emerging economies – is quite significant. Vietnam, the Philippines, and Cambodia are the East Asian countries with the largest replacement potential relative to the size of their economy (Figure 2). The estimated drop in Chinese exports to the US in products which Vietnam already supplies to the  US for at least $10 million is worth 10.9% of Vietnam's GDP, or 4.4% of GDP when considering the associated domestic value added of these exports.7 The largest opportunities lie in those products where both the expected Chinese export drop and the existing Vietnamese exports to the US are large, such as chairs, insulated ignition, shrimp and prawns, travel bags, parts of seats, television cameras, wooden furniture and handbags (Figure 3). A much smaller set of products fulfils these characteristics for Cambodia, including plywood sheets, handbags, travel and sports bags, lighting sets for Christmas trees, dog or cat food, parts of seats and bicycles, reflecting the high concentration of its export basket. Taiwan, Singapore, Malaysia, and Thailand also have non-negligible exports replacement potential. The potential replacement is more limited for Indonesia. The drop of Chinese gross exports in products also exported by Indonesia to the US is worth 1.3% of GDP, with an associated domestic value added of 1.0% of GDP.8

Figure 2 Potential replacement of Chinese exports to the US, by countries (% of GDP)

Source: Authors' estimates based on data from USTR, US Census Bureau, OECD TiVA and Kee et al. (2008)

Figure 3 Main potential products where Vietnam could replace Chinese exports in the US

Source: Authors' estimates based on USTR, US census bureau and Kee et al. (2008)

By raising the cost of serving the US market from China, the trade war could also lead to diversion of investments towards third countries. This diversion would likely concern mainly Chinese investments seeking to by-pass US import tariff hikes. The extent to which investments may relocate towards other countries to serve the US market would partly depend on each country's ability of producing the same set of affected products for the relevant market and perceptions about the duration of the trade war. I measure this ability through the correlation index between the expected drop in US imports from China and US imports from each East Asian country in the HS 8-digit products subject to the tariffs.9 The value of the index is highest for Taiwan, followed by Thailand, Malaysia, Vietnam, and the Philippines (Figure 4). Indonesia and Myanmar have the lowest value of the index. While this ranking tries to capture only one of the several criteria used for investments choices, it is suggestive of the variation in the relative attractiveness across potential destinations for investments based on existing similar export basket as China. 

Figure 4 Degree of similarities of export baskets to the US with China for affected products
(index of correlation at HS-8 digit)

Source: Authors' estimates on the basis of US Bureau Census of Statistics

Indirect trade impact

While China has progressively absorbed large chunks of the value chain in various sectors (Kee and Tang 2016), it still relies on imports of foreign intermediates and final inputs for some of its production. East Asian countries are key suppliers of such intermediates and inputs to China. Hence, the expected drop in Chinese exports to the US may have knock-on effects on these countries via backward linkages. The extent of this impact would depend on what parts of the value chain each country contributes to. This in turn determines what intermediates and raw materials countries provide to China in the production of the products affected by the tariff hike. 

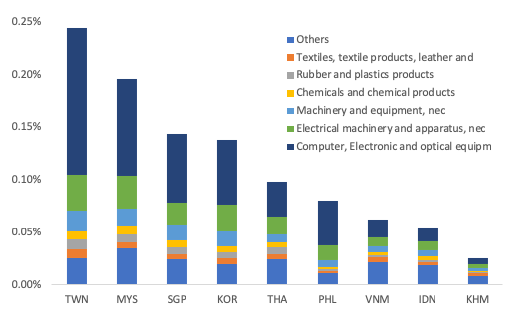
In order to gauge the importance of this channel, I match our estimated drop in Chinese exports at the HS-8 digit level with the country-specific shares of domestic value added in Chinese gross exports to the US in those products (available from OECD TiVA data).10 Taiwan and Malaysia are the East Asian countries that appear most vulnerable to the drop in Chinese exports via the supply chain with an estimated GDP loss of 0.24% and 0.20% respectively (Figure 5). That is mainly due to the countries' provision of inputs for Chinese exports to the US in electronic and optical equipment as well as electrical machinery, which account for two third of this loss. Singapore and South Korea, and Thailand are all expected to lose more than 0.1% of their GDP via this channel, while the effect for Cambodia, Indonesia and Vietnam are relatively muted given the low participation in Chinese-led global value chains. 

Figure 5 Estimated effects of US-China trade war on GDP via supply linkages

Source: Bank staff estimates based on data from USTR, US Census Bureau, OECD TiVA and Kee et al. (2008)

While these negative effects are smaller than the estimated (positive) export replacement potential, the two figures are not necessarily comparable. The latter are upper bound estimates of the potential for replacement. In fact, the true dimension of the replacement effect is likely to be considerably smaller than what is reported in Figure 2 for two reasons: first, each country would compete for the same potential market; second, any such replacement would hinge on the supply response in each country-product pairs, which could be relatively small (and even zero) in many cases. On the other hand, the effects via the supply chain are likely to provide a more precise order of magnitude of the actual losses. 

This type of analysis could help policymakers in East Asia (and beyond) identify the potential winners and losers among domestic producers from the US-China trade war. Governments could help the former replace Chinese exports in the US markets through measures such as facilitating access to imported inputs, which are heavily used by East Asian exporters, and ensuring the availability of finance, including trade finance, required for the additional production and exports. At the same time ,assistance to potential losers to reallocate their production and/or their labour could help minimise the domestic costs of the trade war. 

Author's note: This column does not necessarily reflect the views of the World Bank or of its member countries. The author is grateful to Ndiame Diop and Florian Moelders for useful comments and to Hazmi Ash Sidqi for excellent research assistance.

References

Cadot, O, M D Pierolaand F Rauch(2013), "Success and failure of African exporters", Journal of Development Economics 101: 284-296.

Eichergreen, B and D A Irwin (2010), "The Slide to Protectionism in the Great Depression: Who Succumbed and Why?", The Journal of Economic History 70(4): 871-897.

Kee, H L, A Nicita and M Olarreaga (2008), "Import demand elasticities and trade distortions", Review of Economics and Statistics 90(4): 666-682.

Kee, H L and H Tang (2016), "Domestic Value Added in Exports: Theory and Firm Evidence from China", American Economic Review 106(6): 1402–1436.

McDonald, J A, A P O'Brien and C M Callahan (1997), "Trade Wars: Canada's Reaction to the Smoot-Hawley Tariff", The Journal of Economic History 57(4): 802-826.

Endnotes

[1] Given the large Chinese bilateral trade surplus with the US, the last round of tariffs has been imposed by China on imports from the US worth less than half of the latest list of targeted Chinese exports to the US.

[2] The partial equilibrium analysis allows for highly sectoral disaggregated analysis and it relies on limited data requirement. On the other hand, it does not consider the general equilibrium and the feedback impacts, such as those emanating from the slower growth of China and the US as a result of the tariffs, from the change in international prices of the affected products or from the interactions (and substitutions) between markets.

[3] I estimate a 25 percentage point tariff increase also for the third tranche of US tariff increase. 

[4] Note that this figure is slightly lower than the $200 billion reported by the US government administration in last week's press release.

[5] This figure is obtained by matching the expected export drop with the sector-specific domestic value added in Chinese gross exports to the US derived from the OECD Trade in Value Added database.

[6] Cadot et al. (2013) provide some evidence from African exporters in support of this intuition. The $10 million threshold in existing exports allows to exclude all those products where a country is a marginal supplier to the US, which may make it more challenging to replace Chinese exports in those products. 

[7] To obtain this figure I use the sector-specific domestic value added in Vietnamese gross exports to the US, taken from OECD TiVA data.

[8] The large size of its economy along with the moderate penetration of its products in the US limit the potential replacement impact for Indonesia

[9] The intuition is that export similarity signals the existence in the country of established supply chains as well as the presence of adequate factors to produce the specific products.

[10] This OECD TiVA data is available for 2011 and relies on a much more aggregated level of sectoral breakdown (only 18 macro sectors) than the tariff data. I match the two sectoral classifications using the ISIC Rev. 4 classification as the bridge.

--
John Case
Harpers Ferry, WV
Sign UP HERE to get the Weekly Program Notes.